Free Statistics
of Irreproducible Research!
Description of Statistical Computation | |||||||||||||||||||||||||||||||||||||||||||||||||||||
|---|---|---|---|---|---|---|---|---|---|---|---|---|---|---|---|---|---|---|---|---|---|---|---|---|---|---|---|---|---|---|---|---|---|---|---|---|---|---|---|---|---|---|---|---|---|---|---|---|---|---|---|---|---|
| Author's title | |||||||||||||||||||||||||||||||||||||||||||||||||||||
| Author | *The author of this computation has been verified* | ||||||||||||||||||||||||||||||||||||||||||||||||||||
| R Software Module | rwasp_bidataseries.wasp | ||||||||||||||||||||||||||||||||||||||||||||||||||||
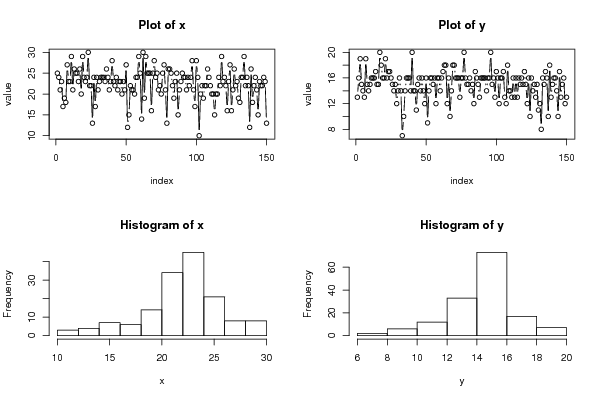
| Title produced by software | Bivariate Data Series | ||||||||||||||||||||||||||||||||||||||||||||||||||||
| Date of computation | Sat, 18 Dec 2010 20:16:24 +0000 | ||||||||||||||||||||||||||||||||||||||||||||||||||||
| Cite this page as follows | Statistical Computations at FreeStatistics.org, Office for Research Development and Education, URL https://freestatistics.org/blog/index.php?v=date/2010/Dec/18/t129270326765pazzzvklwac3k.htm/, Retrieved Tue, 30 Apr 2024 01:09:40 +0000 | ||||||||||||||||||||||||||||||||||||||||||||||||||||
| Statistical Computations at FreeStatistics.org, Office for Research Development and Education, URL https://freestatistics.org/blog/index.php?pk=112188, Retrieved Tue, 30 Apr 2024 01:09:40 +0000 | |||||||||||||||||||||||||||||||||||||||||||||||||||||
| QR Codes: | |||||||||||||||||||||||||||||||||||||||||||||||||||||
|
| |||||||||||||||||||||||||||||||||||||||||||||||||||||
| Original text written by user: | |||||||||||||||||||||||||||||||||||||||||||||||||||||
| IsPrivate? | No (this computation is public) | ||||||||||||||||||||||||||||||||||||||||||||||||||||
| User-defined keywords | |||||||||||||||||||||||||||||||||||||||||||||||||||||
| Estimated Impact | 110 | ||||||||||||||||||||||||||||||||||||||||||||||||||||
Tree of Dependent Computations | |||||||||||||||||||||||||||||||||||||||||||||||||||||
| Family? (F = Feedback message, R = changed R code, M = changed R Module, P = changed Parameters, D = changed Data) | |||||||||||||||||||||||||||||||||||||||||||||||||||||
| - [Bivariate Data Series] [Bivariate dataset] [2008-01-05 23:51:08] [74be16979710d4c4e7c6647856088456] - MPD [Bivariate Data Series] [Run Sequence Plot...] [2010-12-18 20:16:24] [dfb0309aec67f282200eef05efe0d5bd] [Current] | |||||||||||||||||||||||||||||||||||||||||||||||||||||
| Feedback Forum | |||||||||||||||||||||||||||||||||||||||||||||||||||||
Post a new message | |||||||||||||||||||||||||||||||||||||||||||||||||||||
Dataset | |||||||||||||||||||||||||||||||||||||||||||||||||||||
| Dataseries X: | |||||||||||||||||||||||||||||||||||||||||||||||||||||
25 24 21 23 17 19 18 27 23 23 29 21 26 25 25 23 26 20 29 24 23 24 30 22 22 13 24 17 24 21 23 24 24 24 23 26 24 21 23 28 23 22 24 21 23 23 20 23 21 27 12 15 22 21 21 20 24 24 29 25 14 30 19 29 25 25 25 16 25 28 24 25 21 22 20 25 27 21 13 26 26 25 22 19 23 25 15 21 23 25 24 24 21 24 22 24 28 21 17 28 24 10 20 22 19 22 22 26 24 22 20 20 15 20 20 24 22 29 23 24 22 16 23 27 16 21 26 22 23 19 18 24 24 29 22 24 22 12 26 18 22 24 21 15 23 22 22 24 23 13 | |||||||||||||||||||||||||||||||||||||||||||||||||||||
| Dataseries Y: | |||||||||||||||||||||||||||||||||||||||||||||||||||||
13 16 19 15 14 13 19 15 14 15 16 16 16 17 15 15 20 18 16 16 19 16 17 17 16 15 14 15 12 14 16 14 7 10 14 16 16 16 14 20 14 14 11 15 16 14 16 14 12 16 9 14 16 16 15 16 12 16 16 14 16 17 18 18 12 16 10 14 18 18 16 16 16 13 16 16 20 16 15 15 16 14 15 12 17 16 15 13 16 16 16 16 14 16 16 20 15 16 13 17 16 12 16 16 17 13 12 18 14 14 13 16 13 16 13 16 15 16 15 17 15 12 16 10 16 14 15 13 15 11 12 8 16 15 17 16 10 18 13 15 16 16 14 10 17 13 15 16 12 13 | |||||||||||||||||||||||||||||||||||||||||||||||||||||
Tables (Output of Computation) | |||||||||||||||||||||||||||||||||||||||||||||||||||||
| |||||||||||||||||||||||||||||||||||||||||||||||||||||
Figures (Output of Computation) | |||||||||||||||||||||||||||||||||||||||||||||||||||||
Input Parameters & R Code | |||||||||||||||||||||||||||||||||||||||||||||||||||||
| Parameters (Session): | |||||||||||||||||||||||||||||||||||||||||||||||||||||
| par1 = 20 ; | |||||||||||||||||||||||||||||||||||||||||||||||||||||
| Parameters (R input): | |||||||||||||||||||||||||||||||||||||||||||||||||||||
| par1 = Organisatorisch talent ; par2 = ; par3 = Organisatorisch talent van de student ; par4 = Leercompetentie ; par5 = ; par6 = Leercompetentie van de student ; | |||||||||||||||||||||||||||||||||||||||||||||||||||||
| R code (references can be found in the software module): | |||||||||||||||||||||||||||||||||||||||||||||||||||||
bitmap(file='test1.png') | |||||||||||||||||||||||||||||||||||||||||||||||||||||