| Multiple Linear Regression - Estimated Regression Equation |
| Faillissementen[t] = -101.296914358582 + 1.19211826327857Y1[t] -0.0303519024107213Y2[t] -0.269812974917130Y3[t] + 17.1473915256253t + e[t] |
| Multiple Linear Regression - Ordinary Least Squares | |||||
| Variable | Parameter | S.D. | T-STAT H0: parameter = 0 | 2-tail p-value | 1-tail p-value |
| (Intercept) | -101.296914358582 | 79.372341 | -1.2762 | 0.207658 | 0.103829 |
| Y1 | 1.19211826327857 | 0.134173 | 8.8849 | 0 | 0 |
| Y2 | -0.0303519024107213 | 0.213986 | -0.1418 | 0.887765 | 0.443882 |
| Y3 | -0.269812974917130 | 0.133225 | -2.0252 | 0.048091 | 0.024046 |
| t | 17.1473915256253 | 6.247962 | 2.7445 | 0.008347 | 0.004173 |
| Multiple Linear Regression - Regression Statistics | |
| Multiple R | 0.99540113961845 |
| R-squared | 0.990823428753708 |
| Adjusted R-squared | 0.990103697675567 |
| F-TEST (value) | 1376.65783630393 |
| F-TEST (DF numerator) | 4 |
| F-TEST (DF denominator) | 51 |
| p-value | 0 |
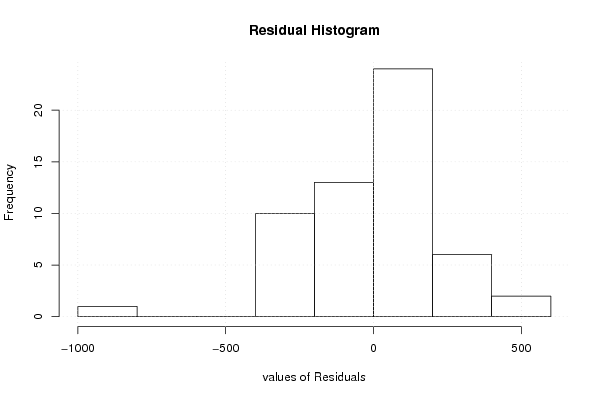
| Multiple Linear Regression - Residual Statistics | |
| Residual Standard Deviation | 246.141268837931 |
| Sum Squared Residuals | 3089861.73548248 |
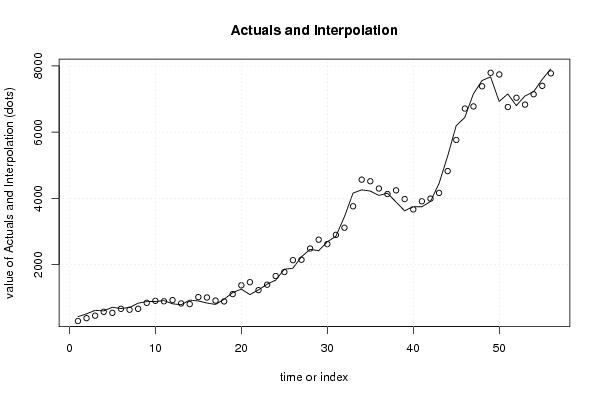
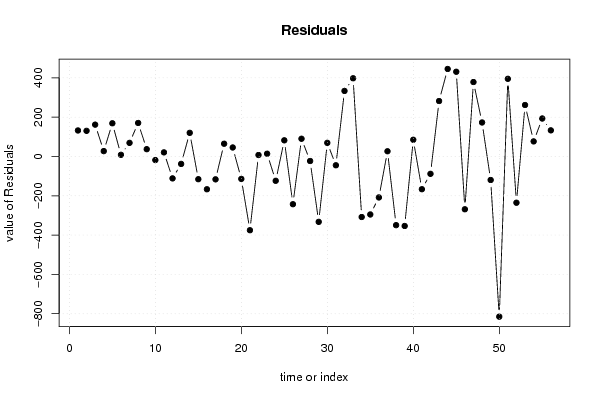
| Multiple Linear Regression - Actuals, Interpolation, and Residuals | |||
| Time or Index | Actuals | Interpolation Forecast | Residuals Prediction Error |
| 1 | 432 | 299.740944333240 | 132.259055666760 |
| 2 | 517 | 386.617955545198 | 130.382044454802 |
| 3 | 623 | 461.082343070225 | 161.917656929775 |
| 4 | 605 | 577.731191055927 | 27.2688089440734 |
| 5 | 716 | 547.269049319045 | 168.730950680955 |
| 6 | 677 | 668.687726970769 | 8.3122730292308 |
| 7 | 710 | 640.830078609448 | 69.1699213905517 |
| 8 | 839 | 668.551856801484 | 170.448143198516 |
| 9 | 886 | 849.003597532259 | 36.9964024677409 |
| 10 | 891 | 909.361323848729 | -18.3613238487291 |
| 11 | 917 | 896.236893513134 | 20.7631064868662 |
| 12 | 820 | 931.546390550843 | -111.546390550843 |
| 13 | 793 | 830.920096201182 | -37.9200962011824 |
| 14 | 932 | 811.809291804281 | 120.190708195719 |
| 15 | 906 | 1021.65248185768 | -115.652481857679 |
| 16 | 844 | 1010.87083442573 | -166.870834425734 |
| 17 | 801 | 917.392039577285 | -116.392039577285 |
| 18 | 957 | 892.175301079242 | 64.8246989207585 |
| 19 | 1159 | 1113.32667792485 | 45.6733220751523 |
| 20 | 1264 | 1378.14901977811 | -114.149019778109 |
| 21 | 1097 | 1472.24692057395 | -375.246920573946 |
| 22 | 1240 | 1232.62139144566 | 7.37860855433611 |
| 23 | 1411 | 1396.98009995642 | 14.0199000435826 |
| 24 | 1535 | 1658.69815926911 | -123.698159269106 |
| 25 | 1862 | 1779.89478471589 | 82.1052152841083 |
| 26 | 1894 | 2136.96319372385 | -242.963193723852 |
| 27 | 2239 | 2148.87648869636 | 90.1235113036381 |
| 28 | 2465 | 2488.10457737805 | -23.1045773780508 |
| 29 | 2423 | 2755.56527487559 | -332.565274875587 |
| 30 | 2692 | 2622.69869305228 | 69.3013069477208 |
| 31 | 2856 | 2900.82294496982 | -44.8229449698199 |
| 32 | 3450 | 3116.64521487117 | 333.354785128833 |
| 33 | 4162 | 3764.3534525362 | 397.646547463801 |
| 34 | 4260 | 4568.01068959779 | -308.010689597791 |
| 35 | 4225 | 4520.10620930751 | -295.106209307508 |
| 36 | 4092 | 4300.44813704114 | -208.448137041136 |
| 37 | 4160 | 4133.66444459321 | 26.3355554067921 |
| 38 | 3896 | 4245.3561351645 | -349.356135164502 |
| 39 | 3628 | 3981.60550148463 | -353.605501484632 |
| 40 | 3754 | 3668.93081839367 | 85.0691816063345 |
| 41 | 3749 | 3915.65004631659 | -166.650046316587 |
| 42 | 3907 | 3995.32238409986 | -88.3223840998592 |
| 43 | 4449 | 4166.97978589599 | 282.020214104006 |
| 44 | 5272 | 4826.8087404123 | 445.191259587702 |
| 45 | 6197 | 5765.98828147267 | 431.011718527327 |
| 46 | 6446 | 6714.62681844187 | -268.626818441871 |
| 47 | 7157 | 6778.48006943715 | 378.519930562854 |
| 48 | 7559 | 7386.08892065522 | 172.911079344777 |
| 49 | 7674 | 7793.70422065045 | -119.704220650447 |
| 50 | 6929 | 7743.90672251792 | -814.90672251792 |
| 51 | 7156 | 6760.97072320709 | 395.029276792913 |
| 52 | 6805 | 7040.31263567747 | -235.312635677467 |
| 53 | 7095 | 6833.14730125834 | 261.85269874166 |
| 54 | 7222 | 7145.41496157473 | 76.5850384252726 |
| 55 | 7593 | 7399.86367503353 | 193.136324966466 |
| 56 | 7910 | 7777.18648790338 | 132.813512096618 |
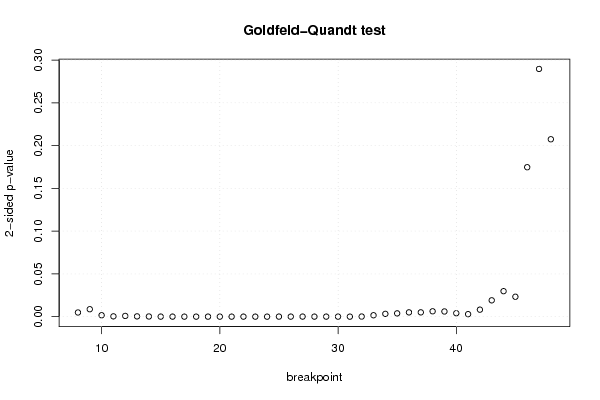
| Goldfeld-Quandt test for Heteroskedasticity | |||
| p-values | Alternative Hypothesis | ||
| breakpoint index | greater | 2-sided | less |
| 8 | 0.00244144408059051 | 0.00488288816118103 | 0.99755855591941 |
| 9 | 0.00435185609075723 | 0.00870371218151446 | 0.995648143909243 |
| 10 | 0.000822025895126926 | 0.00164405179025385 | 0.999177974104873 |
| 11 | 0.000179633514469794 | 0.000359267028939587 | 0.99982036648553 |
| 12 | 0.000433845244350814 | 0.000867690488701629 | 0.99956615475565 |
| 13 | 0.000164957394748326 | 0.000329914789496652 | 0.999835042605252 |
| 14 | 0.000100436975472271 | 0.000200873950944542 | 0.999899563024528 |
| 15 | 2.60751111216968e-05 | 5.21502222433937e-05 | 0.999973924888878 |
| 16 | 6.6663563279681e-06 | 1.33327126559362e-05 | 0.999993333643672 |
| 17 | 2.81431003754977e-06 | 5.62862007509953e-06 | 0.999997185689962 |
| 18 | 2.38175391977469e-06 | 4.76350783954937e-06 | 0.99999761824608 |
| 19 | 6.76932231245958e-06 | 1.35386446249192e-05 | 0.999993230677688 |
| 20 | 3.82931962035169e-06 | 7.65863924070338e-06 | 0.99999617068038 |
| 21 | 2.52464092740856e-06 | 5.04928185481711e-06 | 0.999997475359073 |
| 22 | 4.45892027304082e-06 | 8.91784054608164e-06 | 0.999995541079727 |
| 23 | 2.77937273998839e-06 | 5.55874547997679e-06 | 0.99999722062726 |
| 24 | 2.38005777129474e-06 | 4.76011554258948e-06 | 0.999997619942229 |
| 25 | 3.36362758694953e-05 | 6.72725517389905e-05 | 0.99996636372413 |
| 26 | 1.39383714254451e-05 | 2.78767428508902e-05 | 0.999986061628575 |
| 27 | 3.82654989000391e-05 | 7.65309978000781e-05 | 0.9999617345011 |
| 28 | 1.61559117697971e-05 | 3.23118235395942e-05 | 0.99998384408823 |
| 29 | 2.23394061559307e-05 | 4.46788123118614e-05 | 0.999977660593844 |
| 30 | 1.31779128579865e-05 | 2.63558257159730e-05 | 0.999986822087142 |
| 31 | 4.96696969893799e-06 | 9.93393939787597e-06 | 0.9999950330303 |
| 32 | 5.96556319420655e-05 | 0.000119311263884131 | 0.999940344368058 |
| 33 | 0.000824312233836671 | 0.00164862446767334 | 0.999175687766163 |
| 34 | 0.00164803697449291 | 0.00329607394898582 | 0.998351963025507 |
| 35 | 0.00192346426445346 | 0.00384692852890691 | 0.998076535735547 |
| 36 | 0.00251605243474725 | 0.0050321048694945 | 0.997483947565253 |
| 37 | 0.00252003407996341 | 0.00504006815992681 | 0.997479965920037 |
| 38 | 0.00313205005609548 | 0.00626410011219095 | 0.996867949943905 |
| 39 | 0.00303550618369456 | 0.00607101236738913 | 0.996964493816305 |
| 40 | 0.00201460564085960 | 0.00402921128171921 | 0.99798539435914 |
| 41 | 0.00146921522417916 | 0.00293843044835831 | 0.99853078477582 |
| 42 | 0.00408901412275406 | 0.00817802824550813 | 0.995910985877246 |
| 43 | 0.00955581368831517 | 0.0191116273766303 | 0.990444186311685 |
| 44 | 0.0148924708686042 | 0.0297849417372085 | 0.985107529131396 |
| 45 | 0.0116425823372904 | 0.0232851646745807 | 0.98835741766271 |
| 46 | 0.0873485386716586 | 0.174697077343317 | 0.912651461328341 |
| 47 | 0.144794987437148 | 0.289589974874295 | 0.855205012562853 |
| 48 | 0.103700534379981 | 0.207401068759961 | 0.89629946562002 |
| Meta Analysis of Goldfeld-Quandt test for Heteroskedasticity | |||
| Description | # significant tests | % significant tests | OK/NOK |
| 1% type I error level | 35 | 0.853658536585366 | NOK |
| 5% type I error level | 38 | 0.926829268292683 | NOK |
| 10% type I error level | 38 | 0.926829268292683 | NOK |