Free Statistics

of Irreproducible Research!

Author's title

Author*The author of this computation has been verified*
R Software Modulerwasp_multipleregression.wasp
Title produced by softwareMultiple Regression
Date of computationSat, 18 Dec 2010 19:33:04 +0000
Cite this page as followsStatistical Computations at FreeStatistics.org, Office for Research Development and Education, URL https://freestatistics.org/blog/index.php?v=date/2010/Dec/18/t1292700878lj9ltw0jdklli1v.htm/, Retrieved Tue, 30 Apr 2024 07:08:40 +0000
Statistical Computations at FreeStatistics.org, Office for Research Development and Education, URL https://freestatistics.org/blog/index.php?pk=112172, Retrieved Tue, 30 Apr 2024 07:08:40 +0000
QR Codes:

Original text written by user:
IsPrivate?No (this computation is public)
User-defined keywords
Estimated Impact152
Family? (F = Feedback message, R = changed R code, M = changed R Module, P = changed Parameters, D = changed Data)
-     [Univariate Data Series] [data set] [2008-12-01 19:54:57] [b98453cac15ba1066b407e146608df68]
- RMP   [(Partial) Autocorrelation Function] [Workshop 8 Autoco...] [2010-11-28 16:39:23] [945bcebba5e7ac34a41d6888338a1ba9]
- RMP     [Classical Decomposition] [workshop 8 Klassi...] [2010-11-28 17:01:52] [945bcebba5e7ac34a41d6888338a1ba9]
- RMPD      [Exponential Smoothing] [Paper TSA Exponen...] [2010-12-18 18:11:45] [945bcebba5e7ac34a41d6888338a1ba9]
- RMPD          [Multiple Regression] [Paper TSA MR Fail...] [2010-12-18 19:33:04] [514029464b0621595fe21c9fa38c7009] [Current]
Feedback Forum

Post a new message
Dataseries X:
432	342	189	67
517	432	342	189
623	517	432	342
605	623	517	432
716	605	623	517
677	716	605	623
710	677	716	605
839	710	677	716
886	839	710	677
891	886	839	710
917	891	886	839
820	917	891	886
793	820	917	891
932	793	820	917
906	932	793	820
844	906	932	793
801	844	906	932
957	801	844	906
1159	957	801	844
1264	1159	957	801
1097	1264	1159	957
1240	1097	1264	1159
1411	1240	1097	1264
1535	1411	1240	1097
1862	1535	1411	1240
1894	1862	1535	1411
2239	1894	1862	1535
2465	2239	1894	1862
2423	2465	2239	1894
2692	2423	2465	2239
2856	2692	2423	2465
3450	2856	2692	2423
4162	3450	2856	2692
4260	4162	3450	2856
4225	4260	4162	3450
4092	4225	4260	4162
4160	4092	4225	4260
3896	4160	4092	4225
3628	3896	4160	4092
3754	3628	3896	4160
3749	3754	3628	3896
3907	3749	3754	3628
4449	3907	3749	3754
5272	4449	3907	3749
6197	5272	4449	3907
6446	6197	5272	4449
7157	6446	6197	5272
7559	7157	6446	6197
7674	7559	7157	6446
6929	7674	7559	7157
7156	6929	7674	7559
6805	7156	6929	7674
7095	6805	7156	6929
7222	7095	6805	7156
7593	7222	7095	6805
7910	7593	7222	7095


Summary of computational transaction
Raw Inputview raw input (R code)
Raw Outputview raw output of R engine
Computing time6 seconds
R Server'Gwilym Jenkins' @ 72.249.127.135

\begin{tabular}{lllllllll}
\hline
Summary of computational transaction \tabularnewline
Raw Input & view raw input (R code)  \tabularnewline
Raw Output & view raw output of R engine  \tabularnewline
Computing time & 6 seconds \tabularnewline
R Server & 'Gwilym Jenkins' @ 72.249.127.135 \tabularnewline
\hline
\end{tabular}
%Source: https://freestatistics.org/blog/index.php?pk=112172&T=0

[TABLE]
[ROW][C]Summary of computational transaction[/C][/ROW]
[ROW][C]Raw Input[/C][C]view raw input (R code) [/C][/ROW]
[ROW][C]Raw Output[/C][C]view raw output of R engine [/C][/ROW]
[ROW][C]Computing time[/C][C]6 seconds[/C][/ROW]
[ROW][C]R Server[/C][C]'Gwilym Jenkins' @ 72.249.127.135[/C][/ROW]
[/TABLE]
Source: https://freestatistics.org/blog/index.php?pk=112172&T=0

Globally Unique Identifier (entire table): ba.freestatistics.org/blog/index.php?pk=112172&T=0

As an alternative you can also use a QR Code:  

The GUIDs for individual cells are displayed in the table below:

Summary of computational transaction
Raw Inputview raw input (R code)
Raw Outputview raw output of R engine
Computing time6 seconds
R Server'Gwilym Jenkins' @ 72.249.127.135


Multiple Linear Regression - Estimated Regression Equation
Faillissementen[t] = -101.296914358582 + 1.19211826327857Y1[t] -0.0303519024107213Y2[t] -0.269812974917130Y3[t] + 17.1473915256253t + e[t]

\begin{tabular}{lllllllll}
\hline
Multiple Linear Regression - Estimated Regression Equation \tabularnewline
Faillissementen[t] =  -101.296914358582 +  1.19211826327857Y1[t] -0.0303519024107213Y2[t] -0.269812974917130Y3[t] +  17.1473915256253t  + e[t] \tabularnewline
\hline
\end{tabular}
%Source: https://freestatistics.org/blog/index.php?pk=112172&T=1

[TABLE]
[ROW][C]Multiple Linear Regression - Estimated Regression Equation[/C][/ROW]
[ROW][C]Faillissementen[t] =  -101.296914358582 +  1.19211826327857Y1[t] -0.0303519024107213Y2[t] -0.269812974917130Y3[t] +  17.1473915256253t  + e[t][/C][/ROW]
[/TABLE]
Source: https://freestatistics.org/blog/index.php?pk=112172&T=1

Globally Unique Identifier (entire table): ba.freestatistics.org/blog/index.php?pk=112172&T=1

As an alternative you can also use a QR Code:  

The GUIDs for individual cells are displayed in the table below:

Multiple Linear Regression - Estimated Regression Equation
Faillissementen[t] = -101.296914358582 + 1.19211826327857Y1[t] -0.0303519024107213Y2[t] -0.269812974917130Y3[t] + 17.1473915256253t + e[t]


Multiple Linear Regression - Ordinary Least Squares
VariableParameterS.D.T-STATH0: parameter = 02-tail p-value1-tail p-value
(Intercept)-101.29691435858279.372341-1.27620.2076580.103829
Y11.192118263278570.1341738.884900
Y2-0.03035190241072130.213986-0.14180.8877650.443882
Y3-0.2698129749171300.133225-2.02520.0480910.024046
t17.14739152562536.2479622.74450.0083470.004173

\begin{tabular}{lllllllll}
\hline
Multiple Linear Regression - Ordinary Least Squares \tabularnewline
Variable & Parameter & S.D. & T-STATH0: parameter = 0 & 2-tail p-value & 1-tail p-value \tabularnewline
(Intercept) & -101.296914358582 & 79.372341 & -1.2762 & 0.207658 & 0.103829 \tabularnewline
Y1 & 1.19211826327857 & 0.134173 & 8.8849 & 0 & 0 \tabularnewline
Y2 & -0.0303519024107213 & 0.213986 & -0.1418 & 0.887765 & 0.443882 \tabularnewline
Y3 & -0.269812974917130 & 0.133225 & -2.0252 & 0.048091 & 0.024046 \tabularnewline
t & 17.1473915256253 & 6.247962 & 2.7445 & 0.008347 & 0.004173 \tabularnewline
\hline
\end{tabular}
%Source: https://freestatistics.org/blog/index.php?pk=112172&T=2

[TABLE]
[ROW][C]Multiple Linear Regression - Ordinary Least Squares[/C][/ROW]
[ROW][C]Variable[/C][C]Parameter[/C][C]S.D.[/C][C]T-STATH0: parameter = 0[/C][C]2-tail p-value[/C][C]1-tail p-value[/C][/ROW]
[ROW][C](Intercept)[/C][C]-101.296914358582[/C][C]79.372341[/C][C]-1.2762[/C][C]0.207658[/C][C]0.103829[/C][/ROW]
[ROW][C]Y1[/C][C]1.19211826327857[/C][C]0.134173[/C][C]8.8849[/C][C]0[/C][C]0[/C][/ROW]
[ROW][C]Y2[/C][C]-0.0303519024107213[/C][C]0.213986[/C][C]-0.1418[/C][C]0.887765[/C][C]0.443882[/C][/ROW]
[ROW][C]Y3[/C][C]-0.269812974917130[/C][C]0.133225[/C][C]-2.0252[/C][C]0.048091[/C][C]0.024046[/C][/ROW]
[ROW][C]t[/C][C]17.1473915256253[/C][C]6.247962[/C][C]2.7445[/C][C]0.008347[/C][C]0.004173[/C][/ROW]
[/TABLE]
Source: https://freestatistics.org/blog/index.php?pk=112172&T=2

Globally Unique Identifier (entire table): ba.freestatistics.org/blog/index.php?pk=112172&T=2

As an alternative you can also use a QR Code:  

The GUIDs for individual cells are displayed in the table below:

Multiple Linear Regression - Ordinary Least Squares
VariableParameterS.D.T-STATH0: parameter = 02-tail p-value1-tail p-value
(Intercept)-101.29691435858279.372341-1.27620.2076580.103829
Y11.192118263278570.1341738.884900
Y2-0.03035190241072130.213986-0.14180.8877650.443882
Y3-0.2698129749171300.133225-2.02520.0480910.024046
t17.14739152562536.2479622.74450.0083470.004173


Multiple Linear Regression - Regression Statistics
Multiple R0.99540113961845
R-squared0.990823428753708
Adjusted R-squared0.990103697675567
F-TEST (value)1376.65783630393
F-TEST (DF numerator)4
F-TEST (DF denominator)51
p-value0
Multiple Linear Regression - Residual Statistics
Residual Standard Deviation246.141268837931
Sum Squared Residuals3089861.73548248

\begin{tabular}{lllllllll}
\hline
Multiple Linear Regression - Regression Statistics \tabularnewline
Multiple R & 0.99540113961845 \tabularnewline
R-squared & 0.990823428753708 \tabularnewline
Adjusted R-squared & 0.990103697675567 \tabularnewline
F-TEST (value) & 1376.65783630393 \tabularnewline
F-TEST (DF numerator) & 4 \tabularnewline
F-TEST (DF denominator) & 51 \tabularnewline
p-value & 0 \tabularnewline
Multiple Linear Regression - Residual Statistics \tabularnewline
Residual Standard Deviation & 246.141268837931 \tabularnewline
Sum Squared Residuals & 3089861.73548248 \tabularnewline
\hline
\end{tabular}
%Source: https://freestatistics.org/blog/index.php?pk=112172&T=3

[TABLE]
[ROW][C]Multiple Linear Regression - Regression Statistics[/C][/ROW]
[ROW][C]Multiple R[/C][C]0.99540113961845[/C][/ROW]
[ROW][C]R-squared[/C][C]0.990823428753708[/C][/ROW]
[ROW][C]Adjusted R-squared[/C][C]0.990103697675567[/C][/ROW]
[ROW][C]F-TEST (value)[/C][C]1376.65783630393[/C][/ROW]
[ROW][C]F-TEST (DF numerator)[/C][C]4[/C][/ROW]
[ROW][C]F-TEST (DF denominator)[/C][C]51[/C][/ROW]
[ROW][C]p-value[/C][C]0[/C][/ROW]
[ROW][C]Multiple Linear Regression - Residual Statistics[/C][/ROW]
[ROW][C]Residual Standard Deviation[/C][C]246.141268837931[/C][/ROW]
[ROW][C]Sum Squared Residuals[/C][C]3089861.73548248[/C][/ROW]
[/TABLE]
Source: https://freestatistics.org/blog/index.php?pk=112172&T=3

Globally Unique Identifier (entire table): ba.freestatistics.org/blog/index.php?pk=112172&T=3

As an alternative you can also use a QR Code:  

The GUIDs for individual cells are displayed in the table below:

Multiple Linear Regression - Regression Statistics
Multiple R0.99540113961845
R-squared0.990823428753708
Adjusted R-squared0.990103697675567
F-TEST (value)1376.65783630393
F-TEST (DF numerator)4
F-TEST (DF denominator)51
p-value0
Multiple Linear Regression - Residual Statistics
Residual Standard Deviation246.141268837931
Sum Squared Residuals3089861.73548248


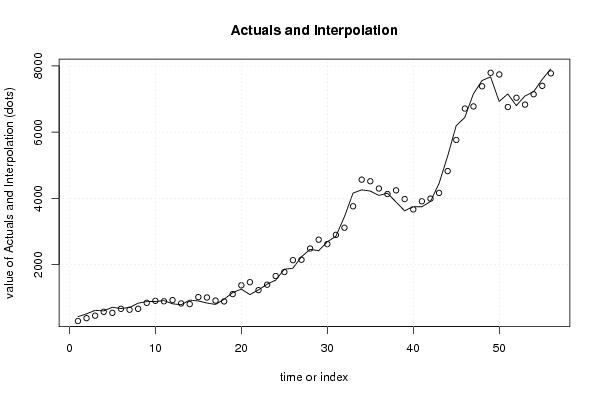
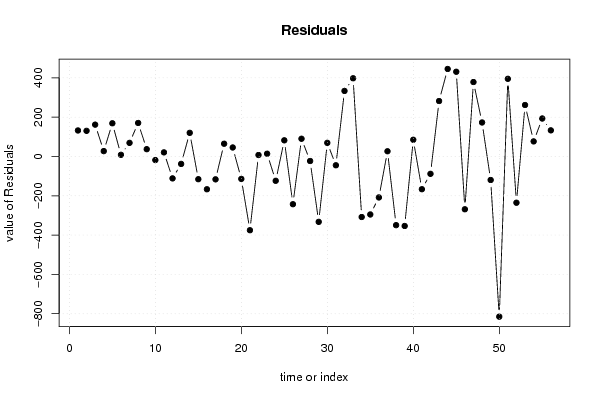
Multiple Linear Regression - Actuals, Interpolation, and Residuals
Time or IndexActualsInterpolationForecastResidualsPrediction Error
1432299.740944333240132.259055666760
2517386.617955545198130.382044454802
3623461.082343070225161.917656929775
4605577.73119105592727.2688089440734
5716547.269049319045168.730950680955
6677668.6877269707698.3122730292308
7710640.83007860944869.1699213905517
8839668.551856801484170.448143198516
9886849.00359753225936.9964024677409
10891909.361323848729-18.3613238487291
11917896.23689351313420.7631064868662
12820931.546390550843-111.546390550843
13793830.920096201182-37.9200962011824
14932811.809291804281120.190708195719
159061021.65248185768-115.652481857679
168441010.87083442573-166.870834425734
17801917.392039577285-116.392039577285
18957892.17530107924264.8246989207585
1911591113.3266779248545.6733220751523
2012641378.14901977811-114.149019778109
2110971472.24692057395-375.246920573946
2212401232.621391445667.37860855433611
2314111396.9800999564214.0199000435826
2415351658.69815926911-123.698159269106
2518621779.8947847158982.1052152841083
2618942136.96319372385-242.963193723852
2722392148.8764886963690.1235113036381
2824652488.10457737805-23.1045773780508
2924232755.56527487559-332.565274875587
3026922622.6986930522869.3013069477208
3128562900.82294496982-44.8229449698199
3234503116.64521487117333.354785128833
3341623764.3534525362397.646547463801
3442604568.01068959779-308.010689597791
3542254520.10620930751-295.106209307508
3640924300.44813704114-208.448137041136
3741604133.6644445932126.3355554067921
3838964245.3561351645-349.356135164502
3936283981.60550148463-353.605501484632
4037543668.9308183936785.0691816063345
4137493915.65004631659-166.650046316587
4239073995.32238409986-88.3223840998592
4344494166.97978589599282.020214104006
4452724826.8087404123445.191259587702
4561975765.98828147267431.011718527327
4664466714.62681844187-268.626818441871
4771576778.48006943715378.519930562854
4875597386.08892065522172.911079344777
4976747793.70422065045-119.704220650447
5069297743.90672251792-814.90672251792
5171566760.97072320709395.029276792913
5268057040.31263567747-235.312635677467
5370956833.14730125834261.85269874166
5472227145.4149615747376.5850384252726
5575937399.86367503353193.136324966466
5679107777.18648790338132.813512096618

\begin{tabular}{lllllllll}
\hline
Multiple Linear Regression - Actuals, Interpolation, and Residuals \tabularnewline
Time or Index & Actuals & InterpolationForecast & ResidualsPrediction Error \tabularnewline
1 & 432 & 299.740944333240 & 132.259055666760 \tabularnewline
2 & 517 & 386.617955545198 & 130.382044454802 \tabularnewline
3 & 623 & 461.082343070225 & 161.917656929775 \tabularnewline
4 & 605 & 577.731191055927 & 27.2688089440734 \tabularnewline
5 & 716 & 547.269049319045 & 168.730950680955 \tabularnewline
6 & 677 & 668.687726970769 & 8.3122730292308 \tabularnewline
7 & 710 & 640.830078609448 & 69.1699213905517 \tabularnewline
8 & 839 & 668.551856801484 & 170.448143198516 \tabularnewline
9 & 886 & 849.003597532259 & 36.9964024677409 \tabularnewline
10 & 891 & 909.361323848729 & -18.3613238487291 \tabularnewline
11 & 917 & 896.236893513134 & 20.7631064868662 \tabularnewline
12 & 820 & 931.546390550843 & -111.546390550843 \tabularnewline
13 & 793 & 830.920096201182 & -37.9200962011824 \tabularnewline
14 & 932 & 811.809291804281 & 120.190708195719 \tabularnewline
15 & 906 & 1021.65248185768 & -115.652481857679 \tabularnewline
16 & 844 & 1010.87083442573 & -166.870834425734 \tabularnewline
17 & 801 & 917.392039577285 & -116.392039577285 \tabularnewline
18 & 957 & 892.175301079242 & 64.8246989207585 \tabularnewline
19 & 1159 & 1113.32667792485 & 45.6733220751523 \tabularnewline
20 & 1264 & 1378.14901977811 & -114.149019778109 \tabularnewline
21 & 1097 & 1472.24692057395 & -375.246920573946 \tabularnewline
22 & 1240 & 1232.62139144566 & 7.37860855433611 \tabularnewline
23 & 1411 & 1396.98009995642 & 14.0199000435826 \tabularnewline
24 & 1535 & 1658.69815926911 & -123.698159269106 \tabularnewline
25 & 1862 & 1779.89478471589 & 82.1052152841083 \tabularnewline
26 & 1894 & 2136.96319372385 & -242.963193723852 \tabularnewline
27 & 2239 & 2148.87648869636 & 90.1235113036381 \tabularnewline
28 & 2465 & 2488.10457737805 & -23.1045773780508 \tabularnewline
29 & 2423 & 2755.56527487559 & -332.565274875587 \tabularnewline
30 & 2692 & 2622.69869305228 & 69.3013069477208 \tabularnewline
31 & 2856 & 2900.82294496982 & -44.8229449698199 \tabularnewline
32 & 3450 & 3116.64521487117 & 333.354785128833 \tabularnewline
33 & 4162 & 3764.3534525362 & 397.646547463801 \tabularnewline
34 & 4260 & 4568.01068959779 & -308.010689597791 \tabularnewline
35 & 4225 & 4520.10620930751 & -295.106209307508 \tabularnewline
36 & 4092 & 4300.44813704114 & -208.448137041136 \tabularnewline
37 & 4160 & 4133.66444459321 & 26.3355554067921 \tabularnewline
38 & 3896 & 4245.3561351645 & -349.356135164502 \tabularnewline
39 & 3628 & 3981.60550148463 & -353.605501484632 \tabularnewline
40 & 3754 & 3668.93081839367 & 85.0691816063345 \tabularnewline
41 & 3749 & 3915.65004631659 & -166.650046316587 \tabularnewline
42 & 3907 & 3995.32238409986 & -88.3223840998592 \tabularnewline
43 & 4449 & 4166.97978589599 & 282.020214104006 \tabularnewline
44 & 5272 & 4826.8087404123 & 445.191259587702 \tabularnewline
45 & 6197 & 5765.98828147267 & 431.011718527327 \tabularnewline
46 & 6446 & 6714.62681844187 & -268.626818441871 \tabularnewline
47 & 7157 & 6778.48006943715 & 378.519930562854 \tabularnewline
48 & 7559 & 7386.08892065522 & 172.911079344777 \tabularnewline
49 & 7674 & 7793.70422065045 & -119.704220650447 \tabularnewline
50 & 6929 & 7743.90672251792 & -814.90672251792 \tabularnewline
51 & 7156 & 6760.97072320709 & 395.029276792913 \tabularnewline
52 & 6805 & 7040.31263567747 & -235.312635677467 \tabularnewline
53 & 7095 & 6833.14730125834 & 261.85269874166 \tabularnewline
54 & 7222 & 7145.41496157473 & 76.5850384252726 \tabularnewline
55 & 7593 & 7399.86367503353 & 193.136324966466 \tabularnewline
56 & 7910 & 7777.18648790338 & 132.813512096618 \tabularnewline
\hline
\end{tabular}
%Source: https://freestatistics.org/blog/index.php?pk=112172&T=4

[TABLE]
[ROW][C]Multiple Linear Regression - Actuals, Interpolation, and Residuals[/C][/ROW]
[ROW][C]Time or Index[/C][C]Actuals[/C][C]InterpolationForecast[/C][C]ResidualsPrediction Error[/C][/ROW]
[ROW][C]1[/C][C]432[/C][C]299.740944333240[/C][C]132.259055666760[/C][/ROW]
[ROW][C]2[/C][C]517[/C][C]386.617955545198[/C][C]130.382044454802[/C][/ROW]
[ROW][C]3[/C][C]623[/C][C]461.082343070225[/C][C]161.917656929775[/C][/ROW]
[ROW][C]4[/C][C]605[/C][C]577.731191055927[/C][C]27.2688089440734[/C][/ROW]
[ROW][C]5[/C][C]716[/C][C]547.269049319045[/C][C]168.730950680955[/C][/ROW]
[ROW][C]6[/C][C]677[/C][C]668.687726970769[/C][C]8.3122730292308[/C][/ROW]
[ROW][C]7[/C][C]710[/C][C]640.830078609448[/C][C]69.1699213905517[/C][/ROW]
[ROW][C]8[/C][C]839[/C][C]668.551856801484[/C][C]170.448143198516[/C][/ROW]
[ROW][C]9[/C][C]886[/C][C]849.003597532259[/C][C]36.9964024677409[/C][/ROW]
[ROW][C]10[/C][C]891[/C][C]909.361323848729[/C][C]-18.3613238487291[/C][/ROW]
[ROW][C]11[/C][C]917[/C][C]896.236893513134[/C][C]20.7631064868662[/C][/ROW]
[ROW][C]12[/C][C]820[/C][C]931.546390550843[/C][C]-111.546390550843[/C][/ROW]
[ROW][C]13[/C][C]793[/C][C]830.920096201182[/C][C]-37.9200962011824[/C][/ROW]
[ROW][C]14[/C][C]932[/C][C]811.809291804281[/C][C]120.190708195719[/C][/ROW]
[ROW][C]15[/C][C]906[/C][C]1021.65248185768[/C][C]-115.652481857679[/C][/ROW]
[ROW][C]16[/C][C]844[/C][C]1010.87083442573[/C][C]-166.870834425734[/C][/ROW]
[ROW][C]17[/C][C]801[/C][C]917.392039577285[/C][C]-116.392039577285[/C][/ROW]
[ROW][C]18[/C][C]957[/C][C]892.175301079242[/C][C]64.8246989207585[/C][/ROW]
[ROW][C]19[/C][C]1159[/C][C]1113.32667792485[/C][C]45.6733220751523[/C][/ROW]
[ROW][C]20[/C][C]1264[/C][C]1378.14901977811[/C][C]-114.149019778109[/C][/ROW]
[ROW][C]21[/C][C]1097[/C][C]1472.24692057395[/C][C]-375.246920573946[/C][/ROW]
[ROW][C]22[/C][C]1240[/C][C]1232.62139144566[/C][C]7.37860855433611[/C][/ROW]
[ROW][C]23[/C][C]1411[/C][C]1396.98009995642[/C][C]14.0199000435826[/C][/ROW]
[ROW][C]24[/C][C]1535[/C][C]1658.69815926911[/C][C]-123.698159269106[/C][/ROW]
[ROW][C]25[/C][C]1862[/C][C]1779.89478471589[/C][C]82.1052152841083[/C][/ROW]
[ROW][C]26[/C][C]1894[/C][C]2136.96319372385[/C][C]-242.963193723852[/C][/ROW]
[ROW][C]27[/C][C]2239[/C][C]2148.87648869636[/C][C]90.1235113036381[/C][/ROW]
[ROW][C]28[/C][C]2465[/C][C]2488.10457737805[/C][C]-23.1045773780508[/C][/ROW]
[ROW][C]29[/C][C]2423[/C][C]2755.56527487559[/C][C]-332.565274875587[/C][/ROW]
[ROW][C]30[/C][C]2692[/C][C]2622.69869305228[/C][C]69.3013069477208[/C][/ROW]
[ROW][C]31[/C][C]2856[/C][C]2900.82294496982[/C][C]-44.8229449698199[/C][/ROW]
[ROW][C]32[/C][C]3450[/C][C]3116.64521487117[/C][C]333.354785128833[/C][/ROW]
[ROW][C]33[/C][C]4162[/C][C]3764.3534525362[/C][C]397.646547463801[/C][/ROW]
[ROW][C]34[/C][C]4260[/C][C]4568.01068959779[/C][C]-308.010689597791[/C][/ROW]
[ROW][C]35[/C][C]4225[/C][C]4520.10620930751[/C][C]-295.106209307508[/C][/ROW]
[ROW][C]36[/C][C]4092[/C][C]4300.44813704114[/C][C]-208.448137041136[/C][/ROW]
[ROW][C]37[/C][C]4160[/C][C]4133.66444459321[/C][C]26.3355554067921[/C][/ROW]
[ROW][C]38[/C][C]3896[/C][C]4245.3561351645[/C][C]-349.356135164502[/C][/ROW]
[ROW][C]39[/C][C]3628[/C][C]3981.60550148463[/C][C]-353.605501484632[/C][/ROW]
[ROW][C]40[/C][C]3754[/C][C]3668.93081839367[/C][C]85.0691816063345[/C][/ROW]
[ROW][C]41[/C][C]3749[/C][C]3915.65004631659[/C][C]-166.650046316587[/C][/ROW]
[ROW][C]42[/C][C]3907[/C][C]3995.32238409986[/C][C]-88.3223840998592[/C][/ROW]
[ROW][C]43[/C][C]4449[/C][C]4166.97978589599[/C][C]282.020214104006[/C][/ROW]
[ROW][C]44[/C][C]5272[/C][C]4826.8087404123[/C][C]445.191259587702[/C][/ROW]
[ROW][C]45[/C][C]6197[/C][C]5765.98828147267[/C][C]431.011718527327[/C][/ROW]
[ROW][C]46[/C][C]6446[/C][C]6714.62681844187[/C][C]-268.626818441871[/C][/ROW]
[ROW][C]47[/C][C]7157[/C][C]6778.48006943715[/C][C]378.519930562854[/C][/ROW]
[ROW][C]48[/C][C]7559[/C][C]7386.08892065522[/C][C]172.911079344777[/C][/ROW]
[ROW][C]49[/C][C]7674[/C][C]7793.70422065045[/C][C]-119.704220650447[/C][/ROW]
[ROW][C]50[/C][C]6929[/C][C]7743.90672251792[/C][C]-814.90672251792[/C][/ROW]
[ROW][C]51[/C][C]7156[/C][C]6760.97072320709[/C][C]395.029276792913[/C][/ROW]
[ROW][C]52[/C][C]6805[/C][C]7040.31263567747[/C][C]-235.312635677467[/C][/ROW]
[ROW][C]53[/C][C]7095[/C][C]6833.14730125834[/C][C]261.85269874166[/C][/ROW]
[ROW][C]54[/C][C]7222[/C][C]7145.41496157473[/C][C]76.5850384252726[/C][/ROW]
[ROW][C]55[/C][C]7593[/C][C]7399.86367503353[/C][C]193.136324966466[/C][/ROW]
[ROW][C]56[/C][C]7910[/C][C]7777.18648790338[/C][C]132.813512096618[/C][/ROW]
[/TABLE]
Source: https://freestatistics.org/blog/index.php?pk=112172&T=4

Globally Unique Identifier (entire table): ba.freestatistics.org/blog/index.php?pk=112172&T=4

As an alternative you can also use a QR Code:  

The GUIDs for individual cells are displayed in the table below:

Multiple Linear Regression - Actuals, Interpolation, and Residuals
Time or IndexActualsInterpolationForecastResidualsPrediction Error
1432299.740944333240132.259055666760
2517386.617955545198130.382044454802
3623461.082343070225161.917656929775
4605577.73119105592727.2688089440734
5716547.269049319045168.730950680955
6677668.6877269707698.3122730292308
7710640.83007860944869.1699213905517
8839668.551856801484170.448143198516
9886849.00359753225936.9964024677409
10891909.361323848729-18.3613238487291
11917896.23689351313420.7631064868662
12820931.546390550843-111.546390550843
13793830.920096201182-37.9200962011824
14932811.809291804281120.190708195719
159061021.65248185768-115.652481857679
168441010.87083442573-166.870834425734
17801917.392039577285-116.392039577285
18957892.17530107924264.8246989207585
1911591113.3266779248545.6733220751523
2012641378.14901977811-114.149019778109
2110971472.24692057395-375.246920573946
2212401232.621391445667.37860855433611
2314111396.9800999564214.0199000435826
2415351658.69815926911-123.698159269106
2518621779.8947847158982.1052152841083
2618942136.96319372385-242.963193723852
2722392148.8764886963690.1235113036381
2824652488.10457737805-23.1045773780508
2924232755.56527487559-332.565274875587
3026922622.6986930522869.3013069477208
3128562900.82294496982-44.8229449698199
3234503116.64521487117333.354785128833
3341623764.3534525362397.646547463801
3442604568.01068959779-308.010689597791
3542254520.10620930751-295.106209307508
3640924300.44813704114-208.448137041136
3741604133.6644445932126.3355554067921
3838964245.3561351645-349.356135164502
3936283981.60550148463-353.605501484632
4037543668.9308183936785.0691816063345
4137493915.65004631659-166.650046316587
4239073995.32238409986-88.3223840998592
4344494166.97978589599282.020214104006
4452724826.8087404123445.191259587702
4561975765.98828147267431.011718527327
4664466714.62681844187-268.626818441871
4771576778.48006943715378.519930562854
4875597386.08892065522172.911079344777
4976747793.70422065045-119.704220650447
5069297743.90672251792-814.90672251792
5171566760.97072320709395.029276792913
5268057040.31263567747-235.312635677467
5370956833.14730125834261.85269874166
5472227145.4149615747376.5850384252726
5575937399.86367503353193.136324966466
5679107777.18648790338132.813512096618


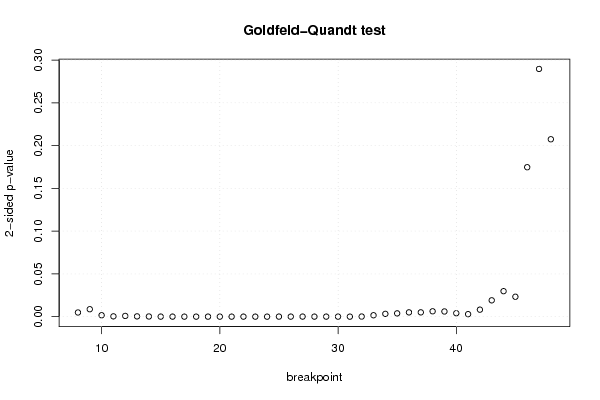
Goldfeld-Quandt test for Heteroskedasticity
p-valuesAlternative Hypothesis
breakpoint indexgreater2-sidedless
80.002441444080590510.004882888161181030.99755855591941
90.004351856090757230.008703712181514460.995648143909243
100.0008220258951269260.001644051790253850.999177974104873
110.0001796335144697940.0003592670289395870.99982036648553
120.0004338452443508140.0008676904887016290.99956615475565
130.0001649573947483260.0003299147894966520.999835042605252
140.0001004369754722710.0002008739509445420.999899563024528
152.60751111216968e-055.21502222433937e-050.999973924888878
166.6663563279681e-061.33327126559362e-050.999993333643672
172.81431003754977e-065.62862007509953e-060.999997185689962
182.38175391977469e-064.76350783954937e-060.99999761824608
196.76932231245958e-061.35386446249192e-050.999993230677688
203.82931962035169e-067.65863924070338e-060.99999617068038
212.52464092740856e-065.04928185481711e-060.999997475359073
224.45892027304082e-068.91784054608164e-060.999995541079727
232.77937273998839e-065.55874547997679e-060.99999722062726
242.38005777129474e-064.76011554258948e-060.999997619942229
253.36362758694953e-056.72725517389905e-050.99996636372413
261.39383714254451e-052.78767428508902e-050.999986061628575
273.82654989000391e-057.65309978000781e-050.9999617345011
281.61559117697971e-053.23118235395942e-050.99998384408823
292.23394061559307e-054.46788123118614e-050.999977660593844
301.31779128579865e-052.63558257159730e-050.999986822087142
314.96696969893799e-069.93393939787597e-060.9999950330303
325.96556319420655e-050.0001193112638841310.999940344368058
330.0008243122338366710.001648624467673340.999175687766163
340.001648036974492910.003296073948985820.998351963025507
350.001923464264453460.003846928528906910.998076535735547
360.002516052434747250.00503210486949450.997483947565253
370.002520034079963410.005040068159926810.997479965920037
380.003132050056095480.006264100112190950.996867949943905
390.003035506183694560.006071012367389130.996964493816305
400.002014605640859600.004029211281719210.99798539435914
410.001469215224179160.002938430448358310.99853078477582
420.004089014122754060.008178028245508130.995910985877246
430.009555813688315170.01911162737663030.990444186311685
440.01489247086860420.02978494173720850.985107529131396
450.01164258233729040.02328516467458070.98835741766271
460.08734853867165860.1746970773433170.912651461328341
470.1447949874371480.2895899748742950.855205012562853
480.1037005343799810.2074010687599610.89629946562002

\begin{tabular}{lllllllll}
\hline
Goldfeld-Quandt test for Heteroskedasticity \tabularnewline
p-values & Alternative Hypothesis \tabularnewline
breakpoint index & greater & 2-sided & less \tabularnewline
8 & 0.00244144408059051 & 0.00488288816118103 & 0.99755855591941 \tabularnewline
9 & 0.00435185609075723 & 0.00870371218151446 & 0.995648143909243 \tabularnewline
10 & 0.000822025895126926 & 0.00164405179025385 & 0.999177974104873 \tabularnewline
11 & 0.000179633514469794 & 0.000359267028939587 & 0.99982036648553 \tabularnewline
12 & 0.000433845244350814 & 0.000867690488701629 & 0.99956615475565 \tabularnewline
13 & 0.000164957394748326 & 0.000329914789496652 & 0.999835042605252 \tabularnewline
14 & 0.000100436975472271 & 0.000200873950944542 & 0.999899563024528 \tabularnewline
15 & 2.60751111216968e-05 & 5.21502222433937e-05 & 0.999973924888878 \tabularnewline
16 & 6.6663563279681e-06 & 1.33327126559362e-05 & 0.999993333643672 \tabularnewline
17 & 2.81431003754977e-06 & 5.62862007509953e-06 & 0.999997185689962 \tabularnewline
18 & 2.38175391977469e-06 & 4.76350783954937e-06 & 0.99999761824608 \tabularnewline
19 & 6.76932231245958e-06 & 1.35386446249192e-05 & 0.999993230677688 \tabularnewline
20 & 3.82931962035169e-06 & 7.65863924070338e-06 & 0.99999617068038 \tabularnewline
21 & 2.52464092740856e-06 & 5.04928185481711e-06 & 0.999997475359073 \tabularnewline
22 & 4.45892027304082e-06 & 8.91784054608164e-06 & 0.999995541079727 \tabularnewline
23 & 2.77937273998839e-06 & 5.55874547997679e-06 & 0.99999722062726 \tabularnewline
24 & 2.38005777129474e-06 & 4.76011554258948e-06 & 0.999997619942229 \tabularnewline
25 & 3.36362758694953e-05 & 6.72725517389905e-05 & 0.99996636372413 \tabularnewline
26 & 1.39383714254451e-05 & 2.78767428508902e-05 & 0.999986061628575 \tabularnewline
27 & 3.82654989000391e-05 & 7.65309978000781e-05 & 0.9999617345011 \tabularnewline
28 & 1.61559117697971e-05 & 3.23118235395942e-05 & 0.99998384408823 \tabularnewline
29 & 2.23394061559307e-05 & 4.46788123118614e-05 & 0.999977660593844 \tabularnewline
30 & 1.31779128579865e-05 & 2.63558257159730e-05 & 0.999986822087142 \tabularnewline
31 & 4.96696969893799e-06 & 9.93393939787597e-06 & 0.9999950330303 \tabularnewline
32 & 5.96556319420655e-05 & 0.000119311263884131 & 0.999940344368058 \tabularnewline
33 & 0.000824312233836671 & 0.00164862446767334 & 0.999175687766163 \tabularnewline
34 & 0.00164803697449291 & 0.00329607394898582 & 0.998351963025507 \tabularnewline
35 & 0.00192346426445346 & 0.00384692852890691 & 0.998076535735547 \tabularnewline
36 & 0.00251605243474725 & 0.0050321048694945 & 0.997483947565253 \tabularnewline
37 & 0.00252003407996341 & 0.00504006815992681 & 0.997479965920037 \tabularnewline
38 & 0.00313205005609548 & 0.00626410011219095 & 0.996867949943905 \tabularnewline
39 & 0.00303550618369456 & 0.00607101236738913 & 0.996964493816305 \tabularnewline
40 & 0.00201460564085960 & 0.00402921128171921 & 0.99798539435914 \tabularnewline
41 & 0.00146921522417916 & 0.00293843044835831 & 0.99853078477582 \tabularnewline
42 & 0.00408901412275406 & 0.00817802824550813 & 0.995910985877246 \tabularnewline
43 & 0.00955581368831517 & 0.0191116273766303 & 0.990444186311685 \tabularnewline
44 & 0.0148924708686042 & 0.0297849417372085 & 0.985107529131396 \tabularnewline
45 & 0.0116425823372904 & 0.0232851646745807 & 0.98835741766271 \tabularnewline
46 & 0.0873485386716586 & 0.174697077343317 & 0.912651461328341 \tabularnewline
47 & 0.144794987437148 & 0.289589974874295 & 0.855205012562853 \tabularnewline
48 & 0.103700534379981 & 0.207401068759961 & 0.89629946562002 \tabularnewline
\hline
\end{tabular}
%Source: https://freestatistics.org/blog/index.php?pk=112172&T=5

[TABLE]
[ROW][C]Goldfeld-Quandt test for Heteroskedasticity[/C][/ROW]
[ROW][C]p-values[/C][C]Alternative Hypothesis[/C][/ROW]
[ROW][C]breakpoint index[/C][C]greater[/C][C]2-sided[/C][C]less[/C][/ROW]
[ROW][C]8[/C][C]0.00244144408059051[/C][C]0.00488288816118103[/C][C]0.99755855591941[/C][/ROW]
[ROW][C]9[/C][C]0.00435185609075723[/C][C]0.00870371218151446[/C][C]0.995648143909243[/C][/ROW]
[ROW][C]10[/C][C]0.000822025895126926[/C][C]0.00164405179025385[/C][C]0.999177974104873[/C][/ROW]
[ROW][C]11[/C][C]0.000179633514469794[/C][C]0.000359267028939587[/C][C]0.99982036648553[/C][/ROW]
[ROW][C]12[/C][C]0.000433845244350814[/C][C]0.000867690488701629[/C][C]0.99956615475565[/C][/ROW]
[ROW][C]13[/C][C]0.000164957394748326[/C][C]0.000329914789496652[/C][C]0.999835042605252[/C][/ROW]
[ROW][C]14[/C][C]0.000100436975472271[/C][C]0.000200873950944542[/C][C]0.999899563024528[/C][/ROW]
[ROW][C]15[/C][C]2.60751111216968e-05[/C][C]5.21502222433937e-05[/C][C]0.999973924888878[/C][/ROW]
[ROW][C]16[/C][C]6.6663563279681e-06[/C][C]1.33327126559362e-05[/C][C]0.999993333643672[/C][/ROW]
[ROW][C]17[/C][C]2.81431003754977e-06[/C][C]5.62862007509953e-06[/C][C]0.999997185689962[/C][/ROW]
[ROW][C]18[/C][C]2.38175391977469e-06[/C][C]4.76350783954937e-06[/C][C]0.99999761824608[/C][/ROW]
[ROW][C]19[/C][C]6.76932231245958e-06[/C][C]1.35386446249192e-05[/C][C]0.999993230677688[/C][/ROW]
[ROW][C]20[/C][C]3.82931962035169e-06[/C][C]7.65863924070338e-06[/C][C]0.99999617068038[/C][/ROW]
[ROW][C]21[/C][C]2.52464092740856e-06[/C][C]5.04928185481711e-06[/C][C]0.999997475359073[/C][/ROW]
[ROW][C]22[/C][C]4.45892027304082e-06[/C][C]8.91784054608164e-06[/C][C]0.999995541079727[/C][/ROW]
[ROW][C]23[/C][C]2.77937273998839e-06[/C][C]5.55874547997679e-06[/C][C]0.99999722062726[/C][/ROW]
[ROW][C]24[/C][C]2.38005777129474e-06[/C][C]4.76011554258948e-06[/C][C]0.999997619942229[/C][/ROW]
[ROW][C]25[/C][C]3.36362758694953e-05[/C][C]6.72725517389905e-05[/C][C]0.99996636372413[/C][/ROW]
[ROW][C]26[/C][C]1.39383714254451e-05[/C][C]2.78767428508902e-05[/C][C]0.999986061628575[/C][/ROW]
[ROW][C]27[/C][C]3.82654989000391e-05[/C][C]7.65309978000781e-05[/C][C]0.9999617345011[/C][/ROW]
[ROW][C]28[/C][C]1.61559117697971e-05[/C][C]3.23118235395942e-05[/C][C]0.99998384408823[/C][/ROW]
[ROW][C]29[/C][C]2.23394061559307e-05[/C][C]4.46788123118614e-05[/C][C]0.999977660593844[/C][/ROW]
[ROW][C]30[/C][C]1.31779128579865e-05[/C][C]2.63558257159730e-05[/C][C]0.999986822087142[/C][/ROW]
[ROW][C]31[/C][C]4.96696969893799e-06[/C][C]9.93393939787597e-06[/C][C]0.9999950330303[/C][/ROW]
[ROW][C]32[/C][C]5.96556319420655e-05[/C][C]0.000119311263884131[/C][C]0.999940344368058[/C][/ROW]
[ROW][C]33[/C][C]0.000824312233836671[/C][C]0.00164862446767334[/C][C]0.999175687766163[/C][/ROW]
[ROW][C]34[/C][C]0.00164803697449291[/C][C]0.00329607394898582[/C][C]0.998351963025507[/C][/ROW]
[ROW][C]35[/C][C]0.00192346426445346[/C][C]0.00384692852890691[/C][C]0.998076535735547[/C][/ROW]
[ROW][C]36[/C][C]0.00251605243474725[/C][C]0.0050321048694945[/C][C]0.997483947565253[/C][/ROW]
[ROW][C]37[/C][C]0.00252003407996341[/C][C]0.00504006815992681[/C][C]0.997479965920037[/C][/ROW]
[ROW][C]38[/C][C]0.00313205005609548[/C][C]0.00626410011219095[/C][C]0.996867949943905[/C][/ROW]
[ROW][C]39[/C][C]0.00303550618369456[/C][C]0.00607101236738913[/C][C]0.996964493816305[/C][/ROW]
[ROW][C]40[/C][C]0.00201460564085960[/C][C]0.00402921128171921[/C][C]0.99798539435914[/C][/ROW]
[ROW][C]41[/C][C]0.00146921522417916[/C][C]0.00293843044835831[/C][C]0.99853078477582[/C][/ROW]
[ROW][C]42[/C][C]0.00408901412275406[/C][C]0.00817802824550813[/C][C]0.995910985877246[/C][/ROW]
[ROW][C]43[/C][C]0.00955581368831517[/C][C]0.0191116273766303[/C][C]0.990444186311685[/C][/ROW]
[ROW][C]44[/C][C]0.0148924708686042[/C][C]0.0297849417372085[/C][C]0.985107529131396[/C][/ROW]
[ROW][C]45[/C][C]0.0116425823372904[/C][C]0.0232851646745807[/C][C]0.98835741766271[/C][/ROW]
[ROW][C]46[/C][C]0.0873485386716586[/C][C]0.174697077343317[/C][C]0.912651461328341[/C][/ROW]
[ROW][C]47[/C][C]0.144794987437148[/C][C]0.289589974874295[/C][C]0.855205012562853[/C][/ROW]
[ROW][C]48[/C][C]0.103700534379981[/C][C]0.207401068759961[/C][C]0.89629946562002[/C][/ROW]
[/TABLE]
Source: https://freestatistics.org/blog/index.php?pk=112172&T=5

Globally Unique Identifier (entire table): ba.freestatistics.org/blog/index.php?pk=112172&T=5

As an alternative you can also use a QR Code:  

The GUIDs for individual cells are displayed in the table below:

Goldfeld-Quandt test for Heteroskedasticity
p-valuesAlternative Hypothesis
breakpoint indexgreater2-sidedless
80.002441444080590510.004882888161181030.99755855591941
90.004351856090757230.008703712181514460.995648143909243
100.0008220258951269260.001644051790253850.999177974104873
110.0001796335144697940.0003592670289395870.99982036648553
120.0004338452443508140.0008676904887016290.99956615475565
130.0001649573947483260.0003299147894966520.999835042605252
140.0001004369754722710.0002008739509445420.999899563024528
152.60751111216968e-055.21502222433937e-050.999973924888878
166.6663563279681e-061.33327126559362e-050.999993333643672
172.81431003754977e-065.62862007509953e-060.999997185689962
182.38175391977469e-064.76350783954937e-060.99999761824608
196.76932231245958e-061.35386446249192e-050.999993230677688
203.82931962035169e-067.65863924070338e-060.99999617068038
212.52464092740856e-065.04928185481711e-060.999997475359073
224.45892027304082e-068.91784054608164e-060.999995541079727
232.77937273998839e-065.55874547997679e-060.99999722062726
242.38005777129474e-064.76011554258948e-060.999997619942229
253.36362758694953e-056.72725517389905e-050.99996636372413
261.39383714254451e-052.78767428508902e-050.999986061628575
273.82654989000391e-057.65309978000781e-050.9999617345011
281.61559117697971e-053.23118235395942e-050.99998384408823
292.23394061559307e-054.46788123118614e-050.999977660593844
301.31779128579865e-052.63558257159730e-050.999986822087142
314.96696969893799e-069.93393939787597e-060.9999950330303
325.96556319420655e-050.0001193112638841310.999940344368058
330.0008243122338366710.001648624467673340.999175687766163
340.001648036974492910.003296073948985820.998351963025507
350.001923464264453460.003846928528906910.998076535735547
360.002516052434747250.00503210486949450.997483947565253
370.002520034079963410.005040068159926810.997479965920037
380.003132050056095480.006264100112190950.996867949943905
390.003035506183694560.006071012367389130.996964493816305
400.002014605640859600.004029211281719210.99798539435914
410.001469215224179160.002938430448358310.99853078477582
420.004089014122754060.008178028245508130.995910985877246
430.009555813688315170.01911162737663030.990444186311685
440.01489247086860420.02978494173720850.985107529131396
450.01164258233729040.02328516467458070.98835741766271
460.08734853867165860.1746970773433170.912651461328341
470.1447949874371480.2895899748742950.855205012562853
480.1037005343799810.2074010687599610.89629946562002


Meta Analysis of Goldfeld-Quandt test for Heteroskedasticity
Description# significant tests% significant testsOK/NOK
1% type I error level350.853658536585366NOK
5% type I error level380.926829268292683NOK
10% type I error level380.926829268292683NOK

\begin{tabular}{lllllllll}
\hline
Meta Analysis of Goldfeld-Quandt test for Heteroskedasticity \tabularnewline
Description & # significant tests & % significant tests & OK/NOK \tabularnewline
1% type I error level & 35 & 0.853658536585366 & NOK \tabularnewline
5% type I error level & 38 & 0.926829268292683 & NOK \tabularnewline
10% type I error level & 38 & 0.926829268292683 & NOK \tabularnewline
\hline
\end{tabular}
%Source: https://freestatistics.org/blog/index.php?pk=112172&T=6

[TABLE]
[ROW][C]Meta Analysis of Goldfeld-Quandt test for Heteroskedasticity[/C][/ROW]
[ROW][C]Description[/C][C]# significant tests[/C][C]% significant tests[/C][C]OK/NOK[/C][/ROW]
[ROW][C]1% type I error level[/C][C]35[/C][C]0.853658536585366[/C][C]NOK[/C][/ROW]
[ROW][C]5% type I error level[/C][C]38[/C][C]0.926829268292683[/C][C]NOK[/C][/ROW]
[ROW][C]10% type I error level[/C][C]38[/C][C]0.926829268292683[/C][C]NOK[/C][/ROW]
[/TABLE]
Source: https://freestatistics.org/blog/index.php?pk=112172&T=6

Globally Unique Identifier (entire table): ba.freestatistics.org/blog/index.php?pk=112172&T=6

As an alternative you can also use a QR Code:  

The GUIDs for individual cells are displayed in the table below:

Meta Analysis of Goldfeld-Quandt test for Heteroskedasticity
Description# significant tests% significant testsOK/NOK
1% type I error level350.853658536585366NOK
5% type I error level380.926829268292683NOK
10% type I error level380.926829268292683NOK


Parameters (Session):
par1 = 1 ; par2 = 0 ; par3 = 0 ; par4 = 1 ;
Parameters (R input):
par1 = 1 ; par2 = Do not include Seasonal Dummies ; par3 = Linear Trend ;
R code (references can be found in the software module):
library(lattice)
library(lmtest)
n25 <- 25 #minimum number of obs. for Goldfeld-Quandt test
par1 <- as.numeric(par1)
x <- t(y)
k <- length(x[1,])
n <- length(x[,1])
x1 <- cbind(x[,par1], x[,1:k!=par1])
mycolnames <- c(colnames(x)[par1], colnames(x)[1:k!=par1])
colnames(x1) <- mycolnames #colnames(x)[par1]
x <- x1
if (par3 == 'First Differences'){
x2 <- array(0, dim=c(n-1,k), dimnames=list(1:(n-1), paste('(1-B)',colnames(x),sep='')))
for (i in 1:n-1) {
for (j in 1:k) {
x2[i,j] <- x[i+1,j] - x[i,j]
}
}
x <- x2
}
if (par2 == 'Include Monthly Dummies'){
x2 <- array(0, dim=c(n,11), dimnames=list(1:n, paste('M', seq(1:11), sep ='')))
for (i in 1:11){
x2[seq(i,n,12),i] <- 1
}
x <- cbind(x, x2)
}
if (par2 == 'Include Quarterly Dummies'){
x2 <- array(0, dim=c(n,3), dimnames=list(1:n, paste('Q', seq(1:3), sep ='')))
for (i in 1:3){
x2[seq(i,n,4),i] <- 1
}
x <- cbind(x, x2)
}
k <- length(x[1,])
if (par3 == 'Linear Trend'){
x <- cbind(x, c(1:n))
colnames(x)[k+1] <- 't'
}
x
k <- length(x[1,])
df <- as.data.frame(x)
(mylm <- lm(df))
(mysum <- summary(mylm))
if (n > n25) {
kp3 <- k + 3
nmkm3 <- n - k - 3
gqarr <- array(NA, dim=c(nmkm3-kp3+1,3))
numgqtests <- 0
numsignificant1 <- 0
numsignificant5 <- 0
numsignificant10 <- 0
for (mypoint in kp3:nmkm3) {
j <- 0
numgqtests <- numgqtests + 1
for (myalt in c('greater', 'two.sided', 'less')) {
j <- j + 1
gqarr[mypoint-kp3+1,j] <- gqtest(mylm, point=mypoint, alternative=myalt)$p.value
}
if (gqarr[mypoint-kp3+1,2] < 0.01) numsignificant1 <- numsignificant1 + 1
if (gqarr[mypoint-kp3+1,2] < 0.05) numsignificant5 <- numsignificant5 + 1
if (gqarr[mypoint-kp3+1,2] < 0.10) numsignificant10 <- numsignificant10 + 1
}
gqarr
}
bitmap(file='test0.png')
plot(x[,1], type='l', main='Actuals and Interpolation', ylab='value of Actuals and Interpolation (dots)', xlab='time or index')
points(x[,1]-mysum$resid)
grid()
dev.off()
bitmap(file='test1.png')
plot(mysum$resid, type='b', pch=19, main='Residuals', ylab='value of Residuals', xlab='time or index')
grid()
dev.off()
bitmap(file='test2.png')
hist(mysum$resid, main='Residual Histogram', xlab='values of Residuals')
grid()
dev.off()
bitmap(file='test3.png')
densityplot(~mysum$resid,col='black',main='Residual Density Plot', xlab='values of Residuals')
dev.off()
bitmap(file='test4.png')
qqnorm(mysum$resid, main='Residual Normal Q-Q Plot')
qqline(mysum$resid)
grid()
dev.off()
(myerror <- as.ts(mysum$resid))
bitmap(file='test5.png')
dum <- cbind(lag(myerror,k=1),myerror)
dum
dum1 <- dum[2:length(myerror),]
dum1
z <- as.data.frame(dum1)
z
plot(z,main=paste('Residual Lag plot, lowess, and regression line'), ylab='values of Residuals', xlab='lagged values of Residuals')
lines(lowess(z))
abline(lm(z))
grid()
dev.off()
bitmap(file='test6.png')
acf(mysum$resid, lag.max=length(mysum$resid)/2, main='Residual Autocorrelation Function')
grid()
dev.off()
bitmap(file='test7.png')
pacf(mysum$resid, lag.max=length(mysum$resid)/2, main='Residual Partial Autocorrelation Function')
grid()
dev.off()
bitmap(file='test8.png')
opar <- par(mfrow = c(2,2), oma = c(0, 0, 1.1, 0))
plot(mylm, las = 1, sub='Residual Diagnostics')
par(opar)
dev.off()
if (n > n25) {
bitmap(file='test9.png')
plot(kp3:nmkm3,gqarr[,2], main='Goldfeld-Quandt test',ylab='2-sided p-value',xlab='breakpoint')
grid()
dev.off()
}
load(file='createtable')
a<-table.start()
a<-table.row.start(a)
a<-table.element(a, 'Multiple Linear Regression - Estimated Regression Equation', 1, TRUE)
a<-table.row.end(a)
myeq <- colnames(x)[1]
myeq <- paste(myeq, '[t] = ', sep='')
for (i in 1:k){
if (mysum$coefficients[i,1] > 0) myeq <- paste(myeq, '+', '')
myeq <- paste(myeq, mysum$coefficients[i,1], sep=' ')
if (rownames(mysum$coefficients)[i] != '(Intercept)') {
myeq <- paste(myeq, rownames(mysum$coefficients)[i], sep='')
if (rownames(mysum$coefficients)[i] != 't') myeq <- paste(myeq, '[t]', sep='')
}
}
myeq <- paste(myeq, ' + e[t]')
a<-table.row.start(a)
a<-table.element(a, myeq)
a<-table.row.end(a)
a<-table.end(a)
table.save(a,file='mytable1.tab')
a<-table.start()
a<-table.row.start(a)
a<-table.element(a,hyperlink('ols1.htm','Multiple Linear Regression - Ordinary Least Squares',''), 6, TRUE)
a<-table.row.end(a)
a<-table.row.start(a)
a<-table.element(a,'Variable',header=TRUE)
a<-table.element(a,'Parameter',header=TRUE)
a<-table.element(a,'S.D.',header=TRUE)
a<-table.element(a,'T-STAT
H0: parameter = 0',header=TRUE)
a<-table.element(a,'2-tail p-value',header=TRUE)
a<-table.element(a,'1-tail p-value',header=TRUE)
a<-table.row.end(a)
for (i in 1:k){
a<-table.row.start(a)
a<-table.element(a,rownames(mysum$coefficients)[i],header=TRUE)
a<-table.element(a,mysum$coefficients[i,1])
a<-table.element(a, round(mysum$coefficients[i,2],6))
a<-table.element(a, round(mysum$coefficients[i,3],4))
a<-table.element(a, round(mysum$coefficients[i,4],6))
a<-table.element(a, round(mysum$coefficients[i,4]/2,6))
a<-table.row.end(a)
}
a<-table.end(a)
table.save(a,file='mytable2.tab')
a<-table.start()
a<-table.row.start(a)
a<-table.element(a, 'Multiple Linear Regression - Regression Statistics', 2, TRUE)
a<-table.row.end(a)
a<-table.row.start(a)
a<-table.element(a, 'Multiple R',1,TRUE)
a<-table.element(a, sqrt(mysum$r.squared))
a<-table.row.end(a)
a<-table.row.start(a)
a<-table.element(a, 'R-squared',1,TRUE)
a<-table.element(a, mysum$r.squared)
a<-table.row.end(a)
a<-table.row.start(a)
a<-table.element(a, 'Adjusted R-squared',1,TRUE)
a<-table.element(a, mysum$adj.r.squared)
a<-table.row.end(a)
a<-table.row.start(a)
a<-table.element(a, 'F-TEST (value)',1,TRUE)
a<-table.element(a, mysum$fstatistic[1])
a<-table.row.end(a)
a<-table.row.start(a)
a<-table.element(a, 'F-TEST (DF numerator)',1,TRUE)
a<-table.element(a, mysum$fstatistic[2])
a<-table.row.end(a)
a<-table.row.start(a)
a<-table.element(a, 'F-TEST (DF denominator)',1,TRUE)
a<-table.element(a, mysum$fstatistic[3])
a<-table.row.end(a)
a<-table.row.start(a)
a<-table.element(a, 'p-value',1,TRUE)
a<-table.element(a, 1-pf(mysum$fstatistic[1],mysum$fstatistic[2],mysum$fstatistic[3]))
a<-table.row.end(a)
a<-table.row.start(a)
a<-table.element(a, 'Multiple Linear Regression - Residual Statistics', 2, TRUE)
a<-table.row.end(a)
a<-table.row.start(a)
a<-table.element(a, 'Residual Standard Deviation',1,TRUE)
a<-table.element(a, mysum$sigma)
a<-table.row.end(a)
a<-table.row.start(a)
a<-table.element(a, 'Sum Squared Residuals',1,TRUE)
a<-table.element(a, sum(myerror*myerror))
a<-table.row.end(a)
a<-table.end(a)
table.save(a,file='mytable3.tab')
a<-table.start()
a<-table.row.start(a)
a<-table.element(a, 'Multiple Linear Regression - Actuals, Interpolation, and Residuals', 4, TRUE)
a<-table.row.end(a)
a<-table.row.start(a)
a<-table.element(a, 'Time or Index', 1, TRUE)
a<-table.element(a, 'Actuals', 1, TRUE)
a<-table.element(a, 'Interpolation
Forecast', 1, TRUE)
a<-table.element(a, 'Residuals
Prediction Error', 1, TRUE)
a<-table.row.end(a)
for (i in 1:n) {
a<-table.row.start(a)
a<-table.element(a,i, 1, TRUE)
a<-table.element(a,x[i])
a<-table.element(a,x[i]-mysum$resid[i])
a<-table.element(a,mysum$resid[i])
a<-table.row.end(a)
}
a<-table.end(a)
table.save(a,file='mytable4.tab')
if (n > n25) {
a<-table.start()
a<-table.row.start(a)
a<-table.element(a,'Goldfeld-Quandt test for Heteroskedasticity',4,TRUE)
a<-table.row.end(a)
a<-table.row.start(a)
a<-table.element(a,'p-values',header=TRUE)
a<-table.element(a,'Alternative Hypothesis',3,header=TRUE)
a<-table.row.end(a)
a<-table.row.start(a)
a<-table.element(a,'breakpoint index',header=TRUE)
a<-table.element(a,'greater',header=TRUE)
a<-table.element(a,'2-sided',header=TRUE)
a<-table.element(a,'less',header=TRUE)
a<-table.row.end(a)
for (mypoint in kp3:nmkm3) {
a<-table.row.start(a)
a<-table.element(a,mypoint,header=TRUE)
a<-table.element(a,gqarr[mypoint-kp3+1,1])
a<-table.element(a,gqarr[mypoint-kp3+1,2])
a<-table.element(a,gqarr[mypoint-kp3+1,3])
a<-table.row.end(a)
}
a<-table.end(a)
table.save(a,file='mytable5.tab')
a<-table.start()
a<-table.row.start(a)
a<-table.element(a,'Meta Analysis of Goldfeld-Quandt test for Heteroskedasticity',4,TRUE)
a<-table.row.end(a)
a<-table.row.start(a)
a<-table.element(a,'Description',header=TRUE)
a<-table.element(a,'# significant tests',header=TRUE)
a<-table.element(a,'% significant tests',header=TRUE)
a<-table.element(a,'OK/NOK',header=TRUE)
a<-table.row.end(a)
a<-table.row.start(a)
a<-table.element(a,'1% type I error level',header=TRUE)
a<-table.element(a,numsignificant1)
a<-table.element(a,numsignificant1/numgqtests)
if (numsignificant1/numgqtests < 0.01) dum <- 'OK' else dum <- 'NOK'
a<-table.element(a,dum)
a<-table.row.end(a)
a<-table.row.start(a)
a<-table.element(a,'5% type I error level',header=TRUE)
a<-table.element(a,numsignificant5)
a<-table.element(a,numsignificant5/numgqtests)
if (numsignificant5/numgqtests < 0.05) dum <- 'OK' else dum <- 'NOK'
a<-table.element(a,dum)
a<-table.row.end(a)
a<-table.row.start(a)
a<-table.element(a,'10% type I error level',header=TRUE)
a<-table.element(a,numsignificant10)
a<-table.element(a,numsignificant10/numgqtests)
if (numsignificant10/numgqtests < 0.1) dum <- 'OK' else dum <- 'NOK'
a<-table.element(a,dum)
a<-table.row.end(a)
a<-table.end(a)
table.save(a,file='mytable6.tab')
}