Free Statistics

of Irreproducible Research!

Author's title

Author*The author of this computation has been verified*
R Software Modulerwasp_regression_trees1.wasp
Title produced by softwareRecursive Partitioning (Regression Trees)
Date of computationSat, 18 Dec 2010 19:24:23 +0000
Cite this page as followsStatistical Computations at FreeStatistics.org, Office for Research Development and Education, URL https://freestatistics.org/blog/index.php?v=date/2010/Dec/18/t12927002600d4h2hqpk0qx540.htm/, Retrieved Tue, 30 Apr 2024 05:00:53 +0000
Statistical Computations at FreeStatistics.org, Office for Research Development and Education, URL https://freestatistics.org/blog/index.php?pk=112167, Retrieved Tue, 30 Apr 2024 05:00:53 +0000
QR Codes:

Original text written by user:
IsPrivate?No (this computation is public)
User-defined keywords
Estimated Impact115
Family? (F = Feedback message, R = changed R code, M = changed R Module, P = changed Parameters, D = changed Data)
-     [Recursive Partitioning (Regression Trees)] [] [2010-12-05 19:35:21] [b98453cac15ba1066b407e146608df68]
-   PD    [Recursive Partitioning (Regression Trees)] [Confussion matrix...] [2010-12-18 19:24:23] [3f56c8f677e988de577e4e00a8180a48] [Current]
Feedback Forum

Post a new message
Dataseries X:
3111	5140	17153	2.5	766	332	2.4
3995	4749	15579	1.8	294	369	2.4
5245	3635	16755	7.3	235	384	2.4
5588	4305	16585	9.9	462	373	2.1
10681	5805	16572	13.2	919	378	2
10516	4260	16325	17.8	346	426	2
7496	3869	17913	18.8	298	423	2.1
9935	7325	17572	19.3	92	397	2.1
10249	9280	17338	13.9	516	422	2
6271	6222	17087	7.5	843	409	2
3616	3272	15864	8	395	430	2
3724	7598	15554	4	961	412	1.7
2886	1345	16229	3.6	1231	470	1.3
3318	1900	15180	4.8	794	491	1.2
4166	1480	16215	5.9	420	504	1.1
6401	1472	15801	10.4	331	484	1.4
9209	3823	15751	12.3	312	474	1.5
9820	4454	16477	15.5	692	508	1.4
7470	3357	17324	16.7	1221	492	1.1
8207	5393	16919	18.8	1272	452	1.1
9564	8329	16438	15.2	622	457	1
5309	4152	16239	11.3	479	457	1.4
3385	4042	15613	6.3	757	471	1.3
3706	7747	15821	3.2	463	451	1.2
2733	1451	15678	5.3	534	493	1.5
3045	911	14671	2.4	731	514	1.6
3449	406	15876	6.5	498	522	1.8
5542	1387	15563	10.4	629	490	1.5
10072	2150	15711	12.6	542	484	1.3
9418	1577	15583	16.8	519	506	1.6
7516	2642	16405	17.7	1585	501	1.6
7840	4273	16701	16.2	956	462	1.8
10081	8064	16194	15.7	633	465	1.8
4956	3243	16024	13.3	561	454	1.6
3641	1112	14728	6.9	976	464	1.8
3970	2280	14776	4	565	427	2
2931	505	15399	1.5	151	460	1.3
3170	744	14286	2.9	588	473	1.1
3889	1369	15646	3.9	1043	465	1
4850	531	14543	9	398	422	1.2
8037	1041	15673	14.5	902	415	1.2
12370	2076	15171	16.7	180	413	1.3
6712	577	15999	22.3	150	420	1.3
7297	5080	1626	16.4	1805	363	1.4
10613	6584	16123	17.9	86	376	1.1
5184	3761	16144	13.6	1093	380	0.9
3506	294	15005	9.2	925	384	1
3810	5020	14806	6.5	750	346	1.1
2692	1141	15019	7.1	1038	389	1.4
3073	3805	13909	6	679	407	1.5
3713	2127	15211	8	848	393	1.8
4555	2531	14385	13.1	300	346	1.8
7807	3682	15144	14.1	1379	348	1.8
10869	3263	14659	17.5	901	353	1.7
9682	2798	15989	17	1606	364	1.5
7704	5936	16262	17.1	422	305	1.1
9826	10568	16021	13.8	968	307	1.3
5456	5296	15662	10.1	319	312	1.6
3677	1870	14531	6.9	583	312	1.9
3431	4390	14544	2.4	765	286	1.9
2765	3707	15071	6.5	963	324	2
3483	5201	14236	5.1	392	336	2.2
3445	3748	14771	5.9	919	327	2.2
6081	5282	14804	8.9	339	302	2
8767	5349	15597	15.7	327	299	2.3
9407	6249	15418	16.5	397	311	2.6
6551	5517	16903	18.1	1268	315	3.2
12480	8640	16350	17.4	1137	264	3.2
9530	15767	16393	13.6	1000	278	3.1
5960	8850	15685	10.1	915	278	2.8
3252	5582	14556	6.9	905	287	2.3
3717	6496	14850	2.4	243	279	1.9
2642	3255	15391	0.8	537	324	1.9
2989	6189	13704	3.3	551	354	2
3607	6452	15409	6.3	482	354	2
5366	5099	15098	12.2	199	360	1.8
8898	6833	15254	13.9	650	363	1.6
9435	7046	15522	15.6	533	385	1.4
7328	7739	16669	18.1	1071	412	0.2
8594	10142	16238	18.5	469	370	0.3
11349	16054	16246	15	335	389	0.4
5797	7721	15424	10.7	598	395	0.7
3621	6182	14952	9.5	1200	417	1
3851	6490	15008	2.2	844	404	1.1


Summary of computational transaction
Raw Inputview raw input (R code)
Raw Outputview raw output of R engine
Computing time3 seconds
R Server'RServer@AstonUniversity' @ vre.aston.ac.uk

\begin{tabular}{lllllllll}
\hline
Summary of computational transaction \tabularnewline
Raw Input & view raw input (R code)  \tabularnewline
Raw Output & view raw output of R engine  \tabularnewline
Computing time & 3 seconds \tabularnewline
R Server & 'RServer@AstonUniversity' @ vre.aston.ac.uk \tabularnewline
\hline
\end{tabular}
%Source: https://freestatistics.org/blog/index.php?pk=112167&T=0

[TABLE]
[ROW][C]Summary of computational transaction[/C][/ROW]
[ROW][C]Raw Input[/C][C]view raw input (R code) [/C][/ROW]
[ROW][C]Raw Output[/C][C]view raw output of R engine [/C][/ROW]
[ROW][C]Computing time[/C][C]3 seconds[/C][/ROW]
[ROW][C]R Server[/C][C]'RServer@AstonUniversity' @ vre.aston.ac.uk[/C][/ROW]
[/TABLE]
Source: https://freestatistics.org/blog/index.php?pk=112167&T=0

Globally Unique Identifier (entire table): ba.freestatistics.org/blog/index.php?pk=112167&T=0

As an alternative you can also use a QR Code:  

The GUIDs for individual cells are displayed in the table below:

Summary of computational transaction
Raw Inputview raw input (R code)
Raw Outputview raw output of R engine
Computing time3 seconds
R Server'RServer@AstonUniversity' @ vre.aston.ac.uk


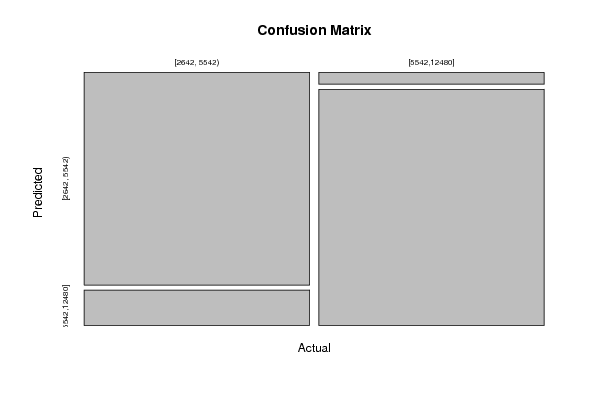
Confusion Matrix (predicted in columns / actuals in rows)
C1C2
C1366
C2240

\begin{tabular}{lllllllll}
\hline
Confusion Matrix (predicted in columns / actuals in rows) \tabularnewline
 & C1 & C2 \tabularnewline
C1 & 36 & 6 \tabularnewline
C2 & 2 & 40 \tabularnewline
\hline
\end{tabular}
%Source: https://freestatistics.org/blog/index.php?pk=112167&T=1

[TABLE]
[ROW][C]Confusion Matrix (predicted in columns / actuals in rows)[/C][/ROW]
[ROW][C][/C][C]C1[/C][C]C2[/C][/ROW]
[ROW][C]C1[/C][C]36[/C][C]6[/C][/ROW]
[ROW][C]C2[/C][C]2[/C][C]40[/C][/ROW]
[/TABLE]
Source: https://freestatistics.org/blog/index.php?pk=112167&T=1

Globally Unique Identifier (entire table): ba.freestatistics.org/blog/index.php?pk=112167&T=1

As an alternative you can also use a QR Code:  

The GUIDs for individual cells are displayed in the table below:

Confusion Matrix (predicted in columns / actuals in rows)
C1C2
C1366
C2240


Parameters (Session):
par1 = 1 ; par2 = none ; par3 = 2 ; par4 = no ;
Parameters (R input):
par1 = 1 ; par2 = quantiles ; par3 = 2 ; par4 = no ;
R code (references can be found in the software module):
library(party)
library(Hmisc)
par1 <- as.numeric(par1)
par3 <- as.numeric(par3)
x <- data.frame(t(y))
is.data.frame(x)
x <- x[!is.na(x[,par1]),]
k <- length(x[1,])
n <- length(x[,1])
colnames(x)[par1]
x[,par1]
if (par2 == 'kmeans') {
cl <- kmeans(x[,par1], par3)
print(cl)
clm <- matrix(cbind(cl$centers,1:par3),ncol=2)
clm <- clm[sort.list(clm[,1]),]
for (i in 1:par3) {
cl$cluster[cl$cluster==clm[i,2]] <- paste('C',i,sep='')
}
cl$cluster <- as.factor(cl$cluster)
print(cl$cluster)
x[,par1] <- cl$cluster
}
if (par2 == 'quantiles') {
x[,par1] <- cut2(x[,par1],g=par3)
}
if (par2 == 'hclust') {
hc <- hclust(dist(x[,par1])^2, 'cen')
print(hc)
memb <- cutree(hc, k = par3)
dum <- c(mean(x[memb==1,par1]))
for (i in 2:par3) {
dum <- c(dum, mean(x[memb==i,par1]))
}
hcm <- matrix(cbind(dum,1:par3),ncol=2)
hcm <- hcm[sort.list(hcm[,1]),]
for (i in 1:par3) {
memb[memb==hcm[i,2]] <- paste('C',i,sep='')
}
memb <- as.factor(memb)
print(memb)
x[,par1] <- memb
}
if (par2=='equal') {
ed <- cut(as.numeric(x[,par1]),par3,labels=paste('C',1:par3,sep=''))
x[,par1] <- as.factor(ed)
}
table(x[,par1])
colnames(x)
colnames(x)[par1]
x[,par1]
if (par2 == 'none') {
m <- ctree(as.formula(paste(colnames(x)[par1],' ~ .',sep='')),data = x)
}
load(file='createtable')
if (par2 != 'none') {
m <- ctree(as.formula(paste('as.factor(',colnames(x)[par1],') ~ .',sep='')),data = x)
if (par4=='yes') {
a<-table.start()
a<-table.row.start(a)
a<-table.element(a,'10-Fold Cross Validation',3+2*par3,TRUE)
a<-table.row.end(a)
a<-table.row.start(a)
a<-table.element(a,'',1,TRUE)
a<-table.element(a,'Prediction (training)',par3+1,TRUE)
a<-table.element(a,'Prediction (testing)',par3+1,TRUE)
a<-table.row.end(a)
a<-table.row.start(a)
a<-table.element(a,'Actual',1,TRUE)
for (jjj in 1:par3) a<-table.element(a,paste('C',jjj,sep=''),1,TRUE)
a<-table.element(a,'CV',1,TRUE)
for (jjj in 1:par3) a<-table.element(a,paste('C',jjj,sep=''),1,TRUE)
a<-table.element(a,'CV',1,TRUE)
a<-table.row.end(a)
for (i in 1:10) {
ind <- sample(2, nrow(x), replace=T, prob=c(0.9,0.1))
m.ct <- ctree(as.formula(paste('as.factor(',colnames(x)[par1],') ~ .',sep='')),data =x[ind==1,])
if (i==1) {
m.ct.i.pred <- predict(m.ct, newdata=x[ind==1,])
m.ct.i.actu <- x[ind==1,par1]
m.ct.x.pred <- predict(m.ct, newdata=x[ind==2,])
m.ct.x.actu <- x[ind==2,par1]
} else {
m.ct.i.pred <- c(m.ct.i.pred,predict(m.ct, newdata=x[ind==1,]))
m.ct.i.actu <- c(m.ct.i.actu,x[ind==1,par1])
m.ct.x.pred <- c(m.ct.x.pred,predict(m.ct, newdata=x[ind==2,]))
m.ct.x.actu <- c(m.ct.x.actu,x[ind==2,par1])
}
}
print(m.ct.i.tab <- table(m.ct.i.actu,m.ct.i.pred))
numer <- 0
for (i in 1:par3) {
print(m.ct.i.tab[i,i] / sum(m.ct.i.tab[i,]))
numer <- numer + m.ct.i.tab[i,i]
}
print(m.ct.i.cp <- numer / sum(m.ct.i.tab))
print(m.ct.x.tab <- table(m.ct.x.actu,m.ct.x.pred))
numer <- 0
for (i in 1:par3) {
print(m.ct.x.tab[i,i] / sum(m.ct.x.tab[i,]))
numer <- numer + m.ct.x.tab[i,i]
}
print(m.ct.x.cp <- numer / sum(m.ct.x.tab))
for (i in 1:par3) {
a<-table.row.start(a)
a<-table.element(a,paste('C',i,sep=''),1,TRUE)
for (jjj in 1:par3) a<-table.element(a,m.ct.i.tab[i,jjj])
a<-table.element(a,round(m.ct.i.tab[i,i]/sum(m.ct.i.tab[i,]),4))
for (jjj in 1:par3) a<-table.element(a,m.ct.x.tab[i,jjj])
a<-table.element(a,round(m.ct.x.tab[i,i]/sum(m.ct.x.tab[i,]),4))
a<-table.row.end(a)
}
a<-table.row.start(a)
a<-table.element(a,'Overall',1,TRUE)
for (jjj in 1:par3) a<-table.element(a,'-')
a<-table.element(a,round(m.ct.i.cp,4))
for (jjj in 1:par3) a<-table.element(a,'-')
a<-table.element(a,round(m.ct.x.cp,4))
a<-table.row.end(a)
a<-table.end(a)
table.save(a,file='mytable3.tab')
}
}
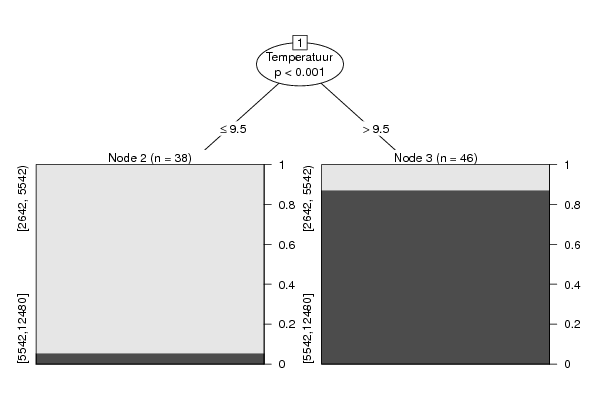
m
bitmap(file='test1.png')
plot(m)
dev.off()
bitmap(file='test1a.png')
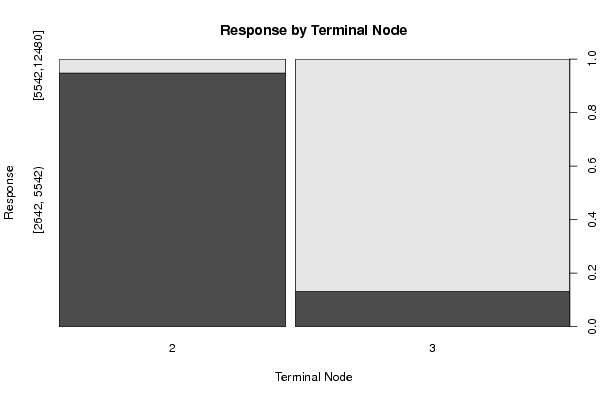
plot(x[,par1] ~ as.factor(where(m)),main='Response by Terminal Node',xlab='Terminal Node',ylab='Response')
dev.off()
if (par2 == 'none') {
forec <- predict(m)
result <- as.data.frame(cbind(x[,par1],forec,x[,par1]-forec))
colnames(result) <- c('Actuals','Forecasts','Residuals')
print(result)
}
if (par2 != 'none') {
print(cbind(as.factor(x[,par1]),predict(m)))
myt <- table(as.factor(x[,par1]),predict(m))
print(myt)
}
bitmap(file='test2.png')
if(par2=='none') {
op <- par(mfrow=c(2,2))
plot(density(result$Actuals),main='Kernel Density Plot of Actuals')
plot(density(result$Residuals),main='Kernel Density Plot of Residuals')
plot(result$Forecasts,result$Actuals,main='Actuals versus Predictions',xlab='Predictions',ylab='Actuals')
plot(density(result$Forecasts),main='Kernel Density Plot of Predictions')
par(op)
}
if(par2!='none') {
plot(myt,main='Confusion Matrix',xlab='Actual',ylab='Predicted')
}
dev.off()
if (par2 == 'none') {
detcoef <- cor(result$Forecasts,result$Actuals)
a<-table.start()
a<-table.row.start(a)
a<-table.element(a,'Goodness of Fit',2,TRUE)
a<-table.row.end(a)
a<-table.row.start(a)
a<-table.element(a,'Correlation',1,TRUE)
a<-table.element(a,round(detcoef,4))
a<-table.row.end(a)
a<-table.row.start(a)
a<-table.element(a,'R-squared',1,TRUE)
a<-table.element(a,round(detcoef*detcoef,4))
a<-table.row.end(a)
a<-table.row.start(a)
a<-table.element(a,'RMSE',1,TRUE)
a<-table.element(a,round(sqrt(mean((result$Residuals)^2)),4))
a<-table.row.end(a)
a<-table.end(a)
table.save(a,file='mytable1.tab')
a<-table.start()
a<-table.row.start(a)
a<-table.element(a,'Actuals, Predictions, and Residuals',4,TRUE)
a<-table.row.end(a)
a<-table.row.start(a)
a<-table.element(a,'#',header=TRUE)
a<-table.element(a,'Actuals',header=TRUE)
a<-table.element(a,'Forecasts',header=TRUE)
a<-table.element(a,'Residuals',header=TRUE)
a<-table.row.end(a)
for (i in 1:length(result$Actuals)) {
a<-table.row.start(a)
a<-table.element(a,i,header=TRUE)
a<-table.element(a,result$Actuals[i])
a<-table.element(a,result$Forecasts[i])
a<-table.element(a,result$Residuals[i])
a<-table.row.end(a)
}
a<-table.end(a)
table.save(a,file='mytable.tab')
}
if (par2 != 'none') {
a<-table.start()
a<-table.row.start(a)
a<-table.element(a,'Confusion Matrix (predicted in columns / actuals in rows)',par3+1,TRUE)
a<-table.row.end(a)
a<-table.row.start(a)
a<-table.element(a,'',1,TRUE)
for (i in 1:par3) {
a<-table.element(a,paste('C',i,sep=''),1,TRUE)
}
a<-table.row.end(a)
for (i in 1:par3) {
a<-table.row.start(a)
a<-table.element(a,paste('C',i,sep=''),1,TRUE)
for (j in 1:par3) {
a<-table.element(a,myt[i,j])
}
a<-table.row.end(a)
}
a<-table.end(a)
table.save(a,file='mytable2.tab')
}