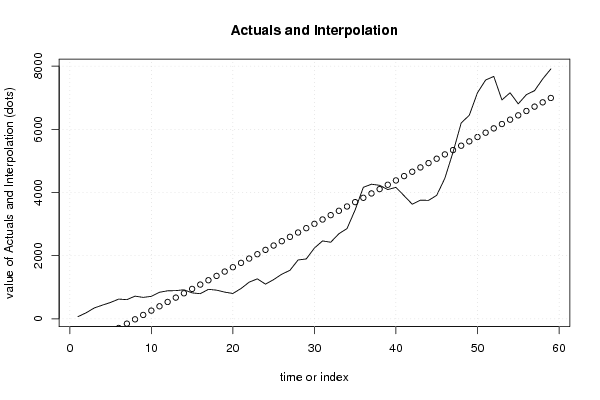
| Multiple Linear Regression - Estimated Regression Equation |
| Faillissementen[t] = -1116.53126826417 + 137.414319111631t + e[t] |
| Multiple Linear Regression - Ordinary Least Squares | |||||
| Variable | Parameter | S.D. | T-STAT H0: parameter = 0 | 2-tail p-value | 1-tail p-value |
| (Intercept) | -1116.53126826417 | 216.919568 | -5.1472 | 3e-06 | 2e-06 |
| t | 137.414319111631 | 6.288184 | 21.8528 | 0 | 0 |
| Multiple Linear Regression - Regression Statistics | |
| Multiple R | 0.94518097525683 |
| R-squared | 0.89336707598745 |
| Adjusted R-squared | 0.891496322934599 |
| F-TEST (value) | 477.544096280167 |
| F-TEST (DF numerator) | 1 |
| F-TEST (DF denominator) | 57 |
| p-value | 0 |
| Multiple Linear Regression - Residual Statistics | |
| Residual Standard Deviation | 822.527174207404 |
| Sum Squared Residuals | 38563404.2816482 |
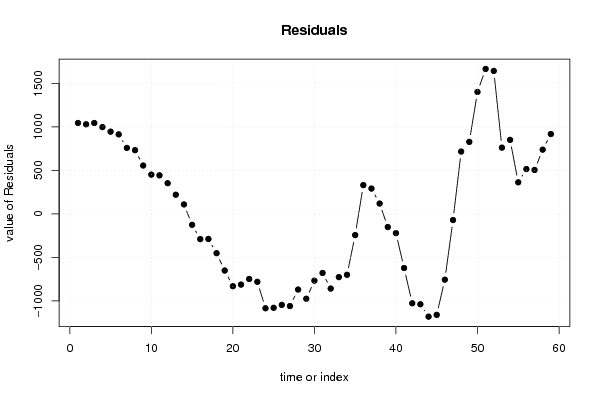
| Multiple Linear Regression - Actuals, Interpolation, and Residuals | |||
| Time or Index | Actuals | Interpolation Forecast | Residuals Prediction Error |
| 1 | 67 | -979.116949152542 | 1046.11694915254 |
| 2 | 189 | -841.702630040915 | 1030.70263004091 |
| 3 | 342 | -704.288310929281 | 1046.28831092928 |
| 4 | 432 | -566.87399181765 | 998.87399181765 |
| 5 | 517 | -429.45967270602 | 946.45967270602 |
| 6 | 623 | -292.045353594390 | 915.04535359439 |
| 7 | 605 | -154.631034482758 | 759.631034482758 |
| 8 | 716 | -17.2167153711282 | 733.216715371128 |
| 9 | 677 | 120.197603740503 | 556.802396259497 |
| 10 | 710 | 257.611922852133 | 452.388077147867 |
| 11 | 839 | 395.026241963764 | 443.973758036236 |
| 12 | 886 | 532.440561075395 | 353.559438924605 |
| 13 | 891 | 669.854880187025 | 221.145119812975 |
| 14 | 917 | 807.269199298656 | 109.730800701344 |
| 15 | 820 | 944.683518410286 | -124.683518410286 |
| 16 | 793 | 1082.09783752192 | -289.097837521917 |
| 17 | 932 | 1219.51215663355 | -287.512156633548 |
| 18 | 906 | 1356.92647574518 | -450.926475745178 |
| 19 | 844 | 1494.34079485681 | -650.340794856809 |
| 20 | 801 | 1631.75511396844 | -830.75511396844 |
| 21 | 957 | 1769.16943308007 | -812.16943308007 |
| 22 | 1159 | 1906.5837521917 | -747.583752191701 |
| 23 | 1264 | 2043.99807130333 | -779.998071303331 |
| 24 | 1097 | 2181.41239041496 | -1084.41239041496 |
| 25 | 1240 | 2318.82670952659 | -1078.82670952659 |
| 26 | 1411 | 2456.24102863822 | -1045.24102863822 |
| 27 | 1535 | 2593.65534774985 | -1058.65534774985 |
| 28 | 1862 | 2731.06966686148 | -869.069666861485 |
| 29 | 1894 | 2868.48398597312 | -974.483985973115 |
| 30 | 2239 | 3005.89830508475 | -766.898305084746 |
| 31 | 2465 | 3143.31262419638 | -678.312624196376 |
| 32 | 2423 | 3280.72694330801 | -857.726943308007 |
| 33 | 2692 | 3418.14126241964 | -726.141262419638 |
| 34 | 2856 | 3555.55558153127 | -699.555581531268 |
| 35 | 3450 | 3692.9699006429 | -242.969900642899 |
| 36 | 4162 | 3830.38421975453 | 331.615780245471 |
| 37 | 4260 | 3967.79853886616 | 292.20146113384 |
| 38 | 4225 | 4105.21285797779 | 119.787142022209 |
| 39 | 4092 | 4242.62717708942 | -150.627177089421 |
| 40 | 4160 | 4380.04149620105 | -220.041496201052 |
| 41 | 3896 | 4517.45581531268 | -621.455815312683 |
| 42 | 3628 | 4654.87013442431 | -1026.87013442431 |
| 43 | 3754 | 4792.28445353594 | -1038.28445353594 |
| 44 | 3749 | 4929.69877264757 | -1180.69877264757 |
| 45 | 3907 | 5067.1130917592 | -1160.11309175920 |
| 46 | 4449 | 5204.52741087084 | -755.527410870836 |
| 47 | 5272 | 5341.94172998247 | -69.9417299824663 |
| 48 | 6197 | 5479.3560490941 | 717.643950905903 |
| 49 | 6446 | 5616.77036820573 | 829.229631794272 |
| 50 | 7157 | 5754.18468731736 | 1402.81531268264 |
| 51 | 7559 | 5891.59900642899 | 1667.40099357101 |
| 52 | 7674 | 6029.01332554062 | 1644.98667445938 |
| 53 | 6929 | 6166.42764465225 | 762.57235534775 |
| 54 | 7156 | 6303.84196376388 | 852.15803623612 |
| 55 | 6805 | 6441.25628287551 | 363.743717124489 |
| 56 | 7095 | 6578.67060198714 | 516.329398012858 |
| 57 | 7222 | 6716.08492109877 | 505.915078901228 |
| 58 | 7593 | 6853.4992402104 | 739.500759789597 |
| 59 | 7910 | 6990.91355932203 | 919.086440677966 |
| Goldfeld-Quandt test for Heteroskedasticity | |||
| p-values | Alternative Hypothesis | ||
| breakpoint index | greater | 2-sided | less |
| 5 | 4.42271496312226e-05 | 8.84542992624453e-05 | 0.999955772850369 |
| 6 | 1.90762692546178e-06 | 3.81525385092355e-06 | 0.999998092373075 |
| 7 | 4.79758078960742e-06 | 9.59516157921484e-06 | 0.99999520241921 |
| 8 | 5.4329239113529e-07 | 1.08658478227058e-06 | 0.999999456707609 |
| 9 | 5.48037715144814e-07 | 1.09607543028963e-06 | 0.999999451962285 |
| 10 | 2.60316508013353e-07 | 5.20633016026707e-07 | 0.999999739683492 |
| 11 | 3.96599541294006e-08 | 7.93199082588011e-08 | 0.999999960340046 |
| 12 | 6.83266171073095e-09 | 1.36653234214619e-08 | 0.999999993167338 |
| 13 | 2.07781253226046e-09 | 4.15562506452092e-09 | 0.999999997922188 |
| 14 | 8.1061629245219e-10 | 1.62123258490438e-09 | 0.999999999189384 |
| 15 | 3.47116487799495e-09 | 6.9423297559899e-09 | 0.999999996528835 |
| 16 | 1.05528798238545e-08 | 2.11057596477090e-08 | 0.99999998944712 |
| 17 | 4.17282536463961e-09 | 8.34565072927921e-09 | 0.999999995827175 |
| 18 | 2.43155410333443e-09 | 4.86310820666886e-09 | 0.999999997568446 |
| 19 | 2.91522993851115e-09 | 5.83045987702229e-09 | 0.99999999708477 |
| 20 | 4.34579521009899e-09 | 8.69159042019798e-09 | 0.999999995654205 |
| 21 | 1.32041948983619e-09 | 2.64083897967239e-09 | 0.99999999867958 |
| 22 | 3.80887523644684e-10 | 7.61775047289368e-10 | 0.999999999619112 |
| 23 | 1.45119517810022e-10 | 2.90239035620043e-10 | 0.99999999985488 |
| 24 | 3.58390415284385e-11 | 7.1678083056877e-11 | 0.999999999964161 |
| 25 | 7.08902366188324e-12 | 1.41780473237665e-11 | 0.999999999992911 |
| 26 | 2.68794526214162e-12 | 5.37589052428323e-12 | 0.999999999997312 |
| 27 | 1.85408511608094e-12 | 3.70817023216188e-12 | 0.999999999998146 |
| 28 | 4.42458851643153e-11 | 8.84917703286306e-11 | 0.999999999955754 |
| 29 | 1.28008636165601e-10 | 2.56017272331201e-10 | 0.999999999871991 |
| 30 | 4.24486507461142e-09 | 8.48973014922283e-09 | 0.999999995755135 |
| 31 | 9.2268313608535e-08 | 1.8453662721707e-07 | 0.999999907731686 |
| 32 | 1.91178110060626e-07 | 3.82356220121252e-07 | 0.99999980882189 |
| 33 | 7.47608528771833e-07 | 1.49521705754367e-06 | 0.999999252391471 |
| 34 | 2.24543969288755e-06 | 4.4908793857751e-06 | 0.999997754560307 |
| 35 | 5.14586780493138e-05 | 0.000102917356098628 | 0.99994854132195 |
| 36 | 0.00412650645896617 | 0.00825301291793235 | 0.995873493541034 |
| 37 | 0.0300897637321575 | 0.060179527464315 | 0.969910236267842 |
| 38 | 0.0707872896808718 | 0.141574579361744 | 0.929212710319128 |
| 39 | 0.0873877744650838 | 0.174775548930168 | 0.912612225534916 |
| 40 | 0.0950176630048566 | 0.190035326009713 | 0.904982336995143 |
| 41 | 0.0696201023164294 | 0.139240204632859 | 0.93037989768357 |
| 42 | 0.0491845691876802 | 0.0983691383753604 | 0.95081543081232 |
| 43 | 0.0387534250252959 | 0.0775068500505919 | 0.961246574974704 |
| 44 | 0.0504411758652126 | 0.100882351730425 | 0.949558824134787 |
| 45 | 0.137778380513187 | 0.275556761026374 | 0.862221619486813 |
| 46 | 0.437541155771487 | 0.875082311542975 | 0.562458844228513 |
| 47 | 0.794190131139567 | 0.411619737720867 | 0.205809868860433 |
| 48 | 0.894942986631059 | 0.210114026737883 | 0.105057013368941 |
| 49 | 0.94806142287045 | 0.1038771542591 | 0.05193857712955 |
| 50 | 0.945549615663684 | 0.108900768672631 | 0.0544503843363156 |
| 51 | 0.957780914301864 | 0.0844381713962718 | 0.0422190856981359 |
| 52 | 0.995792780349283 | 0.00841443930143434 | 0.00420721965071717 |
| 53 | 0.988567053527849 | 0.0228658929443029 | 0.0114329464721515 |
| 54 | 0.999166717460474 | 0.00166656507905257 | 0.000833282539526286 |
| Meta Analysis of Goldfeld-Quandt test for Heteroskedasticity | |||
| Description | # significant tests | % significant tests | OK/NOK |
| 1% type I error level | 34 | 0.68 | NOK |
| 5% type I error level | 35 | 0.7 | NOK |
| 10% type I error level | 39 | 0.78 | NOK |