Free Statistics

of Irreproducible Research!

Author's title

Author*The author of this computation has been verified*
R Software Modulerwasp_multipleregression.wasp
Title produced by softwareMultiple Regression
Date of computationSat, 18 Dec 2010 19:23:16 +0000
Cite this page as followsStatistical Computations at FreeStatistics.org, Office for Research Development and Education, URL https://freestatistics.org/blog/index.php?v=date/2010/Dec/18/t1292700139vhp98lxq136t82x.htm/, Retrieved Tue, 30 Apr 2024 01:59:03 +0000
Statistical Computations at FreeStatistics.org, Office for Research Development and Education, URL https://freestatistics.org/blog/index.php?pk=112166, Retrieved Tue, 30 Apr 2024 01:59:03 +0000
QR Codes:

Original text written by user:
IsPrivate?No (this computation is public)
User-defined keywords
Estimated Impact140
Family? (F = Feedback message, R = changed R code, M = changed R Module, P = changed Parameters, D = changed Data)
-     [Univariate Data Series] [data set] [2008-12-01 19:54:57] [b98453cac15ba1066b407e146608df68]
- RMP   [(Partial) Autocorrelation Function] [Workshop 8 Autoco...] [2010-11-28 16:39:23] [945bcebba5e7ac34a41d6888338a1ba9]
- RMP     [Classical Decomposition] [workshop 8 Klassi...] [2010-11-28 17:01:52] [945bcebba5e7ac34a41d6888338a1ba9]
- RMPD      [Exponential Smoothing] [Paper TSA Exponen...] [2010-12-18 18:11:45] [945bcebba5e7ac34a41d6888338a1ba9]
- RMP           [Multiple Regression] [Paper TSA MR Fail...] [2010-12-18 19:23:16] [514029464b0621595fe21c9fa38c7009] [Current]
Feedback Forum

Post a new message
Dataseries X:
67
189
342
432
517
623
605
716
677
710
839
886
891
917
820
793
932
906
844
801
957
1159
1264
1097
1240
1411
1535
1862
1894
2239
2465
2423
2692
2856
3450
4162
4260
4225
4092
4160
3896
3628
3754
3749
3907
4449
5272
6197
6446
7157
7559
7674
6929
7156
6805
7095
7222
7593
7910


Summary of computational transaction
Raw Inputview raw input (R code)
Raw Outputview raw output of R engine
Computing time5 seconds
R Server'Sir Ronald Aylmer Fisher' @ 193.190.124.24

\begin{tabular}{lllllllll}
\hline
Summary of computational transaction \tabularnewline
Raw Input & view raw input (R code)  \tabularnewline
Raw Output & view raw output of R engine  \tabularnewline
Computing time & 5 seconds \tabularnewline
R Server & 'Sir Ronald Aylmer Fisher' @ 193.190.124.24 \tabularnewline
\hline
\end{tabular}
%Source: https://freestatistics.org/blog/index.php?pk=112166&T=0

[TABLE]
[ROW][C]Summary of computational transaction[/C][/ROW]
[ROW][C]Raw Input[/C][C]view raw input (R code) [/C][/ROW]
[ROW][C]Raw Output[/C][C]view raw output of R engine [/C][/ROW]
[ROW][C]Computing time[/C][C]5 seconds[/C][/ROW]
[ROW][C]R Server[/C][C]'Sir Ronald Aylmer Fisher' @ 193.190.124.24[/C][/ROW]
[/TABLE]
Source: https://freestatistics.org/blog/index.php?pk=112166&T=0

Globally Unique Identifier (entire table): ba.freestatistics.org/blog/index.php?pk=112166&T=0

As an alternative you can also use a QR Code:  

The GUIDs for individual cells are displayed in the table below:

Summary of computational transaction
Raw Inputview raw input (R code)
Raw Outputview raw output of R engine
Computing time5 seconds
R Server'Sir Ronald Aylmer Fisher' @ 193.190.124.24


Multiple Linear Regression - Estimated Regression Equation
Faillissementen[t] = -1116.53126826417 + 137.414319111631t + e[t]

\begin{tabular}{lllllllll}
\hline
Multiple Linear Regression - Estimated Regression Equation \tabularnewline
Faillissementen[t] =  -1116.53126826417 +  137.414319111631t  + e[t] \tabularnewline
\hline
\end{tabular}
%Source: https://freestatistics.org/blog/index.php?pk=112166&T=1

[TABLE]
[ROW][C]Multiple Linear Regression - Estimated Regression Equation[/C][/ROW]
[ROW][C]Faillissementen[t] =  -1116.53126826417 +  137.414319111631t  + e[t][/C][/ROW]
[/TABLE]
Source: https://freestatistics.org/blog/index.php?pk=112166&T=1

Globally Unique Identifier (entire table): ba.freestatistics.org/blog/index.php?pk=112166&T=1

As an alternative you can also use a QR Code:  

The GUIDs for individual cells are displayed in the table below:

Multiple Linear Regression - Estimated Regression Equation
Faillissementen[t] = -1116.53126826417 + 137.414319111631t + e[t]


Multiple Linear Regression - Ordinary Least Squares
VariableParameterS.D.T-STATH0: parameter = 02-tail p-value1-tail p-value
(Intercept)-1116.53126826417216.919568-5.14723e-062e-06
t137.4143191116316.28818421.852800

\begin{tabular}{lllllllll}
\hline
Multiple Linear Regression - Ordinary Least Squares \tabularnewline
Variable & Parameter & S.D. & T-STATH0: parameter = 0 & 2-tail p-value & 1-tail p-value \tabularnewline
(Intercept) & -1116.53126826417 & 216.919568 & -5.1472 & 3e-06 & 2e-06 \tabularnewline
t & 137.414319111631 & 6.288184 & 21.8528 & 0 & 0 \tabularnewline
\hline
\end{tabular}
%Source: https://freestatistics.org/blog/index.php?pk=112166&T=2

[TABLE]
[ROW][C]Multiple Linear Regression - Ordinary Least Squares[/C][/ROW]
[ROW][C]Variable[/C][C]Parameter[/C][C]S.D.[/C][C]T-STATH0: parameter = 0[/C][C]2-tail p-value[/C][C]1-tail p-value[/C][/ROW]
[ROW][C](Intercept)[/C][C]-1116.53126826417[/C][C]216.919568[/C][C]-5.1472[/C][C]3e-06[/C][C]2e-06[/C][/ROW]
[ROW][C]t[/C][C]137.414319111631[/C][C]6.288184[/C][C]21.8528[/C][C]0[/C][C]0[/C][/ROW]
[/TABLE]
Source: https://freestatistics.org/blog/index.php?pk=112166&T=2

Globally Unique Identifier (entire table): ba.freestatistics.org/blog/index.php?pk=112166&T=2

As an alternative you can also use a QR Code:  

The GUIDs for individual cells are displayed in the table below:

Multiple Linear Regression - Ordinary Least Squares
VariableParameterS.D.T-STATH0: parameter = 02-tail p-value1-tail p-value
(Intercept)-1116.53126826417216.919568-5.14723e-062e-06
t137.4143191116316.28818421.852800


Multiple Linear Regression - Regression Statistics
Multiple R0.94518097525683
R-squared0.89336707598745
Adjusted R-squared0.891496322934599
F-TEST (value)477.544096280167
F-TEST (DF numerator)1
F-TEST (DF denominator)57
p-value0
Multiple Linear Regression - Residual Statistics
Residual Standard Deviation822.527174207404
Sum Squared Residuals38563404.2816482

\begin{tabular}{lllllllll}
\hline
Multiple Linear Regression - Regression Statistics \tabularnewline
Multiple R & 0.94518097525683 \tabularnewline
R-squared & 0.89336707598745 \tabularnewline
Adjusted R-squared & 0.891496322934599 \tabularnewline
F-TEST (value) & 477.544096280167 \tabularnewline
F-TEST (DF numerator) & 1 \tabularnewline
F-TEST (DF denominator) & 57 \tabularnewline
p-value & 0 \tabularnewline
Multiple Linear Regression - Residual Statistics \tabularnewline
Residual Standard Deviation & 822.527174207404 \tabularnewline
Sum Squared Residuals & 38563404.2816482 \tabularnewline
\hline
\end{tabular}
%Source: https://freestatistics.org/blog/index.php?pk=112166&T=3

[TABLE]
[ROW][C]Multiple Linear Regression - Regression Statistics[/C][/ROW]
[ROW][C]Multiple R[/C][C]0.94518097525683[/C][/ROW]
[ROW][C]R-squared[/C][C]0.89336707598745[/C][/ROW]
[ROW][C]Adjusted R-squared[/C][C]0.891496322934599[/C][/ROW]
[ROW][C]F-TEST (value)[/C][C]477.544096280167[/C][/ROW]
[ROW][C]F-TEST (DF numerator)[/C][C]1[/C][/ROW]
[ROW][C]F-TEST (DF denominator)[/C][C]57[/C][/ROW]
[ROW][C]p-value[/C][C]0[/C][/ROW]
[ROW][C]Multiple Linear Regression - Residual Statistics[/C][/ROW]
[ROW][C]Residual Standard Deviation[/C][C]822.527174207404[/C][/ROW]
[ROW][C]Sum Squared Residuals[/C][C]38563404.2816482[/C][/ROW]
[/TABLE]
Source: https://freestatistics.org/blog/index.php?pk=112166&T=3

Globally Unique Identifier (entire table): ba.freestatistics.org/blog/index.php?pk=112166&T=3

As an alternative you can also use a QR Code:  

The GUIDs for individual cells are displayed in the table below:

Multiple Linear Regression - Regression Statistics
Multiple R0.94518097525683
R-squared0.89336707598745
Adjusted R-squared0.891496322934599
F-TEST (value)477.544096280167
F-TEST (DF numerator)1
F-TEST (DF denominator)57
p-value0
Multiple Linear Regression - Residual Statistics
Residual Standard Deviation822.527174207404
Sum Squared Residuals38563404.2816482


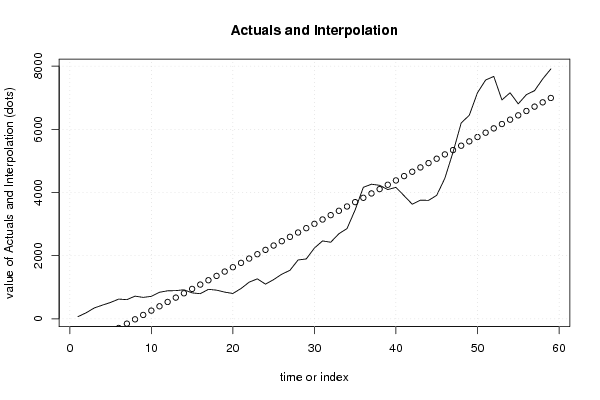
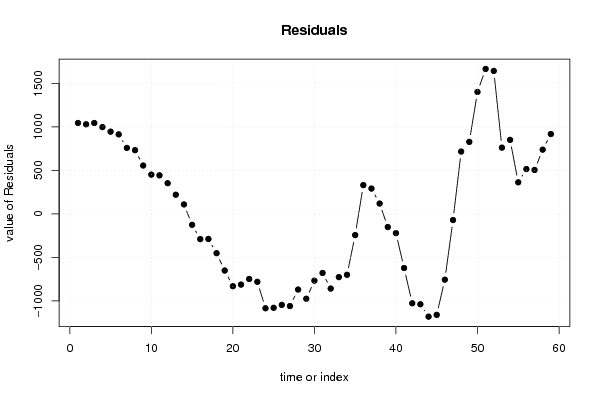
Multiple Linear Regression - Actuals, Interpolation, and Residuals
Time or IndexActualsInterpolationForecastResidualsPrediction Error
167-979.1169491525421046.11694915254
2189-841.7026300409151030.70263004091
3342-704.2883109292811046.28831092928
4432-566.87399181765998.87399181765
5517-429.45967270602946.45967270602
6623-292.045353594390915.04535359439
7605-154.631034482758759.631034482758
8716-17.2167153711282733.216715371128
9677120.197603740503556.802396259497
10710257.611922852133452.388077147867
11839395.026241963764443.973758036236
12886532.440561075395353.559438924605
13891669.854880187025221.145119812975
14917807.269199298656109.730800701344
15820944.683518410286-124.683518410286
167931082.09783752192-289.097837521917
179321219.51215663355-287.512156633548
189061356.92647574518-450.926475745178
198441494.34079485681-650.340794856809
208011631.75511396844-830.75511396844
219571769.16943308007-812.16943308007
2211591906.5837521917-747.583752191701
2312642043.99807130333-779.998071303331
2410972181.41239041496-1084.41239041496
2512402318.82670952659-1078.82670952659
2614112456.24102863822-1045.24102863822
2715352593.65534774985-1058.65534774985
2818622731.06966686148-869.069666861485
2918942868.48398597312-974.483985973115
3022393005.89830508475-766.898305084746
3124653143.31262419638-678.312624196376
3224233280.72694330801-857.726943308007
3326923418.14126241964-726.141262419638
3428563555.55558153127-699.555581531268
3534503692.9699006429-242.969900642899
3641623830.38421975453331.615780245471
3742603967.79853886616292.20146113384
3842254105.21285797779119.787142022209
3940924242.62717708942-150.627177089421
4041604380.04149620105-220.041496201052
4138964517.45581531268-621.455815312683
4236284654.87013442431-1026.87013442431
4337544792.28445353594-1038.28445353594
4437494929.69877264757-1180.69877264757
4539075067.1130917592-1160.11309175920
4644495204.52741087084-755.527410870836
4752725341.94172998247-69.9417299824663
4861975479.3560490941717.643950905903
4964465616.77036820573829.229631794272
5071575754.184687317361402.81531268264
5175595891.599006428991667.40099357101
5276746029.013325540621644.98667445938
5369296166.42764465225762.57235534775
5471566303.84196376388852.15803623612
5568056441.25628287551363.743717124489
5670956578.67060198714516.329398012858
5772226716.08492109877505.915078901228
5875936853.4992402104739.500759789597
5979106990.91355932203919.086440677966

\begin{tabular}{lllllllll}
\hline
Multiple Linear Regression - Actuals, Interpolation, and Residuals \tabularnewline
Time or Index & Actuals & InterpolationForecast & ResidualsPrediction Error \tabularnewline
1 & 67 & -979.116949152542 & 1046.11694915254 \tabularnewline
2 & 189 & -841.702630040915 & 1030.70263004091 \tabularnewline
3 & 342 & -704.288310929281 & 1046.28831092928 \tabularnewline
4 & 432 & -566.87399181765 & 998.87399181765 \tabularnewline
5 & 517 & -429.45967270602 & 946.45967270602 \tabularnewline
6 & 623 & -292.045353594390 & 915.04535359439 \tabularnewline
7 & 605 & -154.631034482758 & 759.631034482758 \tabularnewline
8 & 716 & -17.2167153711282 & 733.216715371128 \tabularnewline
9 & 677 & 120.197603740503 & 556.802396259497 \tabularnewline
10 & 710 & 257.611922852133 & 452.388077147867 \tabularnewline
11 & 839 & 395.026241963764 & 443.973758036236 \tabularnewline
12 & 886 & 532.440561075395 & 353.559438924605 \tabularnewline
13 & 891 & 669.854880187025 & 221.145119812975 \tabularnewline
14 & 917 & 807.269199298656 & 109.730800701344 \tabularnewline
15 & 820 & 944.683518410286 & -124.683518410286 \tabularnewline
16 & 793 & 1082.09783752192 & -289.097837521917 \tabularnewline
17 & 932 & 1219.51215663355 & -287.512156633548 \tabularnewline
18 & 906 & 1356.92647574518 & -450.926475745178 \tabularnewline
19 & 844 & 1494.34079485681 & -650.340794856809 \tabularnewline
20 & 801 & 1631.75511396844 & -830.75511396844 \tabularnewline
21 & 957 & 1769.16943308007 & -812.16943308007 \tabularnewline
22 & 1159 & 1906.5837521917 & -747.583752191701 \tabularnewline
23 & 1264 & 2043.99807130333 & -779.998071303331 \tabularnewline
24 & 1097 & 2181.41239041496 & -1084.41239041496 \tabularnewline
25 & 1240 & 2318.82670952659 & -1078.82670952659 \tabularnewline
26 & 1411 & 2456.24102863822 & -1045.24102863822 \tabularnewline
27 & 1535 & 2593.65534774985 & -1058.65534774985 \tabularnewline
28 & 1862 & 2731.06966686148 & -869.069666861485 \tabularnewline
29 & 1894 & 2868.48398597312 & -974.483985973115 \tabularnewline
30 & 2239 & 3005.89830508475 & -766.898305084746 \tabularnewline
31 & 2465 & 3143.31262419638 & -678.312624196376 \tabularnewline
32 & 2423 & 3280.72694330801 & -857.726943308007 \tabularnewline
33 & 2692 & 3418.14126241964 & -726.141262419638 \tabularnewline
34 & 2856 & 3555.55558153127 & -699.555581531268 \tabularnewline
35 & 3450 & 3692.9699006429 & -242.969900642899 \tabularnewline
36 & 4162 & 3830.38421975453 & 331.615780245471 \tabularnewline
37 & 4260 & 3967.79853886616 & 292.20146113384 \tabularnewline
38 & 4225 & 4105.21285797779 & 119.787142022209 \tabularnewline
39 & 4092 & 4242.62717708942 & -150.627177089421 \tabularnewline
40 & 4160 & 4380.04149620105 & -220.041496201052 \tabularnewline
41 & 3896 & 4517.45581531268 & -621.455815312683 \tabularnewline
42 & 3628 & 4654.87013442431 & -1026.87013442431 \tabularnewline
43 & 3754 & 4792.28445353594 & -1038.28445353594 \tabularnewline
44 & 3749 & 4929.69877264757 & -1180.69877264757 \tabularnewline
45 & 3907 & 5067.1130917592 & -1160.11309175920 \tabularnewline
46 & 4449 & 5204.52741087084 & -755.527410870836 \tabularnewline
47 & 5272 & 5341.94172998247 & -69.9417299824663 \tabularnewline
48 & 6197 & 5479.3560490941 & 717.643950905903 \tabularnewline
49 & 6446 & 5616.77036820573 & 829.229631794272 \tabularnewline
50 & 7157 & 5754.18468731736 & 1402.81531268264 \tabularnewline
51 & 7559 & 5891.59900642899 & 1667.40099357101 \tabularnewline
52 & 7674 & 6029.01332554062 & 1644.98667445938 \tabularnewline
53 & 6929 & 6166.42764465225 & 762.57235534775 \tabularnewline
54 & 7156 & 6303.84196376388 & 852.15803623612 \tabularnewline
55 & 6805 & 6441.25628287551 & 363.743717124489 \tabularnewline
56 & 7095 & 6578.67060198714 & 516.329398012858 \tabularnewline
57 & 7222 & 6716.08492109877 & 505.915078901228 \tabularnewline
58 & 7593 & 6853.4992402104 & 739.500759789597 \tabularnewline
59 & 7910 & 6990.91355932203 & 919.086440677966 \tabularnewline
\hline
\end{tabular}
%Source: https://freestatistics.org/blog/index.php?pk=112166&T=4

[TABLE]
[ROW][C]Multiple Linear Regression - Actuals, Interpolation, and Residuals[/C][/ROW]
[ROW][C]Time or Index[/C][C]Actuals[/C][C]InterpolationForecast[/C][C]ResidualsPrediction Error[/C][/ROW]
[ROW][C]1[/C][C]67[/C][C]-979.116949152542[/C][C]1046.11694915254[/C][/ROW]
[ROW][C]2[/C][C]189[/C][C]-841.702630040915[/C][C]1030.70263004091[/C][/ROW]
[ROW][C]3[/C][C]342[/C][C]-704.288310929281[/C][C]1046.28831092928[/C][/ROW]
[ROW][C]4[/C][C]432[/C][C]-566.87399181765[/C][C]998.87399181765[/C][/ROW]
[ROW][C]5[/C][C]517[/C][C]-429.45967270602[/C][C]946.45967270602[/C][/ROW]
[ROW][C]6[/C][C]623[/C][C]-292.045353594390[/C][C]915.04535359439[/C][/ROW]
[ROW][C]7[/C][C]605[/C][C]-154.631034482758[/C][C]759.631034482758[/C][/ROW]
[ROW][C]8[/C][C]716[/C][C]-17.2167153711282[/C][C]733.216715371128[/C][/ROW]
[ROW][C]9[/C][C]677[/C][C]120.197603740503[/C][C]556.802396259497[/C][/ROW]
[ROW][C]10[/C][C]710[/C][C]257.611922852133[/C][C]452.388077147867[/C][/ROW]
[ROW][C]11[/C][C]839[/C][C]395.026241963764[/C][C]443.973758036236[/C][/ROW]
[ROW][C]12[/C][C]886[/C][C]532.440561075395[/C][C]353.559438924605[/C][/ROW]
[ROW][C]13[/C][C]891[/C][C]669.854880187025[/C][C]221.145119812975[/C][/ROW]
[ROW][C]14[/C][C]917[/C][C]807.269199298656[/C][C]109.730800701344[/C][/ROW]
[ROW][C]15[/C][C]820[/C][C]944.683518410286[/C][C]-124.683518410286[/C][/ROW]
[ROW][C]16[/C][C]793[/C][C]1082.09783752192[/C][C]-289.097837521917[/C][/ROW]
[ROW][C]17[/C][C]932[/C][C]1219.51215663355[/C][C]-287.512156633548[/C][/ROW]
[ROW][C]18[/C][C]906[/C][C]1356.92647574518[/C][C]-450.926475745178[/C][/ROW]
[ROW][C]19[/C][C]844[/C][C]1494.34079485681[/C][C]-650.340794856809[/C][/ROW]
[ROW][C]20[/C][C]801[/C][C]1631.75511396844[/C][C]-830.75511396844[/C][/ROW]
[ROW][C]21[/C][C]957[/C][C]1769.16943308007[/C][C]-812.16943308007[/C][/ROW]
[ROW][C]22[/C][C]1159[/C][C]1906.5837521917[/C][C]-747.583752191701[/C][/ROW]
[ROW][C]23[/C][C]1264[/C][C]2043.99807130333[/C][C]-779.998071303331[/C][/ROW]
[ROW][C]24[/C][C]1097[/C][C]2181.41239041496[/C][C]-1084.41239041496[/C][/ROW]
[ROW][C]25[/C][C]1240[/C][C]2318.82670952659[/C][C]-1078.82670952659[/C][/ROW]
[ROW][C]26[/C][C]1411[/C][C]2456.24102863822[/C][C]-1045.24102863822[/C][/ROW]
[ROW][C]27[/C][C]1535[/C][C]2593.65534774985[/C][C]-1058.65534774985[/C][/ROW]
[ROW][C]28[/C][C]1862[/C][C]2731.06966686148[/C][C]-869.069666861485[/C][/ROW]
[ROW][C]29[/C][C]1894[/C][C]2868.48398597312[/C][C]-974.483985973115[/C][/ROW]
[ROW][C]30[/C][C]2239[/C][C]3005.89830508475[/C][C]-766.898305084746[/C][/ROW]
[ROW][C]31[/C][C]2465[/C][C]3143.31262419638[/C][C]-678.312624196376[/C][/ROW]
[ROW][C]32[/C][C]2423[/C][C]3280.72694330801[/C][C]-857.726943308007[/C][/ROW]
[ROW][C]33[/C][C]2692[/C][C]3418.14126241964[/C][C]-726.141262419638[/C][/ROW]
[ROW][C]34[/C][C]2856[/C][C]3555.55558153127[/C][C]-699.555581531268[/C][/ROW]
[ROW][C]35[/C][C]3450[/C][C]3692.9699006429[/C][C]-242.969900642899[/C][/ROW]
[ROW][C]36[/C][C]4162[/C][C]3830.38421975453[/C][C]331.615780245471[/C][/ROW]
[ROW][C]37[/C][C]4260[/C][C]3967.79853886616[/C][C]292.20146113384[/C][/ROW]
[ROW][C]38[/C][C]4225[/C][C]4105.21285797779[/C][C]119.787142022209[/C][/ROW]
[ROW][C]39[/C][C]4092[/C][C]4242.62717708942[/C][C]-150.627177089421[/C][/ROW]
[ROW][C]40[/C][C]4160[/C][C]4380.04149620105[/C][C]-220.041496201052[/C][/ROW]
[ROW][C]41[/C][C]3896[/C][C]4517.45581531268[/C][C]-621.455815312683[/C][/ROW]
[ROW][C]42[/C][C]3628[/C][C]4654.87013442431[/C][C]-1026.87013442431[/C][/ROW]
[ROW][C]43[/C][C]3754[/C][C]4792.28445353594[/C][C]-1038.28445353594[/C][/ROW]
[ROW][C]44[/C][C]3749[/C][C]4929.69877264757[/C][C]-1180.69877264757[/C][/ROW]
[ROW][C]45[/C][C]3907[/C][C]5067.1130917592[/C][C]-1160.11309175920[/C][/ROW]
[ROW][C]46[/C][C]4449[/C][C]5204.52741087084[/C][C]-755.527410870836[/C][/ROW]
[ROW][C]47[/C][C]5272[/C][C]5341.94172998247[/C][C]-69.9417299824663[/C][/ROW]
[ROW][C]48[/C][C]6197[/C][C]5479.3560490941[/C][C]717.643950905903[/C][/ROW]
[ROW][C]49[/C][C]6446[/C][C]5616.77036820573[/C][C]829.229631794272[/C][/ROW]
[ROW][C]50[/C][C]7157[/C][C]5754.18468731736[/C][C]1402.81531268264[/C][/ROW]
[ROW][C]51[/C][C]7559[/C][C]5891.59900642899[/C][C]1667.40099357101[/C][/ROW]
[ROW][C]52[/C][C]7674[/C][C]6029.01332554062[/C][C]1644.98667445938[/C][/ROW]
[ROW][C]53[/C][C]6929[/C][C]6166.42764465225[/C][C]762.57235534775[/C][/ROW]
[ROW][C]54[/C][C]7156[/C][C]6303.84196376388[/C][C]852.15803623612[/C][/ROW]
[ROW][C]55[/C][C]6805[/C][C]6441.25628287551[/C][C]363.743717124489[/C][/ROW]
[ROW][C]56[/C][C]7095[/C][C]6578.67060198714[/C][C]516.329398012858[/C][/ROW]
[ROW][C]57[/C][C]7222[/C][C]6716.08492109877[/C][C]505.915078901228[/C][/ROW]
[ROW][C]58[/C][C]7593[/C][C]6853.4992402104[/C][C]739.500759789597[/C][/ROW]
[ROW][C]59[/C][C]7910[/C][C]6990.91355932203[/C][C]919.086440677966[/C][/ROW]
[/TABLE]
Source: https://freestatistics.org/blog/index.php?pk=112166&T=4

Globally Unique Identifier (entire table): ba.freestatistics.org/blog/index.php?pk=112166&T=4

As an alternative you can also use a QR Code:  

The GUIDs for individual cells are displayed in the table below:

Multiple Linear Regression - Actuals, Interpolation, and Residuals
Time or IndexActualsInterpolationForecastResidualsPrediction Error
167-979.1169491525421046.11694915254
2189-841.7026300409151030.70263004091
3342-704.2883109292811046.28831092928
4432-566.87399181765998.87399181765
5517-429.45967270602946.45967270602
6623-292.045353594390915.04535359439
7605-154.631034482758759.631034482758
8716-17.2167153711282733.216715371128
9677120.197603740503556.802396259497
10710257.611922852133452.388077147867
11839395.026241963764443.973758036236
12886532.440561075395353.559438924605
13891669.854880187025221.145119812975
14917807.269199298656109.730800701344
15820944.683518410286-124.683518410286
167931082.09783752192-289.097837521917
179321219.51215663355-287.512156633548
189061356.92647574518-450.926475745178
198441494.34079485681-650.340794856809
208011631.75511396844-830.75511396844
219571769.16943308007-812.16943308007
2211591906.5837521917-747.583752191701
2312642043.99807130333-779.998071303331
2410972181.41239041496-1084.41239041496
2512402318.82670952659-1078.82670952659
2614112456.24102863822-1045.24102863822
2715352593.65534774985-1058.65534774985
2818622731.06966686148-869.069666861485
2918942868.48398597312-974.483985973115
3022393005.89830508475-766.898305084746
3124653143.31262419638-678.312624196376
3224233280.72694330801-857.726943308007
3326923418.14126241964-726.141262419638
3428563555.55558153127-699.555581531268
3534503692.9699006429-242.969900642899
3641623830.38421975453331.615780245471
3742603967.79853886616292.20146113384
3842254105.21285797779119.787142022209
3940924242.62717708942-150.627177089421
4041604380.04149620105-220.041496201052
4138964517.45581531268-621.455815312683
4236284654.87013442431-1026.87013442431
4337544792.28445353594-1038.28445353594
4437494929.69877264757-1180.69877264757
4539075067.1130917592-1160.11309175920
4644495204.52741087084-755.527410870836
4752725341.94172998247-69.9417299824663
4861975479.3560490941717.643950905903
4964465616.77036820573829.229631794272
5071575754.184687317361402.81531268264
5175595891.599006428991667.40099357101
5276746029.013325540621644.98667445938
5369296166.42764465225762.57235534775
5471566303.84196376388852.15803623612
5568056441.25628287551363.743717124489
5670956578.67060198714516.329398012858
5772226716.08492109877505.915078901228
5875936853.4992402104739.500759789597
5979106990.91355932203919.086440677966


Goldfeld-Quandt test for Heteroskedasticity
p-valuesAlternative Hypothesis
breakpoint indexgreater2-sidedless
54.42271496312226e-058.84542992624453e-050.999955772850369
61.90762692546178e-063.81525385092355e-060.999998092373075
74.79758078960742e-069.59516157921484e-060.99999520241921
85.4329239113529e-071.08658478227058e-060.999999456707609
95.48037715144814e-071.09607543028963e-060.999999451962285
102.60316508013353e-075.20633016026707e-070.999999739683492
113.96599541294006e-087.93199082588011e-080.999999960340046
126.83266171073095e-091.36653234214619e-080.999999993167338
132.07781253226046e-094.15562506452092e-090.999999997922188
148.1061629245219e-101.62123258490438e-090.999999999189384
153.47116487799495e-096.9423297559899e-090.999999996528835
161.05528798238545e-082.11057596477090e-080.99999998944712
174.17282536463961e-098.34565072927921e-090.999999995827175
182.43155410333443e-094.86310820666886e-090.999999997568446
192.91522993851115e-095.83045987702229e-090.99999999708477
204.34579521009899e-098.69159042019798e-090.999999995654205
211.32041948983619e-092.64083897967239e-090.99999999867958
223.80887523644684e-107.61775047289368e-100.999999999619112
231.45119517810022e-102.90239035620043e-100.99999999985488
243.58390415284385e-117.1678083056877e-110.999999999964161
257.08902366188324e-121.41780473237665e-110.999999999992911
262.68794526214162e-125.37589052428323e-120.999999999997312
271.85408511608094e-123.70817023216188e-120.999999999998146
284.42458851643153e-118.84917703286306e-110.999999999955754
291.28008636165601e-102.56017272331201e-100.999999999871991
304.24486507461142e-098.48973014922283e-090.999999995755135
319.2268313608535e-081.8453662721707e-070.999999907731686
321.91178110060626e-073.82356220121252e-070.99999980882189
337.47608528771833e-071.49521705754367e-060.999999252391471
342.24543969288755e-064.4908793857751e-060.999997754560307
355.14586780493138e-050.0001029173560986280.99994854132195
360.004126506458966170.008253012917932350.995873493541034
370.03008976373215750.0601795274643150.969910236267842
380.07078728968087180.1415745793617440.929212710319128
390.08738777446508380.1747755489301680.912612225534916
400.09501766300485660.1900353260097130.904982336995143
410.06962010231642940.1392402046328590.93037989768357
420.04918456918768020.09836913837536040.95081543081232
430.03875342502529590.07750685005059190.961246574974704
440.05044117586521260.1008823517304250.949558824134787
450.1377783805131870.2755567610263740.862221619486813
460.4375411557714870.8750823115429750.562458844228513
470.7941901311395670.4116197377208670.205809868860433
480.8949429866310590.2101140267378830.105057013368941
490.948061422870450.10387715425910.05193857712955
500.9455496156636840.1089007686726310.0544503843363156
510.9577809143018640.08443817139627180.0422190856981359
520.9957927803492830.008414439301434340.00420721965071717
530.9885670535278490.02286589294430290.0114329464721515
540.9991667174604740.001666565079052570.000833282539526286

\begin{tabular}{lllllllll}
\hline
Goldfeld-Quandt test for Heteroskedasticity \tabularnewline
p-values & Alternative Hypothesis \tabularnewline
breakpoint index & greater & 2-sided & less \tabularnewline
5 & 4.42271496312226e-05 & 8.84542992624453e-05 & 0.999955772850369 \tabularnewline
6 & 1.90762692546178e-06 & 3.81525385092355e-06 & 0.999998092373075 \tabularnewline
7 & 4.79758078960742e-06 & 9.59516157921484e-06 & 0.99999520241921 \tabularnewline
8 & 5.4329239113529e-07 & 1.08658478227058e-06 & 0.999999456707609 \tabularnewline
9 & 5.48037715144814e-07 & 1.09607543028963e-06 & 0.999999451962285 \tabularnewline
10 & 2.60316508013353e-07 & 5.20633016026707e-07 & 0.999999739683492 \tabularnewline
11 & 3.96599541294006e-08 & 7.93199082588011e-08 & 0.999999960340046 \tabularnewline
12 & 6.83266171073095e-09 & 1.36653234214619e-08 & 0.999999993167338 \tabularnewline
13 & 2.07781253226046e-09 & 4.15562506452092e-09 & 0.999999997922188 \tabularnewline
14 & 8.1061629245219e-10 & 1.62123258490438e-09 & 0.999999999189384 \tabularnewline
15 & 3.47116487799495e-09 & 6.9423297559899e-09 & 0.999999996528835 \tabularnewline
16 & 1.05528798238545e-08 & 2.11057596477090e-08 & 0.99999998944712 \tabularnewline
17 & 4.17282536463961e-09 & 8.34565072927921e-09 & 0.999999995827175 \tabularnewline
18 & 2.43155410333443e-09 & 4.86310820666886e-09 & 0.999999997568446 \tabularnewline
19 & 2.91522993851115e-09 & 5.83045987702229e-09 & 0.99999999708477 \tabularnewline
20 & 4.34579521009899e-09 & 8.69159042019798e-09 & 0.999999995654205 \tabularnewline
21 & 1.32041948983619e-09 & 2.64083897967239e-09 & 0.99999999867958 \tabularnewline
22 & 3.80887523644684e-10 & 7.61775047289368e-10 & 0.999999999619112 \tabularnewline
23 & 1.45119517810022e-10 & 2.90239035620043e-10 & 0.99999999985488 \tabularnewline
24 & 3.58390415284385e-11 & 7.1678083056877e-11 & 0.999999999964161 \tabularnewline
25 & 7.08902366188324e-12 & 1.41780473237665e-11 & 0.999999999992911 \tabularnewline
26 & 2.68794526214162e-12 & 5.37589052428323e-12 & 0.999999999997312 \tabularnewline
27 & 1.85408511608094e-12 & 3.70817023216188e-12 & 0.999999999998146 \tabularnewline
28 & 4.42458851643153e-11 & 8.84917703286306e-11 & 0.999999999955754 \tabularnewline
29 & 1.28008636165601e-10 & 2.56017272331201e-10 & 0.999999999871991 \tabularnewline
30 & 4.24486507461142e-09 & 8.48973014922283e-09 & 0.999999995755135 \tabularnewline
31 & 9.2268313608535e-08 & 1.8453662721707e-07 & 0.999999907731686 \tabularnewline
32 & 1.91178110060626e-07 & 3.82356220121252e-07 & 0.99999980882189 \tabularnewline
33 & 7.47608528771833e-07 & 1.49521705754367e-06 & 0.999999252391471 \tabularnewline
34 & 2.24543969288755e-06 & 4.4908793857751e-06 & 0.999997754560307 \tabularnewline
35 & 5.14586780493138e-05 & 0.000102917356098628 & 0.99994854132195 \tabularnewline
36 & 0.00412650645896617 & 0.00825301291793235 & 0.995873493541034 \tabularnewline
37 & 0.0300897637321575 & 0.060179527464315 & 0.969910236267842 \tabularnewline
38 & 0.0707872896808718 & 0.141574579361744 & 0.929212710319128 \tabularnewline
39 & 0.0873877744650838 & 0.174775548930168 & 0.912612225534916 \tabularnewline
40 & 0.0950176630048566 & 0.190035326009713 & 0.904982336995143 \tabularnewline
41 & 0.0696201023164294 & 0.139240204632859 & 0.93037989768357 \tabularnewline
42 & 0.0491845691876802 & 0.0983691383753604 & 0.95081543081232 \tabularnewline
43 & 0.0387534250252959 & 0.0775068500505919 & 0.961246574974704 \tabularnewline
44 & 0.0504411758652126 & 0.100882351730425 & 0.949558824134787 \tabularnewline
45 & 0.137778380513187 & 0.275556761026374 & 0.862221619486813 \tabularnewline
46 & 0.437541155771487 & 0.875082311542975 & 0.562458844228513 \tabularnewline
47 & 0.794190131139567 & 0.411619737720867 & 0.205809868860433 \tabularnewline
48 & 0.894942986631059 & 0.210114026737883 & 0.105057013368941 \tabularnewline
49 & 0.94806142287045 & 0.1038771542591 & 0.05193857712955 \tabularnewline
50 & 0.945549615663684 & 0.108900768672631 & 0.0544503843363156 \tabularnewline
51 & 0.957780914301864 & 0.0844381713962718 & 0.0422190856981359 \tabularnewline
52 & 0.995792780349283 & 0.00841443930143434 & 0.00420721965071717 \tabularnewline
53 & 0.988567053527849 & 0.0228658929443029 & 0.0114329464721515 \tabularnewline
54 & 0.999166717460474 & 0.00166656507905257 & 0.000833282539526286 \tabularnewline
\hline
\end{tabular}
%Source: https://freestatistics.org/blog/index.php?pk=112166&T=5

[TABLE]
[ROW][C]Goldfeld-Quandt test for Heteroskedasticity[/C][/ROW]
[ROW][C]p-values[/C][C]Alternative Hypothesis[/C][/ROW]
[ROW][C]breakpoint index[/C][C]greater[/C][C]2-sided[/C][C]less[/C][/ROW]
[ROW][C]5[/C][C]4.42271496312226e-05[/C][C]8.84542992624453e-05[/C][C]0.999955772850369[/C][/ROW]
[ROW][C]6[/C][C]1.90762692546178e-06[/C][C]3.81525385092355e-06[/C][C]0.999998092373075[/C][/ROW]
[ROW][C]7[/C][C]4.79758078960742e-06[/C][C]9.59516157921484e-06[/C][C]0.99999520241921[/C][/ROW]
[ROW][C]8[/C][C]5.4329239113529e-07[/C][C]1.08658478227058e-06[/C][C]0.999999456707609[/C][/ROW]
[ROW][C]9[/C][C]5.48037715144814e-07[/C][C]1.09607543028963e-06[/C][C]0.999999451962285[/C][/ROW]
[ROW][C]10[/C][C]2.60316508013353e-07[/C][C]5.20633016026707e-07[/C][C]0.999999739683492[/C][/ROW]
[ROW][C]11[/C][C]3.96599541294006e-08[/C][C]7.93199082588011e-08[/C][C]0.999999960340046[/C][/ROW]
[ROW][C]12[/C][C]6.83266171073095e-09[/C][C]1.36653234214619e-08[/C][C]0.999999993167338[/C][/ROW]
[ROW][C]13[/C][C]2.07781253226046e-09[/C][C]4.15562506452092e-09[/C][C]0.999999997922188[/C][/ROW]
[ROW][C]14[/C][C]8.1061629245219e-10[/C][C]1.62123258490438e-09[/C][C]0.999999999189384[/C][/ROW]
[ROW][C]15[/C][C]3.47116487799495e-09[/C][C]6.9423297559899e-09[/C][C]0.999999996528835[/C][/ROW]
[ROW][C]16[/C][C]1.05528798238545e-08[/C][C]2.11057596477090e-08[/C][C]0.99999998944712[/C][/ROW]
[ROW][C]17[/C][C]4.17282536463961e-09[/C][C]8.34565072927921e-09[/C][C]0.999999995827175[/C][/ROW]
[ROW][C]18[/C][C]2.43155410333443e-09[/C][C]4.86310820666886e-09[/C][C]0.999999997568446[/C][/ROW]
[ROW][C]19[/C][C]2.91522993851115e-09[/C][C]5.83045987702229e-09[/C][C]0.99999999708477[/C][/ROW]
[ROW][C]20[/C][C]4.34579521009899e-09[/C][C]8.69159042019798e-09[/C][C]0.999999995654205[/C][/ROW]
[ROW][C]21[/C][C]1.32041948983619e-09[/C][C]2.64083897967239e-09[/C][C]0.99999999867958[/C][/ROW]
[ROW][C]22[/C][C]3.80887523644684e-10[/C][C]7.61775047289368e-10[/C][C]0.999999999619112[/C][/ROW]
[ROW][C]23[/C][C]1.45119517810022e-10[/C][C]2.90239035620043e-10[/C][C]0.99999999985488[/C][/ROW]
[ROW][C]24[/C][C]3.58390415284385e-11[/C][C]7.1678083056877e-11[/C][C]0.999999999964161[/C][/ROW]
[ROW][C]25[/C][C]7.08902366188324e-12[/C][C]1.41780473237665e-11[/C][C]0.999999999992911[/C][/ROW]
[ROW][C]26[/C][C]2.68794526214162e-12[/C][C]5.37589052428323e-12[/C][C]0.999999999997312[/C][/ROW]
[ROW][C]27[/C][C]1.85408511608094e-12[/C][C]3.70817023216188e-12[/C][C]0.999999999998146[/C][/ROW]
[ROW][C]28[/C][C]4.42458851643153e-11[/C][C]8.84917703286306e-11[/C][C]0.999999999955754[/C][/ROW]
[ROW][C]29[/C][C]1.28008636165601e-10[/C][C]2.56017272331201e-10[/C][C]0.999999999871991[/C][/ROW]
[ROW][C]30[/C][C]4.24486507461142e-09[/C][C]8.48973014922283e-09[/C][C]0.999999995755135[/C][/ROW]
[ROW][C]31[/C][C]9.2268313608535e-08[/C][C]1.8453662721707e-07[/C][C]0.999999907731686[/C][/ROW]
[ROW][C]32[/C][C]1.91178110060626e-07[/C][C]3.82356220121252e-07[/C][C]0.99999980882189[/C][/ROW]
[ROW][C]33[/C][C]7.47608528771833e-07[/C][C]1.49521705754367e-06[/C][C]0.999999252391471[/C][/ROW]
[ROW][C]34[/C][C]2.24543969288755e-06[/C][C]4.4908793857751e-06[/C][C]0.999997754560307[/C][/ROW]
[ROW][C]35[/C][C]5.14586780493138e-05[/C][C]0.000102917356098628[/C][C]0.99994854132195[/C][/ROW]
[ROW][C]36[/C][C]0.00412650645896617[/C][C]0.00825301291793235[/C][C]0.995873493541034[/C][/ROW]
[ROW][C]37[/C][C]0.0300897637321575[/C][C]0.060179527464315[/C][C]0.969910236267842[/C][/ROW]
[ROW][C]38[/C][C]0.0707872896808718[/C][C]0.141574579361744[/C][C]0.929212710319128[/C][/ROW]
[ROW][C]39[/C][C]0.0873877744650838[/C][C]0.174775548930168[/C][C]0.912612225534916[/C][/ROW]
[ROW][C]40[/C][C]0.0950176630048566[/C][C]0.190035326009713[/C][C]0.904982336995143[/C][/ROW]
[ROW][C]41[/C][C]0.0696201023164294[/C][C]0.139240204632859[/C][C]0.93037989768357[/C][/ROW]
[ROW][C]42[/C][C]0.0491845691876802[/C][C]0.0983691383753604[/C][C]0.95081543081232[/C][/ROW]
[ROW][C]43[/C][C]0.0387534250252959[/C][C]0.0775068500505919[/C][C]0.961246574974704[/C][/ROW]
[ROW][C]44[/C][C]0.0504411758652126[/C][C]0.100882351730425[/C][C]0.949558824134787[/C][/ROW]
[ROW][C]45[/C][C]0.137778380513187[/C][C]0.275556761026374[/C][C]0.862221619486813[/C][/ROW]
[ROW][C]46[/C][C]0.437541155771487[/C][C]0.875082311542975[/C][C]0.562458844228513[/C][/ROW]
[ROW][C]47[/C][C]0.794190131139567[/C][C]0.411619737720867[/C][C]0.205809868860433[/C][/ROW]
[ROW][C]48[/C][C]0.894942986631059[/C][C]0.210114026737883[/C][C]0.105057013368941[/C][/ROW]
[ROW][C]49[/C][C]0.94806142287045[/C][C]0.1038771542591[/C][C]0.05193857712955[/C][/ROW]
[ROW][C]50[/C][C]0.945549615663684[/C][C]0.108900768672631[/C][C]0.0544503843363156[/C][/ROW]
[ROW][C]51[/C][C]0.957780914301864[/C][C]0.0844381713962718[/C][C]0.0422190856981359[/C][/ROW]
[ROW][C]52[/C][C]0.995792780349283[/C][C]0.00841443930143434[/C][C]0.00420721965071717[/C][/ROW]
[ROW][C]53[/C][C]0.988567053527849[/C][C]0.0228658929443029[/C][C]0.0114329464721515[/C][/ROW]
[ROW][C]54[/C][C]0.999166717460474[/C][C]0.00166656507905257[/C][C]0.000833282539526286[/C][/ROW]
[/TABLE]
Source: https://freestatistics.org/blog/index.php?pk=112166&T=5

Globally Unique Identifier (entire table): ba.freestatistics.org/blog/index.php?pk=112166&T=5

As an alternative you can also use a QR Code:  

The GUIDs for individual cells are displayed in the table below:

Goldfeld-Quandt test for Heteroskedasticity
p-valuesAlternative Hypothesis
breakpoint indexgreater2-sidedless
54.42271496312226e-058.84542992624453e-050.999955772850369
61.90762692546178e-063.81525385092355e-060.999998092373075
74.79758078960742e-069.59516157921484e-060.99999520241921
85.4329239113529e-071.08658478227058e-060.999999456707609
95.48037715144814e-071.09607543028963e-060.999999451962285
102.60316508013353e-075.20633016026707e-070.999999739683492
113.96599541294006e-087.93199082588011e-080.999999960340046
126.83266171073095e-091.36653234214619e-080.999999993167338
132.07781253226046e-094.15562506452092e-090.999999997922188
148.1061629245219e-101.62123258490438e-090.999999999189384
153.47116487799495e-096.9423297559899e-090.999999996528835
161.05528798238545e-082.11057596477090e-080.99999998944712
174.17282536463961e-098.34565072927921e-090.999999995827175
182.43155410333443e-094.86310820666886e-090.999999997568446
192.91522993851115e-095.83045987702229e-090.99999999708477
204.34579521009899e-098.69159042019798e-090.999999995654205
211.32041948983619e-092.64083897967239e-090.99999999867958
223.80887523644684e-107.61775047289368e-100.999999999619112
231.45119517810022e-102.90239035620043e-100.99999999985488
243.58390415284385e-117.1678083056877e-110.999999999964161
257.08902366188324e-121.41780473237665e-110.999999999992911
262.68794526214162e-125.37589052428323e-120.999999999997312
271.85408511608094e-123.70817023216188e-120.999999999998146
284.42458851643153e-118.84917703286306e-110.999999999955754
291.28008636165601e-102.56017272331201e-100.999999999871991
304.24486507461142e-098.48973014922283e-090.999999995755135
319.2268313608535e-081.8453662721707e-070.999999907731686
321.91178110060626e-073.82356220121252e-070.99999980882189
337.47608528771833e-071.49521705754367e-060.999999252391471
342.24543969288755e-064.4908793857751e-060.999997754560307
355.14586780493138e-050.0001029173560986280.99994854132195
360.004126506458966170.008253012917932350.995873493541034
370.03008976373215750.0601795274643150.969910236267842
380.07078728968087180.1415745793617440.929212710319128
390.08738777446508380.1747755489301680.912612225534916
400.09501766300485660.1900353260097130.904982336995143
410.06962010231642940.1392402046328590.93037989768357
420.04918456918768020.09836913837536040.95081543081232
430.03875342502529590.07750685005059190.961246574974704
440.05044117586521260.1008823517304250.949558824134787
450.1377783805131870.2755567610263740.862221619486813
460.4375411557714870.8750823115429750.562458844228513
470.7941901311395670.4116197377208670.205809868860433
480.8949429866310590.2101140267378830.105057013368941
490.948061422870450.10387715425910.05193857712955
500.9455496156636840.1089007686726310.0544503843363156
510.9577809143018640.08443817139627180.0422190856981359
520.9957927803492830.008414439301434340.00420721965071717
530.9885670535278490.02286589294430290.0114329464721515
540.9991667174604740.001666565079052570.000833282539526286


Meta Analysis of Goldfeld-Quandt test for Heteroskedasticity
Description# significant tests% significant testsOK/NOK
1% type I error level340.68NOK
5% type I error level350.7NOK
10% type I error level390.78NOK

\begin{tabular}{lllllllll}
\hline
Meta Analysis of Goldfeld-Quandt test for Heteroskedasticity \tabularnewline
Description & # significant tests & % significant tests & OK/NOK \tabularnewline
1% type I error level & 34 & 0.68 & NOK \tabularnewline
5% type I error level & 35 & 0.7 & NOK \tabularnewline
10% type I error level & 39 & 0.78 & NOK \tabularnewline
\hline
\end{tabular}
%Source: https://freestatistics.org/blog/index.php?pk=112166&T=6

[TABLE]
[ROW][C]Meta Analysis of Goldfeld-Quandt test for Heteroskedasticity[/C][/ROW]
[ROW][C]Description[/C][C]# significant tests[/C][C]% significant tests[/C][C]OK/NOK[/C][/ROW]
[ROW][C]1% type I error level[/C][C]34[/C][C]0.68[/C][C]NOK[/C][/ROW]
[ROW][C]5% type I error level[/C][C]35[/C][C]0.7[/C][C]NOK[/C][/ROW]
[ROW][C]10% type I error level[/C][C]39[/C][C]0.78[/C][C]NOK[/C][/ROW]
[/TABLE]
Source: https://freestatistics.org/blog/index.php?pk=112166&T=6

Globally Unique Identifier (entire table): ba.freestatistics.org/blog/index.php?pk=112166&T=6

As an alternative you can also use a QR Code:  

The GUIDs for individual cells are displayed in the table below:

Meta Analysis of Goldfeld-Quandt test for Heteroskedasticity
Description# significant tests% significant testsOK/NOK
1% type I error level340.68NOK
5% type I error level350.7NOK
10% type I error level390.78NOK


Parameters (Session):
par1 = 1 ; par2 = 0 ; par3 = 0 ; par4 = 1 ;
Parameters (R input):
par1 = 1 ; par2 = Do not include Seasonal Dummies ; par3 = Linear Trend ;
R code (references can be found in the software module):
library(lattice)
library(lmtest)
n25 <- 25 #minimum number of obs. for Goldfeld-Quandt test
par1 <- as.numeric(par1)
x <- t(y)
k <- length(x[1,])
n <- length(x[,1])
x1 <- cbind(x[,par1], x[,1:k!=par1])
mycolnames <- c(colnames(x)[par1], colnames(x)[1:k!=par1])
colnames(x1) <- mycolnames #colnames(x)[par1]
x <- x1
if (par3 == 'First Differences'){
x2 <- array(0, dim=c(n-1,k), dimnames=list(1:(n-1), paste('(1-B)',colnames(x),sep='')))
for (i in 1:n-1) {
for (j in 1:k) {
x2[i,j] <- x[i+1,j] - x[i,j]
}
}
x <- x2
}
if (par2 == 'Include Monthly Dummies'){
x2 <- array(0, dim=c(n,11), dimnames=list(1:n, paste('M', seq(1:11), sep ='')))
for (i in 1:11){
x2[seq(i,n,12),i] <- 1
}
x <- cbind(x, x2)
}
if (par2 == 'Include Quarterly Dummies'){
x2 <- array(0, dim=c(n,3), dimnames=list(1:n, paste('Q', seq(1:3), sep ='')))
for (i in 1:3){
x2[seq(i,n,4),i] <- 1
}
x <- cbind(x, x2)
}
k <- length(x[1,])
if (par3 == 'Linear Trend'){
x <- cbind(x, c(1:n))
colnames(x)[k+1] <- 't'
}
x
k <- length(x[1,])
df <- as.data.frame(x)
(mylm <- lm(df))
(mysum <- summary(mylm))
if (n > n25) {
kp3 <- k + 3
nmkm3 <- n - k - 3
gqarr <- array(NA, dim=c(nmkm3-kp3+1,3))
numgqtests <- 0
numsignificant1 <- 0
numsignificant5 <- 0
numsignificant10 <- 0
for (mypoint in kp3:nmkm3) {
j <- 0
numgqtests <- numgqtests + 1
for (myalt in c('greater', 'two.sided', 'less')) {
j <- j + 1
gqarr[mypoint-kp3+1,j] <- gqtest(mylm, point=mypoint, alternative=myalt)$p.value
}
if (gqarr[mypoint-kp3+1,2] < 0.01) numsignificant1 <- numsignificant1 + 1
if (gqarr[mypoint-kp3+1,2] < 0.05) numsignificant5 <- numsignificant5 + 1
if (gqarr[mypoint-kp3+1,2] < 0.10) numsignificant10 <- numsignificant10 + 1
}
gqarr
}
bitmap(file='test0.png')
plot(x[,1], type='l', main='Actuals and Interpolation', ylab='value of Actuals and Interpolation (dots)', xlab='time or index')
points(x[,1]-mysum$resid)
grid()
dev.off()
bitmap(file='test1.png')
plot(mysum$resid, type='b', pch=19, main='Residuals', ylab='value of Residuals', xlab='time or index')
grid()
dev.off()
bitmap(file='test2.png')
hist(mysum$resid, main='Residual Histogram', xlab='values of Residuals')
grid()
dev.off()
bitmap(file='test3.png')
densityplot(~mysum$resid,col='black',main='Residual Density Plot', xlab='values of Residuals')
dev.off()
bitmap(file='test4.png')
qqnorm(mysum$resid, main='Residual Normal Q-Q Plot')
qqline(mysum$resid)
grid()
dev.off()
(myerror <- as.ts(mysum$resid))
bitmap(file='test5.png')
dum <- cbind(lag(myerror,k=1),myerror)
dum
dum1 <- dum[2:length(myerror),]
dum1
z <- as.data.frame(dum1)
z
plot(z,main=paste('Residual Lag plot, lowess, and regression line'), ylab='values of Residuals', xlab='lagged values of Residuals')
lines(lowess(z))
abline(lm(z))
grid()
dev.off()
bitmap(file='test6.png')
acf(mysum$resid, lag.max=length(mysum$resid)/2, main='Residual Autocorrelation Function')
grid()
dev.off()
bitmap(file='test7.png')
pacf(mysum$resid, lag.max=length(mysum$resid)/2, main='Residual Partial Autocorrelation Function')
grid()
dev.off()
bitmap(file='test8.png')
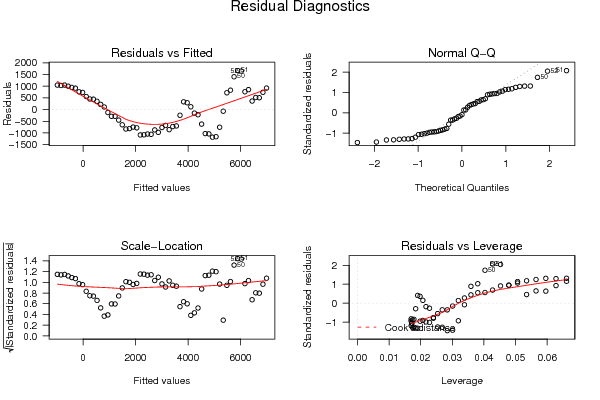
opar <- par(mfrow = c(2,2), oma = c(0, 0, 1.1, 0))
plot(mylm, las = 1, sub='Residual Diagnostics')
par(opar)
dev.off()
if (n > n25) {
bitmap(file='test9.png')
plot(kp3:nmkm3,gqarr[,2], main='Goldfeld-Quandt test',ylab='2-sided p-value',xlab='breakpoint')
grid()
dev.off()
}
load(file='createtable')
a<-table.start()
a<-table.row.start(a)
a<-table.element(a, 'Multiple Linear Regression - Estimated Regression Equation', 1, TRUE)
a<-table.row.end(a)
myeq <- colnames(x)[1]
myeq <- paste(myeq, '[t] = ', sep='')
for (i in 1:k){
if (mysum$coefficients[i,1] > 0) myeq <- paste(myeq, '+', '')
myeq <- paste(myeq, mysum$coefficients[i,1], sep=' ')
if (rownames(mysum$coefficients)[i] != '(Intercept)') {
myeq <- paste(myeq, rownames(mysum$coefficients)[i], sep='')
if (rownames(mysum$coefficients)[i] != 't') myeq <- paste(myeq, '[t]', sep='')
}
}
myeq <- paste(myeq, ' + e[t]')
a<-table.row.start(a)
a<-table.element(a, myeq)
a<-table.row.end(a)
a<-table.end(a)
table.save(a,file='mytable1.tab')
a<-table.start()
a<-table.row.start(a)
a<-table.element(a,hyperlink('ols1.htm','Multiple Linear Regression - Ordinary Least Squares',''), 6, TRUE)
a<-table.row.end(a)
a<-table.row.start(a)
a<-table.element(a,'Variable',header=TRUE)
a<-table.element(a,'Parameter',header=TRUE)
a<-table.element(a,'S.D.',header=TRUE)
a<-table.element(a,'T-STAT
H0: parameter = 0',header=TRUE)
a<-table.element(a,'2-tail p-value',header=TRUE)
a<-table.element(a,'1-tail p-value',header=TRUE)
a<-table.row.end(a)
for (i in 1:k){
a<-table.row.start(a)
a<-table.element(a,rownames(mysum$coefficients)[i],header=TRUE)
a<-table.element(a,mysum$coefficients[i,1])
a<-table.element(a, round(mysum$coefficients[i,2],6))
a<-table.element(a, round(mysum$coefficients[i,3],4))
a<-table.element(a, round(mysum$coefficients[i,4],6))
a<-table.element(a, round(mysum$coefficients[i,4]/2,6))
a<-table.row.end(a)
}
a<-table.end(a)
table.save(a,file='mytable2.tab')
a<-table.start()
a<-table.row.start(a)
a<-table.element(a, 'Multiple Linear Regression - Regression Statistics', 2, TRUE)
a<-table.row.end(a)
a<-table.row.start(a)
a<-table.element(a, 'Multiple R',1,TRUE)
a<-table.element(a, sqrt(mysum$r.squared))
a<-table.row.end(a)
a<-table.row.start(a)
a<-table.element(a, 'R-squared',1,TRUE)
a<-table.element(a, mysum$r.squared)
a<-table.row.end(a)
a<-table.row.start(a)
a<-table.element(a, 'Adjusted R-squared',1,TRUE)
a<-table.element(a, mysum$adj.r.squared)
a<-table.row.end(a)
a<-table.row.start(a)
a<-table.element(a, 'F-TEST (value)',1,TRUE)
a<-table.element(a, mysum$fstatistic[1])
a<-table.row.end(a)
a<-table.row.start(a)
a<-table.element(a, 'F-TEST (DF numerator)',1,TRUE)
a<-table.element(a, mysum$fstatistic[2])
a<-table.row.end(a)
a<-table.row.start(a)
a<-table.element(a, 'F-TEST (DF denominator)',1,TRUE)
a<-table.element(a, mysum$fstatistic[3])
a<-table.row.end(a)
a<-table.row.start(a)
a<-table.element(a, 'p-value',1,TRUE)
a<-table.element(a, 1-pf(mysum$fstatistic[1],mysum$fstatistic[2],mysum$fstatistic[3]))
a<-table.row.end(a)
a<-table.row.start(a)
a<-table.element(a, 'Multiple Linear Regression - Residual Statistics', 2, TRUE)
a<-table.row.end(a)
a<-table.row.start(a)
a<-table.element(a, 'Residual Standard Deviation',1,TRUE)
a<-table.element(a, mysum$sigma)
a<-table.row.end(a)
a<-table.row.start(a)
a<-table.element(a, 'Sum Squared Residuals',1,TRUE)
a<-table.element(a, sum(myerror*myerror))
a<-table.row.end(a)
a<-table.end(a)
table.save(a,file='mytable3.tab')
a<-table.start()
a<-table.row.start(a)
a<-table.element(a, 'Multiple Linear Regression - Actuals, Interpolation, and Residuals', 4, TRUE)
a<-table.row.end(a)
a<-table.row.start(a)
a<-table.element(a, 'Time or Index', 1, TRUE)
a<-table.element(a, 'Actuals', 1, TRUE)
a<-table.element(a, 'Interpolation
Forecast', 1, TRUE)
a<-table.element(a, 'Residuals
Prediction Error', 1, TRUE)
a<-table.row.end(a)
for (i in 1:n) {
a<-table.row.start(a)
a<-table.element(a,i, 1, TRUE)
a<-table.element(a,x[i])
a<-table.element(a,x[i]-mysum$resid[i])
a<-table.element(a,mysum$resid[i])
a<-table.row.end(a)
}
a<-table.end(a)
table.save(a,file='mytable4.tab')
if (n > n25) {
a<-table.start()
a<-table.row.start(a)
a<-table.element(a,'Goldfeld-Quandt test for Heteroskedasticity',4,TRUE)
a<-table.row.end(a)
a<-table.row.start(a)
a<-table.element(a,'p-values',header=TRUE)
a<-table.element(a,'Alternative Hypothesis',3,header=TRUE)
a<-table.row.end(a)
a<-table.row.start(a)
a<-table.element(a,'breakpoint index',header=TRUE)
a<-table.element(a,'greater',header=TRUE)
a<-table.element(a,'2-sided',header=TRUE)
a<-table.element(a,'less',header=TRUE)
a<-table.row.end(a)
for (mypoint in kp3:nmkm3) {
a<-table.row.start(a)
a<-table.element(a,mypoint,header=TRUE)
a<-table.element(a,gqarr[mypoint-kp3+1,1])
a<-table.element(a,gqarr[mypoint-kp3+1,2])
a<-table.element(a,gqarr[mypoint-kp3+1,3])
a<-table.row.end(a)
}
a<-table.end(a)
table.save(a,file='mytable5.tab')
a<-table.start()
a<-table.row.start(a)
a<-table.element(a,'Meta Analysis of Goldfeld-Quandt test for Heteroskedasticity',4,TRUE)
a<-table.row.end(a)
a<-table.row.start(a)
a<-table.element(a,'Description',header=TRUE)
a<-table.element(a,'# significant tests',header=TRUE)
a<-table.element(a,'% significant tests',header=TRUE)
a<-table.element(a,'OK/NOK',header=TRUE)
a<-table.row.end(a)
a<-table.row.start(a)
a<-table.element(a,'1% type I error level',header=TRUE)
a<-table.element(a,numsignificant1)
a<-table.element(a,numsignificant1/numgqtests)
if (numsignificant1/numgqtests < 0.01) dum <- 'OK' else dum <- 'NOK'
a<-table.element(a,dum)
a<-table.row.end(a)
a<-table.row.start(a)
a<-table.element(a,'5% type I error level',header=TRUE)
a<-table.element(a,numsignificant5)
a<-table.element(a,numsignificant5/numgqtests)
if (numsignificant5/numgqtests < 0.05) dum <- 'OK' else dum <- 'NOK'
a<-table.element(a,dum)
a<-table.row.end(a)
a<-table.row.start(a)
a<-table.element(a,'10% type I error level',header=TRUE)
a<-table.element(a,numsignificant10)
a<-table.element(a,numsignificant10/numgqtests)
if (numsignificant10/numgqtests < 0.1) dum <- 'OK' else dum <- 'NOK'
a<-table.element(a,dum)
a<-table.row.end(a)
a<-table.end(a)
table.save(a,file='mytable6.tab')
}