Free Statistics

of Irreproducible Research!

Author's title

Author*The author of this computation has been verified*
R Software Modulerwasp_exponentialsmoothing.wasp
Title produced by softwareExponential Smoothing
Date of computationSat, 18 Dec 2010 18:11:45 +0000
Cite this page as followsStatistical Computations at FreeStatistics.org, Office for Research Development and Education, URL https://freestatistics.org/blog/index.php?v=date/2010/Dec/18/t12926959171ct7vikjn46mj3p.htm/, Retrieved Tue, 30 Apr 2024 05:37:56 +0000
Statistical Computations at FreeStatistics.org, Office for Research Development and Education, URL https://freestatistics.org/blog/index.php?pk=112143, Retrieved Tue, 30 Apr 2024 05:37:56 +0000
QR Codes:

Original text written by user:
IsPrivate?No (this computation is public)
User-defined keywords
Estimated Impact186
Family? (F = Feedback message, R = changed R code, M = changed R Module, P = changed Parameters, D = changed Data)
-     [Univariate Data Series] [data set] [2008-12-01 19:54:57] [b98453cac15ba1066b407e146608df68]
- RMP   [(Partial) Autocorrelation Function] [Workshop 8 Autoco...] [2010-11-28 16:39:23] [945bcebba5e7ac34a41d6888338a1ba9]
- RMP     [Classical Decomposition] [workshop 8 Klassi...] [2010-11-28 17:01:52] [945bcebba5e7ac34a41d6888338a1ba9]
- RMPD        [Exponential Smoothing] [Paper TSA Exponen...] [2010-12-18 18:11:45] [514029464b0621595fe21c9fa38c7009] [Current]
- RMP           [Spectral Analysis] [Paper TSA Spectra...] [2010-12-18 18:30:58] [945bcebba5e7ac34a41d6888338a1ba9]
- RMP           [Multiple Regression] [Paper TSA MR Fail...] [2010-12-18 19:23:16] [945bcebba5e7ac34a41d6888338a1ba9]
- RMPD          [Multiple Regression] [Paper TSA MR Fail...] [2010-12-18 19:33:04] [945bcebba5e7ac34a41d6888338a1ba9]
Feedback Forum

Post a new message
Dataseries X:
67
189
342
432
517
623
605
716
677
710
839
886
891
917
820
793
932
906
844
801
957
1159
1264
1097
1240
1411
1535
1862
1894
2239
2465
2423
2692
2856
3450
4162
4260
4225
4092
4160
3896
3628
3754
3749
3907
4449
5272
6197
6446
7157
7559
7674
6929
7156
6805
7095
7222
7593
7910


Summary of computational transaction
Raw Inputview raw input (R code)
Raw Outputview raw output of R engine
Computing time3 seconds
R Server'George Udny Yule' @ 72.249.76.132

\begin{tabular}{lllllllll}
\hline
Summary of computational transaction \tabularnewline
Raw Input & view raw input (R code)  \tabularnewline
Raw Output & view raw output of R engine  \tabularnewline
Computing time & 3 seconds \tabularnewline
R Server & 'George Udny Yule' @ 72.249.76.132 \tabularnewline
\hline
\end{tabular}
%Source: https://freestatistics.org/blog/index.php?pk=112143&T=0

[TABLE]
[ROW][C]Summary of computational transaction[/C][/ROW]
[ROW][C]Raw Input[/C][C]view raw input (R code) [/C][/ROW]
[ROW][C]Raw Output[/C][C]view raw output of R engine [/C][/ROW]
[ROW][C]Computing time[/C][C]3 seconds[/C][/ROW]
[ROW][C]R Server[/C][C]'George Udny Yule' @ 72.249.76.132[/C][/ROW]
[/TABLE]
Source: https://freestatistics.org/blog/index.php?pk=112143&T=0

Globally Unique Identifier (entire table): ba.freestatistics.org/blog/index.php?pk=112143&T=0

As an alternative you can also use a QR Code:  

The GUIDs for individual cells are displayed in the table below:

Summary of computational transaction
Raw Inputview raw input (R code)
Raw Outputview raw output of R engine
Computing time3 seconds
R Server'George Udny Yule' @ 72.249.76.132


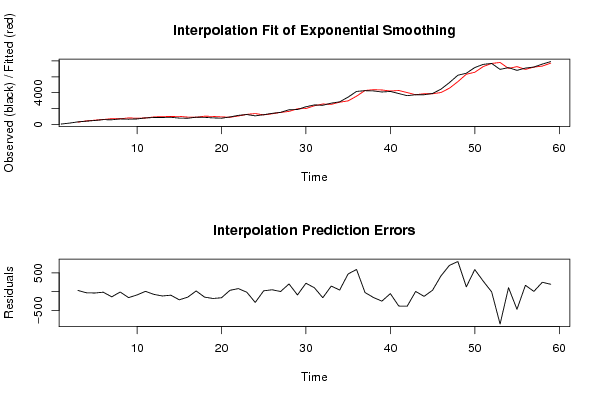
Estimated Parameters of Exponential Smoothing
ParameterValue
alpha1
beta0
gammaFALSE

\begin{tabular}{lllllllll}
\hline
Estimated Parameters of Exponential Smoothing \tabularnewline
Parameter & Value \tabularnewline
alpha & 1 \tabularnewline
beta & 0 \tabularnewline
gamma & FALSE \tabularnewline
\hline
\end{tabular}
%Source: https://freestatistics.org/blog/index.php?pk=112143&T=1

[TABLE]
[ROW][C]Estimated Parameters of Exponential Smoothing[/C][/ROW]
[ROW][C]Parameter[/C][C]Value[/C][/ROW]
[ROW][C]alpha[/C][C]1[/C][/ROW]
[ROW][C]beta[/C][C]0[/C][/ROW]
[ROW][C]gamma[/C][C]FALSE[/C][/ROW]
[/TABLE]
Source: https://freestatistics.org/blog/index.php?pk=112143&T=1

Globally Unique Identifier (entire table): ba.freestatistics.org/blog/index.php?pk=112143&T=1

As an alternative you can also use a QR Code:  

The GUIDs for individual cells are displayed in the table below:

Estimated Parameters of Exponential Smoothing
ParameterValue
alpha1
beta0
gammaFALSE


Interpolation Forecasts of Exponential Smoothing
tObservedFittedResiduals
334231131
4432464-32
5517554-37
6623639-16
7605745-140
8716727-11
9677838-161
10710799-89
118398327
12886961-75
138911008-117
149171013-96
158201039-219
16793942-149
1793291517
189061054-148
198441028-184
20801966-165
2195792334
221159107980
2312641281-17
2410971386-289
251240121921
261411136249
27153515332
2818621657205
2918941984-90
3022392016223
3124652361104
3224232587-164
3326922545147
342856281442
3534502978472
3641623572590
3742604284-24
3842254382-157
3940924347-255
4041604214-54
4138964282-386
4236284018-390
43375437504
4437493876-127
453907387136
4644494029420
4752724571701
4861975394803
4964466319127
5071576568589
5175597279280
5276747681-7
5369297796-867
5471567051105
5568057278-473
5670956927168
57722272175
5875937344249
5979107715195

\begin{tabular}{lllllllll}
\hline
Interpolation Forecasts of Exponential Smoothing \tabularnewline
t & Observed & Fitted & Residuals \tabularnewline
3 & 342 & 311 & 31 \tabularnewline
4 & 432 & 464 & -32 \tabularnewline
5 & 517 & 554 & -37 \tabularnewline
6 & 623 & 639 & -16 \tabularnewline
7 & 605 & 745 & -140 \tabularnewline
8 & 716 & 727 & -11 \tabularnewline
9 & 677 & 838 & -161 \tabularnewline
10 & 710 & 799 & -89 \tabularnewline
11 & 839 & 832 & 7 \tabularnewline
12 & 886 & 961 & -75 \tabularnewline
13 & 891 & 1008 & -117 \tabularnewline
14 & 917 & 1013 & -96 \tabularnewline
15 & 820 & 1039 & -219 \tabularnewline
16 & 793 & 942 & -149 \tabularnewline
17 & 932 & 915 & 17 \tabularnewline
18 & 906 & 1054 & -148 \tabularnewline
19 & 844 & 1028 & -184 \tabularnewline
20 & 801 & 966 & -165 \tabularnewline
21 & 957 & 923 & 34 \tabularnewline
22 & 1159 & 1079 & 80 \tabularnewline
23 & 1264 & 1281 & -17 \tabularnewline
24 & 1097 & 1386 & -289 \tabularnewline
25 & 1240 & 1219 & 21 \tabularnewline
26 & 1411 & 1362 & 49 \tabularnewline
27 & 1535 & 1533 & 2 \tabularnewline
28 & 1862 & 1657 & 205 \tabularnewline
29 & 1894 & 1984 & -90 \tabularnewline
30 & 2239 & 2016 & 223 \tabularnewline
31 & 2465 & 2361 & 104 \tabularnewline
32 & 2423 & 2587 & -164 \tabularnewline
33 & 2692 & 2545 & 147 \tabularnewline
34 & 2856 & 2814 & 42 \tabularnewline
35 & 3450 & 2978 & 472 \tabularnewline
36 & 4162 & 3572 & 590 \tabularnewline
37 & 4260 & 4284 & -24 \tabularnewline
38 & 4225 & 4382 & -157 \tabularnewline
39 & 4092 & 4347 & -255 \tabularnewline
40 & 4160 & 4214 & -54 \tabularnewline
41 & 3896 & 4282 & -386 \tabularnewline
42 & 3628 & 4018 & -390 \tabularnewline
43 & 3754 & 3750 & 4 \tabularnewline
44 & 3749 & 3876 & -127 \tabularnewline
45 & 3907 & 3871 & 36 \tabularnewline
46 & 4449 & 4029 & 420 \tabularnewline
47 & 5272 & 4571 & 701 \tabularnewline
48 & 6197 & 5394 & 803 \tabularnewline
49 & 6446 & 6319 & 127 \tabularnewline
50 & 7157 & 6568 & 589 \tabularnewline
51 & 7559 & 7279 & 280 \tabularnewline
52 & 7674 & 7681 & -7 \tabularnewline
53 & 6929 & 7796 & -867 \tabularnewline
54 & 7156 & 7051 & 105 \tabularnewline
55 & 6805 & 7278 & -473 \tabularnewline
56 & 7095 & 6927 & 168 \tabularnewline
57 & 7222 & 7217 & 5 \tabularnewline
58 & 7593 & 7344 & 249 \tabularnewline
59 & 7910 & 7715 & 195 \tabularnewline
\hline
\end{tabular}
%Source: https://freestatistics.org/blog/index.php?pk=112143&T=2

[TABLE]
[ROW][C]Interpolation Forecasts of Exponential Smoothing[/C][/ROW]
[ROW][C]t[/C][C]Observed[/C][C]Fitted[/C][C]Residuals[/C][/ROW]
[ROW][C]3[/C][C]342[/C][C]311[/C][C]31[/C][/ROW]
[ROW][C]4[/C][C]432[/C][C]464[/C][C]-32[/C][/ROW]
[ROW][C]5[/C][C]517[/C][C]554[/C][C]-37[/C][/ROW]
[ROW][C]6[/C][C]623[/C][C]639[/C][C]-16[/C][/ROW]
[ROW][C]7[/C][C]605[/C][C]745[/C][C]-140[/C][/ROW]
[ROW][C]8[/C][C]716[/C][C]727[/C][C]-11[/C][/ROW]
[ROW][C]9[/C][C]677[/C][C]838[/C][C]-161[/C][/ROW]
[ROW][C]10[/C][C]710[/C][C]799[/C][C]-89[/C][/ROW]
[ROW][C]11[/C][C]839[/C][C]832[/C][C]7[/C][/ROW]
[ROW][C]12[/C][C]886[/C][C]961[/C][C]-75[/C][/ROW]
[ROW][C]13[/C][C]891[/C][C]1008[/C][C]-117[/C][/ROW]
[ROW][C]14[/C][C]917[/C][C]1013[/C][C]-96[/C][/ROW]
[ROW][C]15[/C][C]820[/C][C]1039[/C][C]-219[/C][/ROW]
[ROW][C]16[/C][C]793[/C][C]942[/C][C]-149[/C][/ROW]
[ROW][C]17[/C][C]932[/C][C]915[/C][C]17[/C][/ROW]
[ROW][C]18[/C][C]906[/C][C]1054[/C][C]-148[/C][/ROW]
[ROW][C]19[/C][C]844[/C][C]1028[/C][C]-184[/C][/ROW]
[ROW][C]20[/C][C]801[/C][C]966[/C][C]-165[/C][/ROW]
[ROW][C]21[/C][C]957[/C][C]923[/C][C]34[/C][/ROW]
[ROW][C]22[/C][C]1159[/C][C]1079[/C][C]80[/C][/ROW]
[ROW][C]23[/C][C]1264[/C][C]1281[/C][C]-17[/C][/ROW]
[ROW][C]24[/C][C]1097[/C][C]1386[/C][C]-289[/C][/ROW]
[ROW][C]25[/C][C]1240[/C][C]1219[/C][C]21[/C][/ROW]
[ROW][C]26[/C][C]1411[/C][C]1362[/C][C]49[/C][/ROW]
[ROW][C]27[/C][C]1535[/C][C]1533[/C][C]2[/C][/ROW]
[ROW][C]28[/C][C]1862[/C][C]1657[/C][C]205[/C][/ROW]
[ROW][C]29[/C][C]1894[/C][C]1984[/C][C]-90[/C][/ROW]
[ROW][C]30[/C][C]2239[/C][C]2016[/C][C]223[/C][/ROW]
[ROW][C]31[/C][C]2465[/C][C]2361[/C][C]104[/C][/ROW]
[ROW][C]32[/C][C]2423[/C][C]2587[/C][C]-164[/C][/ROW]
[ROW][C]33[/C][C]2692[/C][C]2545[/C][C]147[/C][/ROW]
[ROW][C]34[/C][C]2856[/C][C]2814[/C][C]42[/C][/ROW]
[ROW][C]35[/C][C]3450[/C][C]2978[/C][C]472[/C][/ROW]
[ROW][C]36[/C][C]4162[/C][C]3572[/C][C]590[/C][/ROW]
[ROW][C]37[/C][C]4260[/C][C]4284[/C][C]-24[/C][/ROW]
[ROW][C]38[/C][C]4225[/C][C]4382[/C][C]-157[/C][/ROW]
[ROW][C]39[/C][C]4092[/C][C]4347[/C][C]-255[/C][/ROW]
[ROW][C]40[/C][C]4160[/C][C]4214[/C][C]-54[/C][/ROW]
[ROW][C]41[/C][C]3896[/C][C]4282[/C][C]-386[/C][/ROW]
[ROW][C]42[/C][C]3628[/C][C]4018[/C][C]-390[/C][/ROW]
[ROW][C]43[/C][C]3754[/C][C]3750[/C][C]4[/C][/ROW]
[ROW][C]44[/C][C]3749[/C][C]3876[/C][C]-127[/C][/ROW]
[ROW][C]45[/C][C]3907[/C][C]3871[/C][C]36[/C][/ROW]
[ROW][C]46[/C][C]4449[/C][C]4029[/C][C]420[/C][/ROW]
[ROW][C]47[/C][C]5272[/C][C]4571[/C][C]701[/C][/ROW]
[ROW][C]48[/C][C]6197[/C][C]5394[/C][C]803[/C][/ROW]
[ROW][C]49[/C][C]6446[/C][C]6319[/C][C]127[/C][/ROW]
[ROW][C]50[/C][C]7157[/C][C]6568[/C][C]589[/C][/ROW]
[ROW][C]51[/C][C]7559[/C][C]7279[/C][C]280[/C][/ROW]
[ROW][C]52[/C][C]7674[/C][C]7681[/C][C]-7[/C][/ROW]
[ROW][C]53[/C][C]6929[/C][C]7796[/C][C]-867[/C][/ROW]
[ROW][C]54[/C][C]7156[/C][C]7051[/C][C]105[/C][/ROW]
[ROW][C]55[/C][C]6805[/C][C]7278[/C][C]-473[/C][/ROW]
[ROW][C]56[/C][C]7095[/C][C]6927[/C][C]168[/C][/ROW]
[ROW][C]57[/C][C]7222[/C][C]7217[/C][C]5[/C][/ROW]
[ROW][C]58[/C][C]7593[/C][C]7344[/C][C]249[/C][/ROW]
[ROW][C]59[/C][C]7910[/C][C]7715[/C][C]195[/C][/ROW]
[/TABLE]
Source: https://freestatistics.org/blog/index.php?pk=112143&T=2

Globally Unique Identifier (entire table): ba.freestatistics.org/blog/index.php?pk=112143&T=2

As an alternative you can also use a QR Code:  

The GUIDs for individual cells are displayed in the table below:

Interpolation Forecasts of Exponential Smoothing
tObservedFittedResiduals
334231131
4432464-32
5517554-37
6623639-16
7605745-140
8716727-11
9677838-161
10710799-89
118398327
12886961-75
138911008-117
149171013-96
158201039-219
16793942-149
1793291517
189061054-148
198441028-184
20801966-165
2195792334
221159107980
2312641281-17
2410971386-289
251240121921
261411136249
27153515332
2818621657205
2918941984-90
3022392016223
3124652361104
3224232587-164
3326922545147
342856281442
3534502978472
3641623572590
3742604284-24
3842254382-157
3940924347-255
4041604214-54
4138964282-386
4236284018-390
43375437504
4437493876-127
453907387136
4644494029420
4752724571701
4861975394803
4964466319127
5071576568589
5175597279280
5276747681-7
5369297796-867
5471567051105
5568057278-473
5670956927168
57722272175
5875937344249
5979107715195


Extrapolation Forecasts of Exponential Smoothing
tForecast95% Lower Bound95% Upper Bound
6080327486.656333173568577.34366682644

\begin{tabular}{lllllllll}
\hline
Extrapolation Forecasts of Exponential Smoothing \tabularnewline
t & Forecast & 95% Lower Bound & 95% Upper Bound \tabularnewline
60 & 8032 & 7486.65633317356 & 8577.34366682644 \tabularnewline
\hline
\end{tabular}
%Source: https://freestatistics.org/blog/index.php?pk=112143&T=3

[TABLE]
[ROW][C]Extrapolation Forecasts of Exponential Smoothing[/C][/ROW]
[ROW][C]t[/C][C]Forecast[/C][C]95% Lower Bound[/C][C]95% Upper Bound[/C][/ROW]
[ROW][C]60[/C][C]8032[/C][C]7486.65633317356[/C][C]8577.34366682644[/C][/ROW]
[/TABLE]
Source: https://freestatistics.org/blog/index.php?pk=112143&T=3

Globally Unique Identifier (entire table): ba.freestatistics.org/blog/index.php?pk=112143&T=3

As an alternative you can also use a QR Code:  

The GUIDs for individual cells are displayed in the table below:

Extrapolation Forecasts of Exponential Smoothing
tForecast95% Lower Bound95% Upper Bound
6080327486.656333173568577.34366682644


Parameters (Session):
par1 = 1 ; par2 = Double ; par3 = additive ;
Parameters (R input):
par1 = 1 ; par2 = Double ; par3 = additive ;
R code (references can be found in the software module):
par1 <- as.numeric(par1)
if (par2 == 'Single') K <- 1
if (par2 == 'Double') K <- 2
if (par2 == 'Triple') K <- par1
nx <- length(x)
nxmK <- nx - K
x <- ts(x, frequency = par1)
if (par2 == 'Single') fit <- HoltWinters(x, gamma=F, beta=F)
if (par2 == 'Double') fit <- HoltWinters(x, gamma=F)
if (par2 == 'Triple') fit <- HoltWinters(x, seasonal=par3)
fit
myresid <- x - fit$fitted[,'xhat']
bitmap(file='test1.png')
op <- par(mfrow=c(2,1))
plot(fit,ylab='Observed (black) / Fitted (red)',main='Interpolation Fit of Exponential Smoothing')
plot(myresid,ylab='Residuals',main='Interpolation Prediction Errors')
par(op)
dev.off()
bitmap(file='test2.png')
p <- predict(fit, par1, prediction.interval=TRUE)
np <- length(p[,1])
plot(fit,p,ylab='Observed (black) / Fitted (red)',main='Extrapolation Fit of Exponential Smoothing')
dev.off()
bitmap(file='test3.png')
op <- par(mfrow = c(2,2))
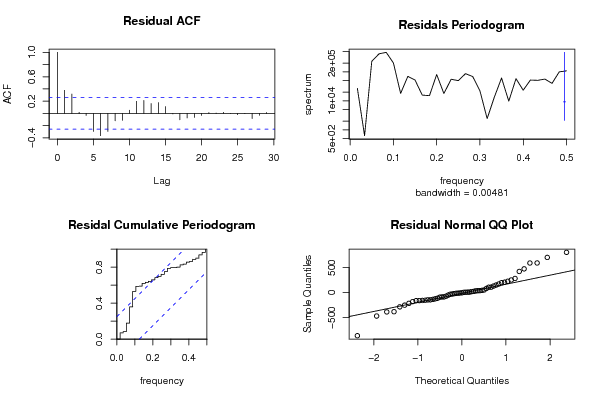
acf(as.numeric(myresid),lag.max = nx/2,main='Residual ACF')
spectrum(myresid,main='Residals Periodogram')
cpgram(myresid,main='Residal Cumulative Periodogram')
qqnorm(myresid,main='Residual Normal QQ Plot')
qqline(myresid)
par(op)
dev.off()
load(file='createtable')
a<-table.start()
a<-table.row.start(a)
a<-table.element(a,'Estimated Parameters of Exponential Smoothing',2,TRUE)
a<-table.row.end(a)
a<-table.row.start(a)
a<-table.element(a,'Parameter',header=TRUE)
a<-table.element(a,'Value',header=TRUE)
a<-table.row.end(a)
a<-table.row.start(a)
a<-table.element(a,'alpha',header=TRUE)
a<-table.element(a,fit$alpha)
a<-table.row.end(a)
a<-table.row.start(a)
a<-table.element(a,'beta',header=TRUE)
a<-table.element(a,fit$beta)
a<-table.row.end(a)
a<-table.row.start(a)
a<-table.element(a,'gamma',header=TRUE)
a<-table.element(a,fit$gamma)
a<-table.row.end(a)
a<-table.end(a)
table.save(a,file='mytable.tab')
a<-table.start()
a<-table.row.start(a)
a<-table.element(a,'Interpolation Forecasts of Exponential Smoothing',4,TRUE)
a<-table.row.end(a)
a<-table.row.start(a)
a<-table.element(a,'t',header=TRUE)
a<-table.element(a,'Observed',header=TRUE)
a<-table.element(a,'Fitted',header=TRUE)
a<-table.element(a,'Residuals',header=TRUE)
a<-table.row.end(a)
for (i in 1:nxmK) {
a<-table.row.start(a)
a<-table.element(a,i+K,header=TRUE)
a<-table.element(a,x[i+K])
a<-table.element(a,fit$fitted[i,'xhat'])
a<-table.element(a,myresid[i])
a<-table.row.end(a)
}
a<-table.end(a)
table.save(a,file='mytable1.tab')
a<-table.start()
a<-table.row.start(a)
a<-table.element(a,'Extrapolation Forecasts of Exponential Smoothing',4,TRUE)
a<-table.row.end(a)
a<-table.row.start(a)
a<-table.element(a,'t',header=TRUE)
a<-table.element(a,'Forecast',header=TRUE)
a<-table.element(a,'95% Lower Bound',header=TRUE)
a<-table.element(a,'95% Upper Bound',header=TRUE)
a<-table.row.end(a)
for (i in 1:np) {
a<-table.row.start(a)
a<-table.element(a,nx+i,header=TRUE)
a<-table.element(a,p[i,'fit'])
a<-table.element(a,p[i,'lwr'])
a<-table.element(a,p[i,'upr'])
a<-table.row.end(a)
}
a<-table.end(a)
table.save(a,file='mytable2.tab')