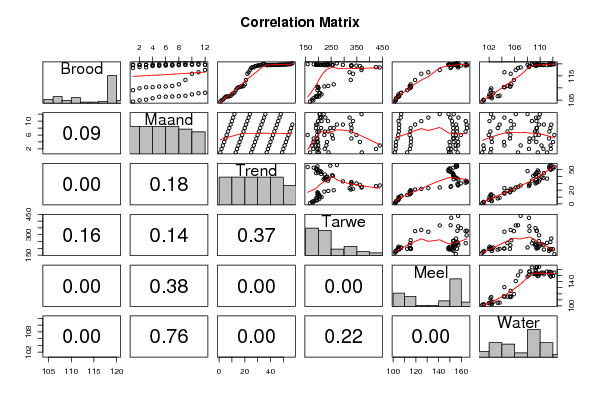
| Correlations for all pairs of data series (method=kendall) | ||||||
| Brood | Maand | Trend | Tarwe | Meel | Water | |
| Brood | 1 | 0.162 | 0.901 | 0.129 | 0.614 | 0.78 |
| Maand | 0.162 | 1 | 0.125 | 0.14 | 0.083 | 0.029 |
| Trend | 0.901 | 0.125 | 1 | 0.081 | 0.539 | 0.807 |
| Tarwe | 0.129 | 0.14 | 0.081 | 1 | 0.405 | 0.112 |
| Meel | 0.614 | 0.083 | 0.539 | 0.405 | 1 | 0.589 |
| Water | 0.78 | 0.029 | 0.807 | 0.112 | 0.589 | 1 |
| Correlations for all pairs of data series with p-values | |||
| pair | Pearson r | Spearman rho | Kendall tau |
| Brood;Maand | 0.1039 | 0.1766 | 0.1617 |
| p-value | (0.4418) | (0.1889) | (0.0852) |
| Brood;Trend | 0.903 | 0.9589 | 0.9012 |
| p-value | (0) | (0) | (0) |
| Brood;Tarwe | 0.3831 | 0.1971 | 0.1286 |
| p-value | (0.0033) | (0.1417) | (0.1582) |
| Brood;Meel | 0.9736 | 0.7739 | 0.614 |
| p-value | (0) | (0) | (0) |
| Brood;Water | 0.9369 | 0.9189 | 0.7796 |
| p-value | (0) | (0) | (0) |
| Maand;Trend | 0.0973 | 0.0996 | 0.1246 |
| p-value | (0.4714) | (0.4609) | (0.1844) |
| Maand;Tarwe | 0.0526 | 0.2048 | 0.1402 |
| p-value | (0.6976) | (0.1264) | (0.1354) |
| Maand;Meel | 0.0495 | 0.0968 | 0.0831 |
| p-value | (0.7144) | (0.4737) | (0.3762) |
| Maand;Water | 0.0391 | 0.0275 | 0.0286 |
| p-value | (0.7728) | (0.8392) | (0.761) |
| Trend;Tarwe | 0.0367 | 0.1508 | 0.0815 |
| p-value | (0.7862) | (0.2621) | (0.3708) |
| Trend;Meel | 0.8495 | 0.7166 | 0.5388 |
| p-value | (0) | (0) | (0) |
| Trend;Water | 0.9508 | 0.9389 | 0.807 |
| p-value | (0) | (0) | (0) |
| Tarwe;Meel | 0.4034 | 0.5545 | 0.4048 |
| p-value | (0.0019) | (0) | (0) |
| Tarwe;Water | 0.1617 | 0.1646 | 0.1115 |
| p-value | (0.2295) | (0.2203) | (0.2205) |
| Meel;Water | 0.9174 | 0.7696 | 0.589 |
| p-value | (0) | (0) | (0) |