| Multiple Linear Regression - Estimated Regression Equation |
| Werklozen[t] = + 7083.61427550935 + 27769.2857221576Oliecrisis[t] + 1.4167263043587Y1[t] -0.534958190946436Y2[t] + 496.549472685872t + e[t] |
| Multiple Linear Regression - Ordinary Least Squares | |||||
| Variable | Parameter | S.D. | T-STAT H0: parameter = 0 | 2-tail p-value | 1-tail p-value |
| (Intercept) | 7083.61427550935 | 8192.613703 | 0.8646 | 0.391211 | 0.195605 |
| Oliecrisis | 27769.2857221576 | 15843.559631 | 1.7527 | 0.085545 | 0.042772 |
| Y1 | 1.4167263043587 | 0.117032 | 12.1054 | 0 | 0 |
| Y2 | -0.534958190946436 | 0.113884 | -4.6974 | 2e-05 | 1e-05 |
| t | 496.549472685872 | 543.794121 | 0.9131 | 0.365394 | 0.182697 |
| Multiple Linear Regression - Regression Statistics | |
| Multiple R | 0.98987994432335 |
| R-squared | 0.979862304173597 |
| Adjusted R-squared | 0.978313250648489 |
| F-TEST (value) | 632.555485198821 |
| F-TEST (DF numerator) | 4 |
| F-TEST (DF denominator) | 52 |
| p-value | 0 |
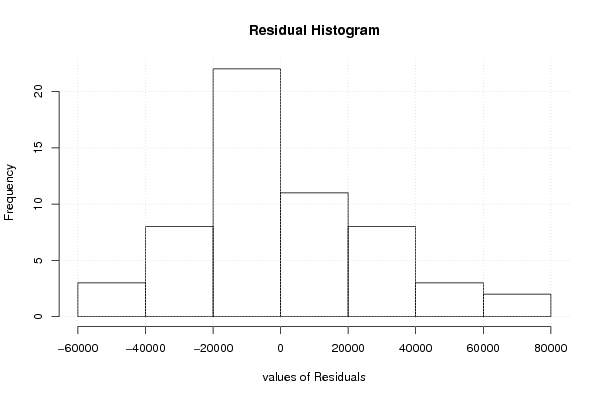
| Multiple Linear Regression - Residual Statistics | |
| Residual Standard Deviation | 27974.9745735618 |
| Sum Squared Residuals | 40695158524.3543 |
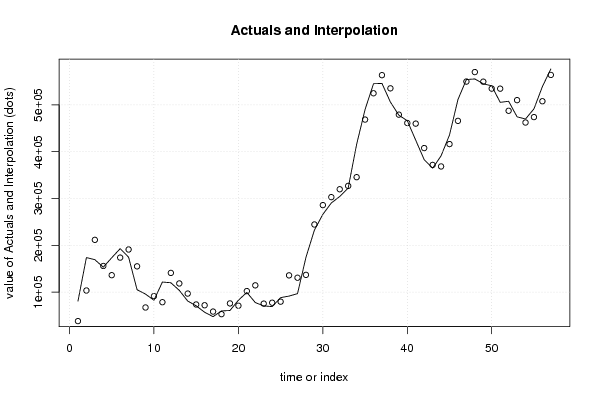
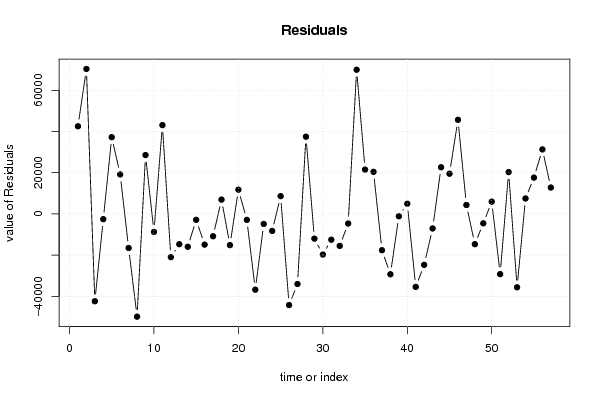
| Multiple Linear Regression - Actuals, Interpolation, and Residuals | |||
| Time or Index | Actuals | Interpolation Forecast | Residuals Prediction Error |
| 1 | 80900 | 38382.6545756303 | 42517.3454243697 |
| 2 | 174000 | 103645.359645806 | 70354.6403541936 |
| 3 | 169422 | 211805.522004414 | -42383.5220044136 |
| 4 | 153452 | 156011.690878632 | -2559.69087863203 |
| 5 | 173570 | 136332.159868862 | 37237.8401311377 |
| 6 | 193036 | 173873.691442051 | 19162.3085579491 |
| 7 | 174652 | 191185.946269923 | -16533.9462699228 |
| 8 | 105367 | 155223.903218315 | -49856.9032183151 |
| 9 | 95963 | 67397.242075868 | 28565.757924132 |
| 10 | 82896 | 91635.4756420885 | -8739.47564208845 |
| 11 | 121747 | 78650.4093233795 | 43096.5906766205 |
| 12 | 120196 | 141178.491127802 | -20982.4911278022 |
| 13 | 103983 | 118694.037425968 | -14711.0374259677 |
| 14 | 81103 | 97050.923480244 | -15947.923480244 |
| 15 | 70944 | 73806.0522590175 | -2862.05225901745 |
| 16 | 57248 | 72149.9226145778 | -14901.9226145778 |
| 17 | 47830 | 58677.6288845918 | -10847.6288845918 |
| 18 | 60095 | 53158.2374060298 | 6936.76259397016 |
| 19 | 60931 | 76069.1712440086 | -15138.1712440086 |
| 20 | 82955 | 71188.8416951804 | 11766.1583048196 |
| 21 | 99559 | 102440.146247431 | -2881.14624743093 |
| 22 | 77911 | 114678.100080284 | -36767.1000802843 |
| 23 | 70753 | 75622.9127137385 | -4869.9127137385 |
| 24 | 69287 | 77559.3102174333 | -8272.31021743326 |
| 25 | 88426 | 79808.1696587239 | 8617.83034127613 |
| 26 | 91756 | 135972.978300616 | -44216.9783006159 |
| 27 | 96933 | 130948.661550292 | -34015.6615502924 |
| 28 | 174484 | 136998.192324792 | 37485.8076752084 |
| 29 | 232595 | 244593.804872269 | -11998.8048722691 |
| 30 | 266197 | 285931.193951456 | -19734.1939514561 |
| 31 | 290435 | 302945.625269115 | -12510.6252691146 |
| 32 | 304296 | 319805.121774664 | -15509.1217746644 |
| 33 | 322310 | 326972.597919906 | -4662.59791990642 |
| 34 | 415555 | 345574.999554601 | 69980.0004453987 |
| 35 | 490042 | 468537.456425505 | 21504.5435744953 |
| 36 | 545109 | 524679.521616156 | 20429.4783838436 |
| 37 | 545720 | 563343.507721936 | -17623.5077219355 |
| 38 | 505944 | 535247.134265737 | -29303.1342657372 |
| 39 | 477930 | 479065.118801583 | -1135.11880158323 |
| 40 | 466106 | 461151.99458705 | 4954.00541294999 |
| 41 | 424476 | 459883.490998172 | -35407.4909981721 |
| 42 | 383018 | 407727.070070156 | -24709.0700701561 |
| 43 | 364696 | 371759.289905839 | -7063.28990583926 |
| 44 | 391116 | 368476.876710322 | 22639.1232896775 |
| 45 | 435721 | 416204.839118686 | 19516.1608813144 |
| 46 | 511435 | 465760.869992486 | 45674.1300075137 |
| 47 | 553997 | 549661.624766221 | 4335.37523377918 |
| 48 | 555252 | 569953.054735703 | -14701.0547357031 |
| 49 | 544897 | 549458.705197297 | -4561.70519729692 |
| 50 | 540562 | 534613.681258711 | 5948.31874128929 |
| 51 | 505282 | 534508.214269252 | -29226.214269252 |
| 52 | 507626 | 487341.703481916 | 20284.2965180842 |
| 53 | 474427 | 510032.384388609 | -35605.3843886088 |
| 54 | 469740 | 462241.095283312 | 7498.90471668822 |
| 55 | 491480 | 473857.525548699 | 17622.4744513008 |
| 56 | 538974 | 507661.053919109 | 31312.946080891 |
| 57 | 576612 | 563813.611419831 | 12798.3885801686 |
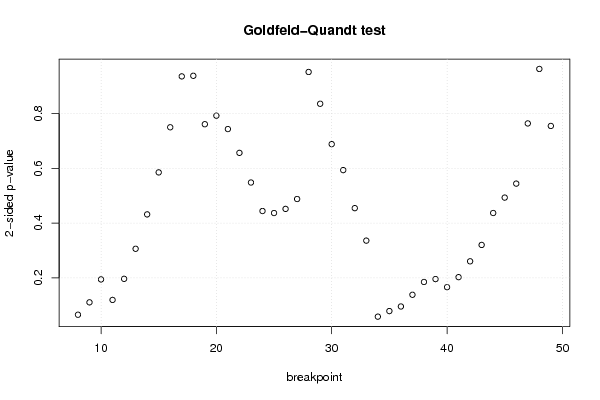
| Goldfeld-Quandt test for Heteroskedasticity | |||
| p-values | Alternative Hypothesis | ||
| breakpoint index | greater | 2-sided | less |
| 8 | 0.967434744052645 | 0.0651305118947108 | 0.0325652559473554 |
| 9 | 0.944716954249692 | 0.110566091500615 | 0.0552830457503077 |
| 10 | 0.902835789201305 | 0.194328421597389 | 0.0971642107986946 |
| 11 | 0.940339767679382 | 0.119320464641236 | 0.059660232320618 |
| 12 | 0.901793301277447 | 0.196413397445107 | 0.0982066987225533 |
| 13 | 0.846833094253594 | 0.306333811492813 | 0.153166905746406 |
| 14 | 0.783974329212371 | 0.432051341575258 | 0.216025670787629 |
| 15 | 0.70721587986908 | 0.58556824026184 | 0.29278412013092 |
| 16 | 0.624741344727038 | 0.750517310545923 | 0.375258655272962 |
| 17 | 0.531702664624254 | 0.93659467075149 | 0.468297335375746 |
| 18 | 0.469373220514758 | 0.938746441029516 | 0.530626779485242 |
| 19 | 0.380838642421468 | 0.761677284842936 | 0.619161357578532 |
| 20 | 0.396456733048555 | 0.79291346609711 | 0.603543266951445 |
| 21 | 0.371997118934601 | 0.743994237869203 | 0.628002881065398 |
| 22 | 0.328490266421923 | 0.656980532843846 | 0.671509733578077 |
| 23 | 0.274293169788899 | 0.548586339577799 | 0.7257068302111 |
| 24 | 0.222181152098503 | 0.444362304197007 | 0.777818847901497 |
| 25 | 0.218514837573294 | 0.437029675146588 | 0.781485162426706 |
| 26 | 0.226075100262203 | 0.452150200524406 | 0.773924899737797 |
| 27 | 0.244119967042079 | 0.488239934084158 | 0.755880032957921 |
| 28 | 0.523651113170127 | 0.952697773659745 | 0.476348886829873 |
| 29 | 0.581747452133156 | 0.836505095733689 | 0.418252547866844 |
| 30 | 0.655575879700743 | 0.688848240598514 | 0.344424120299257 |
| 31 | 0.703025724575458 | 0.593948550849083 | 0.296974275424542 |
| 32 | 0.77257276420426 | 0.454854471591481 | 0.22742723579574 |
| 33 | 0.831958322872523 | 0.336083354254954 | 0.168041677127477 |
| 34 | 0.97092508323519 | 0.058149833529621 | 0.0290749167648105 |
| 35 | 0.96073327906353 | 0.0785334418729417 | 0.0392667209364709 |
| 36 | 0.95232411653756 | 0.0953517669248803 | 0.0476758834624402 |
| 37 | 0.93090423124333 | 0.138191537513338 | 0.069095768756669 |
| 38 | 0.907537486815976 | 0.184925026368048 | 0.092462513184024 |
| 39 | 0.902247423366494 | 0.195505153267013 | 0.0977525766335064 |
| 40 | 0.916994477754744 | 0.166011044490512 | 0.0830055222452562 |
| 41 | 0.898717531550639 | 0.202564936898722 | 0.101282468449361 |
| 42 | 0.86975484517215 | 0.2604903096557 | 0.13024515482785 |
| 43 | 0.83980804953527 | 0.320383900929461 | 0.16019195046473 |
| 44 | 0.78144444859969 | 0.437111102800621 | 0.21855555140031 |
| 45 | 0.753285540732256 | 0.493428918535488 | 0.246714459267744 |
| 46 | 0.727729750252766 | 0.544540499494468 | 0.272270249747234 |
| 47 | 0.61771412913857 | 0.76457174172286 | 0.38228587086143 |
| 48 | 0.481885241540889 | 0.963770483081778 | 0.518114758459111 |
| 49 | 0.377650007925931 | 0.755300015851862 | 0.622349992074069 |
| Meta Analysis of Goldfeld-Quandt test for Heteroskedasticity | |||
| Description | # significant tests | % significant tests | OK/NOK |
| 1% type I error level | 0 | 0 | OK |
| 5% type I error level | 0 | 0 | OK |
| 10% type I error level | 4 | 0.0952380952380952 | OK |