| Multiple Linear Regression - Estimated Regression Equation |
| cultuurbesteding[t] = + 100.675 -0.0901666666666308M1[t] -0.0353333333333356M2[t] -0.298500000000003M3[t] -0.109666666666670M4[t] -0.394833333333334M5[t] -0.384000000000005M6[t] -0.543166666666667M7[t] -0.488333333333337M8[t] + 0.514500000000001M9[t] + 0.391333333333330M10[t] + 0.148166666666668M11[t] + 0.327166666666666t + e[t] |
| Multiple Linear Regression - Ordinary Least Squares | |||||
| Variable | Parameter | S.D. | T-STAT H0: parameter = 0 | 2-tail p-value | 1-tail p-value |
| (Intercept) | 100.675 | 0.331993 | 303.2441 | 0 | 0 |
| M1 | -0.0901666666666308 | 0.404369 | -0.223 | 0.824537 | 0.412269 |
| M2 | -0.0353333333333356 | 0.404125 | -0.0874 | 0.930708 | 0.465354 |
| M3 | -0.298500000000003 | 0.403936 | -0.739 | 0.463674 | 0.231837 |
| M4 | -0.109666666666670 | 0.403801 | -0.2716 | 0.787155 | 0.393578 |
| M5 | -0.394833333333334 | 0.403719 | -0.978 | 0.333195 | 0.166598 |
| M6 | -0.384000000000005 | 0.403692 | -0.9512 | 0.346464 | 0.173232 |
| M7 | -0.543166666666667 | 0.403719 | -1.3454 | 0.185089 | 0.092545 |
| M8 | -0.488333333333337 | 0.403801 | -1.2093 | 0.23271 | 0.116355 |
| M9 | 0.514500000000001 | 0.403936 | 1.2737 | 0.209162 | 0.104581 |
| M10 | 0.391333333333330 | 0.404125 | 0.9683 | 0.337936 | 0.168968 |
| M11 | 0.148166666666668 | 0.404369 | 0.3664 | 0.715736 | 0.357868 |
| t | 0.327166666666666 | 0.004676 | 69.9608 | 0 | 0 |
| Multiple Linear Regression - Regression Statistics | |
| Multiple R | 0.99553293301821 |
| R-squared | 0.991085820723838 |
| Adjusted R-squared | 0.988760382651796 |
| F-TEST (value) | 426.193168779355 |
| F-TEST (DF numerator) | 12 |
| F-TEST (DF denominator) | 46 |
| p-value | 0 |
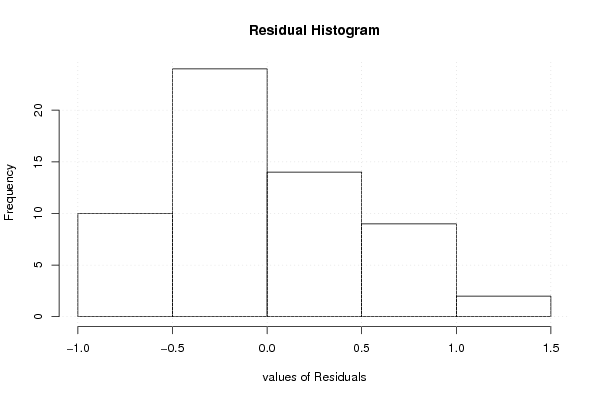
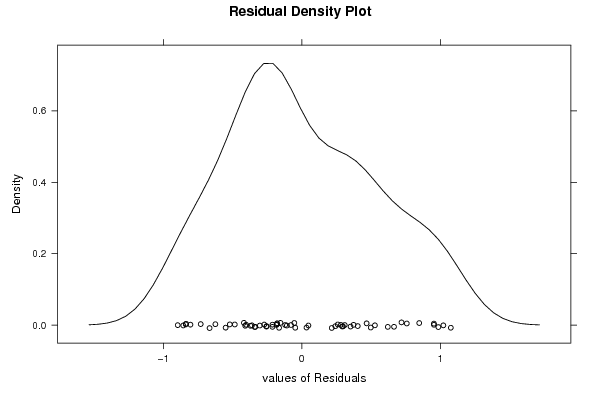
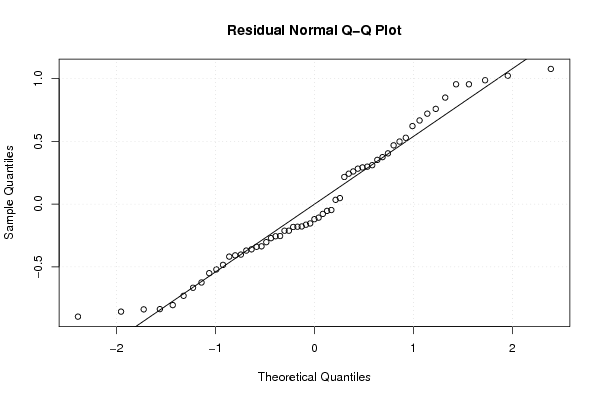
| Multiple Linear Regression - Residual Statistics | |
| Residual Standard Deviation | 0.60178899956713 |
| Sum Squared Residuals | 16.6589000000003 |
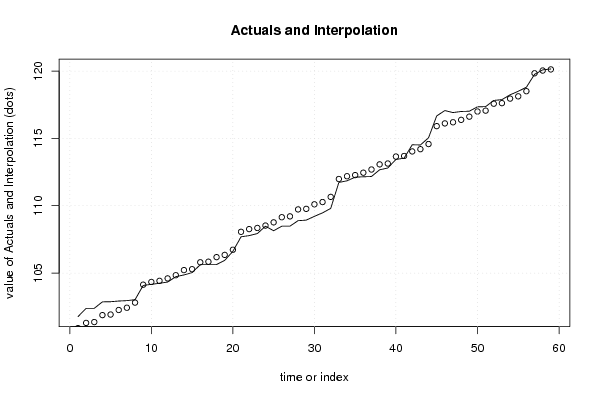
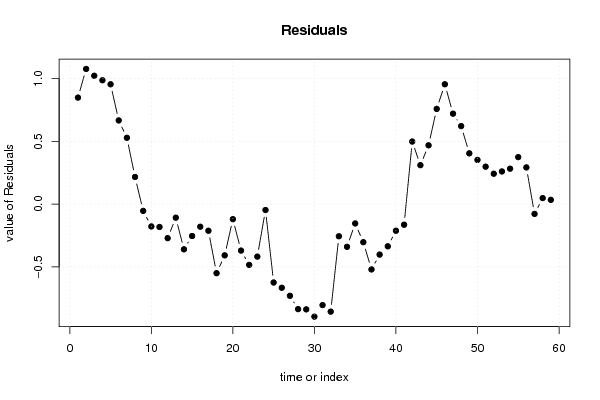
| Multiple Linear Regression - Actuals, Interpolation, and Residuals | |||
| Time or Index | Actuals | Interpolation Forecast | Residuals Prediction Error |
| 1 | 101.76 | 100.912000000000 | 0.848000000000147 |
| 2 | 102.37 | 101.294 | 1.07600000000000 |
| 3 | 102.38 | 101.358 | 1.02199999999999 |
| 4 | 102.86 | 101.874 | 0.985999999999992 |
| 5 | 102.87 | 101.916 | 0.954 |
| 6 | 102.92 | 102.254 | 0.665999999999998 |
| 7 | 102.95 | 102.422 | 0.527999999999995 |
| 8 | 103.02 | 102.804 | 0.215999999999990 |
| 9 | 104.08 | 104.134 | -0.0540000000000092 |
| 10 | 104.16 | 104.338 | -0.178000000000008 |
| 11 | 104.24 | 104.422 | -0.182000000000011 |
| 12 | 104.33 | 104.601 | -0.271000000000009 |
| 13 | 104.73 | 104.838 | -0.108000000000037 |
| 14 | 104.86 | 105.22 | -0.360000000000007 |
| 15 | 105.03 | 105.284 | -0.254000000000003 |
| 16 | 105.62 | 105.8 | -0.179999999999998 |
| 17 | 105.63 | 105.842 | -0.212000000000011 |
| 18 | 105.63 | 106.18 | -0.550000000000006 |
| 19 | 105.94 | 106.348 | -0.408000000000007 |
| 20 | 106.61 | 106.73 | -0.120000000000003 |
| 21 | 107.69 | 108.06 | -0.370000000000008 |
| 22 | 107.78 | 108.264 | -0.484000000000001 |
| 23 | 107.93 | 108.348 | -0.417999999999998 |
| 24 | 108.48 | 108.527 | -0.0469999999999995 |
| 25 | 108.14 | 108.764 | -0.62400000000004 |
| 26 | 108.48 | 109.146 | -0.665999999999997 |
| 27 | 108.48 | 109.21 | -0.729999999999996 |
| 28 | 108.89 | 109.726 | -0.836 |
| 29 | 108.93 | 109.768 | -0.837999999999994 |
| 30 | 109.21 | 110.106 | -0.896000000000002 |
| 31 | 109.47 | 110.274 | -0.804000000000001 |
| 32 | 109.8 | 110.656 | -0.856000000000001 |
| 33 | 111.73 | 111.986 | -0.255999999999999 |
| 34 | 111.85 | 112.19 | -0.340000000000004 |
| 35 | 112.12 | 112.274 | -0.153999999999996 |
| 36 | 112.15 | 112.453 | -0.302999999999994 |
| 37 | 112.17 | 112.69 | -0.520000000000035 |
| 38 | 112.67 | 113.072 | -0.401999999999996 |
| 39 | 112.8 | 113.136 | -0.336 |
| 40 | 113.44 | 113.652 | -0.211999999999997 |
| 41 | 113.53 | 113.694 | -0.163999999999995 |
| 42 | 114.53 | 114.032 | 0.498000000000008 |
| 43 | 114.51 | 114.2 | 0.310000000000009 |
| 44 | 115.05 | 114.582 | 0.468000000000006 |
| 45 | 116.67 | 115.912 | 0.758000000000002 |
| 46 | 117.07 | 116.116 | 0.953999999999998 |
| 47 | 116.92 | 116.2 | 0.72 |
| 48 | 117 | 116.379 | 0.621000000000003 |
| 49 | 117.02 | 116.616 | 0.403999999999965 |
| 50 | 117.35 | 116.998 | 0.352000000000002 |
| 51 | 117.36 | 117.062 | 0.298000000000010 |
| 52 | 117.82 | 117.578 | 0.242000000000003 |
| 53 | 117.88 | 117.62 | 0.260000000000001 |
| 54 | 118.24 | 117.958 | 0.282000000000003 |
| 55 | 118.5 | 118.126 | 0.374000000000004 |
| 56 | 118.8 | 118.508 | 0.292000000000007 |
| 57 | 119.76 | 119.838 | -0.0779999999999863 |
| 58 | 120.09 | 120.042 | 0.0480000000000138 |
| 59 | 120.16 | 120.126 | 0.034000000000004 |
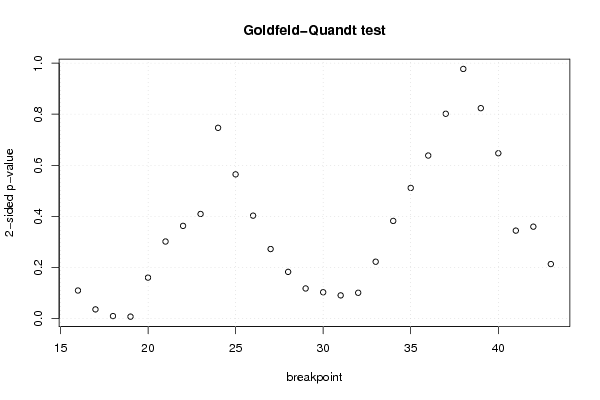
| Goldfeld-Quandt test for Heteroskedasticity | |||
| p-values | Alternative Hypothesis | ||
| breakpoint index | greater | 2-sided | less |
| 16 | 0.0547296926559853 | 0.109459385311971 | 0.945270307344015 |
| 17 | 0.0177728872203434 | 0.0355457744406867 | 0.982227112779657 |
| 18 | 0.00464095716551273 | 0.00928191433102546 | 0.995359042834487 |
| 19 | 0.00351427593044907 | 0.00702855186089814 | 0.99648572406955 |
| 20 | 0.0799763296435809 | 0.159952659287162 | 0.920023670356419 |
| 21 | 0.150667061567439 | 0.301334123134879 | 0.84933293843256 |
| 22 | 0.181333272846476 | 0.362666545692952 | 0.818666727153524 |
| 23 | 0.204600533398098 | 0.409201066796196 | 0.795399466601902 |
| 24 | 0.373371608378269 | 0.746743216756537 | 0.626628391621731 |
| 25 | 0.282238578186767 | 0.564477156373535 | 0.717761421813233 |
| 26 | 0.201369066520644 | 0.402738133041288 | 0.798630933479356 |
| 27 | 0.13597917911152 | 0.27195835822304 | 0.86402082088848 |
| 28 | 0.0912155995052147 | 0.182431199010429 | 0.908784400494785 |
| 29 | 0.0587392681024176 | 0.117478536204835 | 0.941260731897582 |
| 30 | 0.0513046301744405 | 0.102609260348881 | 0.94869536982556 |
| 31 | 0.0451886975235919 | 0.0903773950471838 | 0.954811302476408 |
| 32 | 0.0502919689068841 | 0.100583937813768 | 0.949708031093116 |
| 33 | 0.111110422671916 | 0.222220845343833 | 0.888889577328084 |
| 34 | 0.191021648544968 | 0.382043297089935 | 0.808978351455032 |
| 35 | 0.255702909352402 | 0.511405818704805 | 0.744297090647598 |
| 36 | 0.319105035321378 | 0.638210070642757 | 0.680894964678622 |
| 37 | 0.40091302998738 | 0.80182605997476 | 0.59908697001262 |
| 38 | 0.488718424464117 | 0.977436848928235 | 0.511281575535883 |
| 39 | 0.588117477650843 | 0.823765044698315 | 0.411882522349157 |
| 40 | 0.676421363415406 | 0.647157273169187 | 0.323578636584594 |
| 41 | 0.827958548305437 | 0.344082903389126 | 0.172041451694563 |
| 42 | 0.820259252819365 | 0.35948149436127 | 0.179740747180635 |
| 43 | 0.893445697421056 | 0.213108605157889 | 0.106554302578944 |
| Meta Analysis of Goldfeld-Quandt test for Heteroskedasticity | |||
| Description | # significant tests | % significant tests | OK/NOK |
| 1% type I error level | 2 | 0.0714285714285714 | NOK |
| 5% type I error level | 3 | 0.107142857142857 | NOK |
| 10% type I error level | 4 | 0.142857142857143 | NOK |