Free Statistics

of Irreproducible Research!

Author's title

Author*The author of this computation has been verified*
R Software Modulerwasp_autocorrelation.wasp
Title produced by software(Partial) Autocorrelation Function
Date of computationSat, 18 Dec 2010 16:52:09 +0000
Cite this page as followsStatistical Computations at FreeStatistics.org, Office for Research Development and Education, URL https://freestatistics.org/blog/index.php?v=date/2010/Dec/18/t1292690987cw9fxp9uikb1lhq.htm/, Retrieved Tue, 30 Apr 2024 04:44:26 +0000
Statistical Computations at FreeStatistics.org, Office for Research Development and Education, URL https://freestatistics.org/blog/index.php?pk=112102, Retrieved Tue, 30 Apr 2024 04:44:26 +0000
QR Codes:

Original text written by user:
IsPrivate?No (this computation is public)
User-defined keywords
Estimated Impact132
Family? (F = Feedback message, R = changed R code, M = changed R Module, P = changed Parameters, D = changed Data)
-     [] [] [1970-01-01 00:00:00] [ed939ef6f97e5f2afb6796311d9e7a5f]
- RMPD  [(Partial) Autocorrelation Function] [] [2010-12-17 18:01:53] [ed939ef6f97e5f2afb6796311d9e7a5f]
-   P     [(Partial) Autocorrelation Function] [] [2010-12-17 18:08:19] [ed939ef6f97e5f2afb6796311d9e7a5f]
-   P         [(Partial) Autocorrelation Function] [Paper] [2010-12-18 16:52:09] [476d588d86fe88306e0383abd6004235] [Current]
Feedback Forum

Post a new message
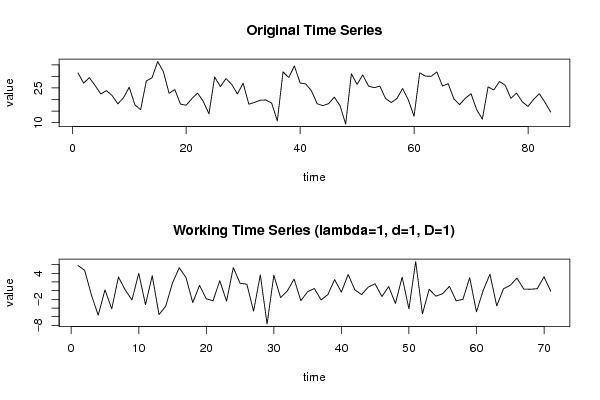
Dataseries X:
31.514
27.071
29.462
26.105
22.397
23.843
21.705
18.089
20.764
25.316
17.704
15.548
28.029
29.383
36.438
32.034
22.679
24.319
18.004
17.537
20.366
22.782
19.169
13.807
29.743
25.591
29.096
26.482
22.405
27.044
17.970
18.730
19.684
19.785
18.479
10.698
31.956
29.506
34.506
27.165
26.736
23.691
18.157
17.328
18.205
20.995
17.382
9.367
31.124
26.551
30.651
25.859
25.100
25.778
20.418
18.688
20.424
24.776
19.814
12.738
31.566
30.111
30.019
31.934
25.826
26.835
20.205
17.789
20.520
22.518
15.572
11.509
25.447
24.090
27.786
26.195
20.516
22.759
19.028
16.971
20.036
22.485
18.730
14.538


Summary of computational transaction
Raw Inputview raw input (R code)
Raw Outputview raw output of R engine
Computing time3 seconds
R Server'George Udny Yule' @ 72.249.76.132

\begin{tabular}{lllllllll}
\hline
Summary of computational transaction \tabularnewline
Raw Input & view raw input (R code)  \tabularnewline
Raw Output & view raw output of R engine  \tabularnewline
Computing time & 3 seconds \tabularnewline
R Server & 'George Udny Yule' @ 72.249.76.132 \tabularnewline
\hline
\end{tabular}
%Source: https://freestatistics.org/blog/index.php?pk=112102&T=0

[TABLE]
[ROW][C]Summary of computational transaction[/C][/ROW]
[ROW][C]Raw Input[/C][C]view raw input (R code) [/C][/ROW]
[ROW][C]Raw Output[/C][C]view raw output of R engine [/C][/ROW]
[ROW][C]Computing time[/C][C]3 seconds[/C][/ROW]
[ROW][C]R Server[/C][C]'George Udny Yule' @ 72.249.76.132[/C][/ROW]
[/TABLE]
Source: https://freestatistics.org/blog/index.php?pk=112102&T=0

Globally Unique Identifier (entire table): ba.freestatistics.org/blog/index.php?pk=112102&T=0

As an alternative you can also use a QR Code:  

The GUIDs for individual cells are displayed in the table below:

Summary of computational transaction
Raw Inputview raw input (R code)
Raw Outputview raw output of R engine
Computing time3 seconds
R Server'George Udny Yule' @ 72.249.76.132


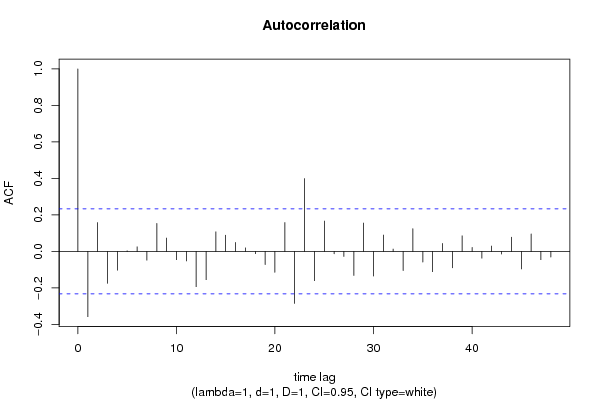
Autocorrelation Function
Time lag kACF(k)T-STATP-value
1-0.357494-3.01230.001795
20.1583741.33450.093155
3-0.174794-1.47280.072607
4-0.103129-0.8690.193894
50.003570.03010.488042
60.0256040.21570.414904
7-0.04798-0.40430.34361
80.1531951.29080.100473
90.0729620.61480.270328
10-0.045447-0.38290.351452
11-0.052467-0.44210.329884
12-0.19318-1.62780.054003
13-0.154818-1.30450.098134
140.1077840.90820.183422
150.089290.75240.227158
160.0494130.41640.3392
170.0194470.16390.435154
18-0.012459-0.1050.458342
19-0.071869-0.60560.273362
20-0.114484-0.96470.168996
210.1581181.33230.093507
22-0.285158-2.40280.009444
230.3993433.36490.000619
24-0.160739-1.35440.08995
250.1661561.40010.082925
26-0.013374-0.11270.455295
27-0.027193-0.22910.409713
28-0.13132-1.10650.136118
290.1557061.3120.096872
30-0.135364-1.14060.128935
310.0897660.75640.22596
320.0127550.10750.457358
33-0.104662-0.88190.190405
340.1243841.04810.14908
35-0.05836-0.49170.312207
36-0.110815-0.93370.176801
370.0440080.37080.355939
38-0.089993-0.75830.225392
390.0855640.7210.236647
400.0218120.18380.427351
41-0.036862-0.31060.378504
420.0296680.250.40166
43-0.01454-0.12250.451418
440.0779910.65720.256599
45-0.095737-0.80670.211269
460.0956230.80570.211543
47-0.045412-0.38260.351562
48-0.030736-0.2590.398199

\begin{tabular}{lllllllll}
\hline
Autocorrelation Function \tabularnewline
Time lag k & ACF(k) & T-STAT & P-value \tabularnewline
1 & -0.357494 & -3.0123 & 0.001795 \tabularnewline
2 & 0.158374 & 1.3345 & 0.093155 \tabularnewline
3 & -0.174794 & -1.4728 & 0.072607 \tabularnewline
4 & -0.103129 & -0.869 & 0.193894 \tabularnewline
5 & 0.00357 & 0.0301 & 0.488042 \tabularnewline
6 & 0.025604 & 0.2157 & 0.414904 \tabularnewline
7 & -0.04798 & -0.4043 & 0.34361 \tabularnewline
8 & 0.153195 & 1.2908 & 0.100473 \tabularnewline
9 & 0.072962 & 0.6148 & 0.270328 \tabularnewline
10 & -0.045447 & -0.3829 & 0.351452 \tabularnewline
11 & -0.052467 & -0.4421 & 0.329884 \tabularnewline
12 & -0.19318 & -1.6278 & 0.054003 \tabularnewline
13 & -0.154818 & -1.3045 & 0.098134 \tabularnewline
14 & 0.107784 & 0.9082 & 0.183422 \tabularnewline
15 & 0.08929 & 0.7524 & 0.227158 \tabularnewline
16 & 0.049413 & 0.4164 & 0.3392 \tabularnewline
17 & 0.019447 & 0.1639 & 0.435154 \tabularnewline
18 & -0.012459 & -0.105 & 0.458342 \tabularnewline
19 & -0.071869 & -0.6056 & 0.273362 \tabularnewline
20 & -0.114484 & -0.9647 & 0.168996 \tabularnewline
21 & 0.158118 & 1.3323 & 0.093507 \tabularnewline
22 & -0.285158 & -2.4028 & 0.009444 \tabularnewline
23 & 0.399343 & 3.3649 & 0.000619 \tabularnewline
24 & -0.160739 & -1.3544 & 0.08995 \tabularnewline
25 & 0.166156 & 1.4001 & 0.082925 \tabularnewline
26 & -0.013374 & -0.1127 & 0.455295 \tabularnewline
27 & -0.027193 & -0.2291 & 0.409713 \tabularnewline
28 & -0.13132 & -1.1065 & 0.136118 \tabularnewline
29 & 0.155706 & 1.312 & 0.096872 \tabularnewline
30 & -0.135364 & -1.1406 & 0.128935 \tabularnewline
31 & 0.089766 & 0.7564 & 0.22596 \tabularnewline
32 & 0.012755 & 0.1075 & 0.457358 \tabularnewline
33 & -0.104662 & -0.8819 & 0.190405 \tabularnewline
34 & 0.124384 & 1.0481 & 0.14908 \tabularnewline
35 & -0.05836 & -0.4917 & 0.312207 \tabularnewline
36 & -0.110815 & -0.9337 & 0.176801 \tabularnewline
37 & 0.044008 & 0.3708 & 0.355939 \tabularnewline
38 & -0.089993 & -0.7583 & 0.225392 \tabularnewline
39 & 0.085564 & 0.721 & 0.236647 \tabularnewline
40 & 0.021812 & 0.1838 & 0.427351 \tabularnewline
41 & -0.036862 & -0.3106 & 0.378504 \tabularnewline
42 & 0.029668 & 0.25 & 0.40166 \tabularnewline
43 & -0.01454 & -0.1225 & 0.451418 \tabularnewline
44 & 0.077991 & 0.6572 & 0.256599 \tabularnewline
45 & -0.095737 & -0.8067 & 0.211269 \tabularnewline
46 & 0.095623 & 0.8057 & 0.211543 \tabularnewline
47 & -0.045412 & -0.3826 & 0.351562 \tabularnewline
48 & -0.030736 & -0.259 & 0.398199 \tabularnewline
\hline
\end{tabular}
%Source: https://freestatistics.org/blog/index.php?pk=112102&T=1

[TABLE]
[ROW][C]Autocorrelation Function[/C][/ROW]
[ROW][C]Time lag k[/C][C]ACF(k)[/C][C]T-STAT[/C][C]P-value[/C][/ROW]
[ROW][C]1[/C][C]-0.357494[/C][C]-3.0123[/C][C]0.001795[/C][/ROW]
[ROW][C]2[/C][C]0.158374[/C][C]1.3345[/C][C]0.093155[/C][/ROW]
[ROW][C]3[/C][C]-0.174794[/C][C]-1.4728[/C][C]0.072607[/C][/ROW]
[ROW][C]4[/C][C]-0.103129[/C][C]-0.869[/C][C]0.193894[/C][/ROW]
[ROW][C]5[/C][C]0.00357[/C][C]0.0301[/C][C]0.488042[/C][/ROW]
[ROW][C]6[/C][C]0.025604[/C][C]0.2157[/C][C]0.414904[/C][/ROW]
[ROW][C]7[/C][C]-0.04798[/C][C]-0.4043[/C][C]0.34361[/C][/ROW]
[ROW][C]8[/C][C]0.153195[/C][C]1.2908[/C][C]0.100473[/C][/ROW]
[ROW][C]9[/C][C]0.072962[/C][C]0.6148[/C][C]0.270328[/C][/ROW]
[ROW][C]10[/C][C]-0.045447[/C][C]-0.3829[/C][C]0.351452[/C][/ROW]
[ROW][C]11[/C][C]-0.052467[/C][C]-0.4421[/C][C]0.329884[/C][/ROW]
[ROW][C]12[/C][C]-0.19318[/C][C]-1.6278[/C][C]0.054003[/C][/ROW]
[ROW][C]13[/C][C]-0.154818[/C][C]-1.3045[/C][C]0.098134[/C][/ROW]
[ROW][C]14[/C][C]0.107784[/C][C]0.9082[/C][C]0.183422[/C][/ROW]
[ROW][C]15[/C][C]0.08929[/C][C]0.7524[/C][C]0.227158[/C][/ROW]
[ROW][C]16[/C][C]0.049413[/C][C]0.4164[/C][C]0.3392[/C][/ROW]
[ROW][C]17[/C][C]0.019447[/C][C]0.1639[/C][C]0.435154[/C][/ROW]
[ROW][C]18[/C][C]-0.012459[/C][C]-0.105[/C][C]0.458342[/C][/ROW]
[ROW][C]19[/C][C]-0.071869[/C][C]-0.6056[/C][C]0.273362[/C][/ROW]
[ROW][C]20[/C][C]-0.114484[/C][C]-0.9647[/C][C]0.168996[/C][/ROW]
[ROW][C]21[/C][C]0.158118[/C][C]1.3323[/C][C]0.093507[/C][/ROW]
[ROW][C]22[/C][C]-0.285158[/C][C]-2.4028[/C][C]0.009444[/C][/ROW]
[ROW][C]23[/C][C]0.399343[/C][C]3.3649[/C][C]0.000619[/C][/ROW]
[ROW][C]24[/C][C]-0.160739[/C][C]-1.3544[/C][C]0.08995[/C][/ROW]
[ROW][C]25[/C][C]0.166156[/C][C]1.4001[/C][C]0.082925[/C][/ROW]
[ROW][C]26[/C][C]-0.013374[/C][C]-0.1127[/C][C]0.455295[/C][/ROW]
[ROW][C]27[/C][C]-0.027193[/C][C]-0.2291[/C][C]0.409713[/C][/ROW]
[ROW][C]28[/C][C]-0.13132[/C][C]-1.1065[/C][C]0.136118[/C][/ROW]
[ROW][C]29[/C][C]0.155706[/C][C]1.312[/C][C]0.096872[/C][/ROW]
[ROW][C]30[/C][C]-0.135364[/C][C]-1.1406[/C][C]0.128935[/C][/ROW]
[ROW][C]31[/C][C]0.089766[/C][C]0.7564[/C][C]0.22596[/C][/ROW]
[ROW][C]32[/C][C]0.012755[/C][C]0.1075[/C][C]0.457358[/C][/ROW]
[ROW][C]33[/C][C]-0.104662[/C][C]-0.8819[/C][C]0.190405[/C][/ROW]
[ROW][C]34[/C][C]0.124384[/C][C]1.0481[/C][C]0.14908[/C][/ROW]
[ROW][C]35[/C][C]-0.05836[/C][C]-0.4917[/C][C]0.312207[/C][/ROW]
[ROW][C]36[/C][C]-0.110815[/C][C]-0.9337[/C][C]0.176801[/C][/ROW]
[ROW][C]37[/C][C]0.044008[/C][C]0.3708[/C][C]0.355939[/C][/ROW]
[ROW][C]38[/C][C]-0.089993[/C][C]-0.7583[/C][C]0.225392[/C][/ROW]
[ROW][C]39[/C][C]0.085564[/C][C]0.721[/C][C]0.236647[/C][/ROW]
[ROW][C]40[/C][C]0.021812[/C][C]0.1838[/C][C]0.427351[/C][/ROW]
[ROW][C]41[/C][C]-0.036862[/C][C]-0.3106[/C][C]0.378504[/C][/ROW]
[ROW][C]42[/C][C]0.029668[/C][C]0.25[/C][C]0.40166[/C][/ROW]
[ROW][C]43[/C][C]-0.01454[/C][C]-0.1225[/C][C]0.451418[/C][/ROW]
[ROW][C]44[/C][C]0.077991[/C][C]0.6572[/C][C]0.256599[/C][/ROW]
[ROW][C]45[/C][C]-0.095737[/C][C]-0.8067[/C][C]0.211269[/C][/ROW]
[ROW][C]46[/C][C]0.095623[/C][C]0.8057[/C][C]0.211543[/C][/ROW]
[ROW][C]47[/C][C]-0.045412[/C][C]-0.3826[/C][C]0.351562[/C][/ROW]
[ROW][C]48[/C][C]-0.030736[/C][C]-0.259[/C][C]0.398199[/C][/ROW]
[/TABLE]
Source: https://freestatistics.org/blog/index.php?pk=112102&T=1

Globally Unique Identifier (entire table): ba.freestatistics.org/blog/index.php?pk=112102&T=1

As an alternative you can also use a QR Code:  

The GUIDs for individual cells are displayed in the table below:

Autocorrelation Function
Time lag kACF(k)T-STATP-value
1-0.357494-3.01230.001795
20.1583741.33450.093155
3-0.174794-1.47280.072607
4-0.103129-0.8690.193894
50.003570.03010.488042
60.0256040.21570.414904
7-0.04798-0.40430.34361
80.1531951.29080.100473
90.0729620.61480.270328
10-0.045447-0.38290.351452
11-0.052467-0.44210.329884
12-0.19318-1.62780.054003
13-0.154818-1.30450.098134
140.1077840.90820.183422
150.089290.75240.227158
160.0494130.41640.3392
170.0194470.16390.435154
18-0.012459-0.1050.458342
19-0.071869-0.60560.273362
20-0.114484-0.96470.168996
210.1581181.33230.093507
22-0.285158-2.40280.009444
230.3993433.36490.000619
24-0.160739-1.35440.08995
250.1661561.40010.082925
26-0.013374-0.11270.455295
27-0.027193-0.22910.409713
28-0.13132-1.10650.136118
290.1557061.3120.096872
30-0.135364-1.14060.128935
310.0897660.75640.22596
320.0127550.10750.457358
33-0.104662-0.88190.190405
340.1243841.04810.14908
35-0.05836-0.49170.312207
36-0.110815-0.93370.176801
370.0440080.37080.355939
38-0.089993-0.75830.225392
390.0855640.7210.236647
400.0218120.18380.427351
41-0.036862-0.31060.378504
420.0296680.250.40166
43-0.01454-0.12250.451418
440.0779910.65720.256599
45-0.095737-0.80670.211269
460.0956230.80570.211543
47-0.045412-0.38260.351562
48-0.030736-0.2590.398199


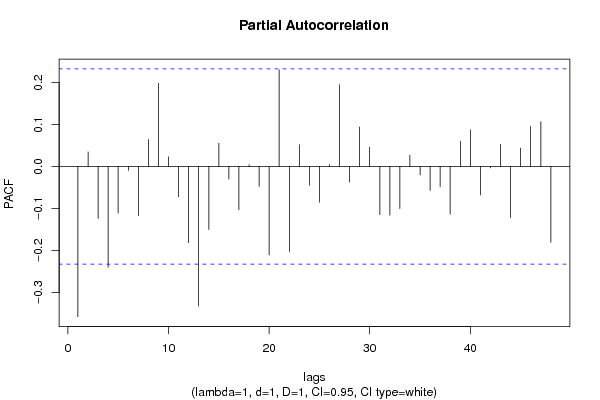
Partial Autocorrelation Function
Time lag kPACF(k)T-STATP-value
1-0.357494-3.01230.001795
20.0350520.29530.384294
3-0.123553-1.04110.150687
4-0.239721-2.01990.023583
5-0.110636-0.93220.177187
6-0.009314-0.07850.468834
7-0.117054-0.98630.163664
80.0647090.54520.293646
90.1982991.67090.049572
100.0233810.1970.422191
11-0.071848-0.60540.273422
12-0.181269-1.52740.065552
13-0.33239-2.80080.003282
14-0.1496-1.26060.105799
150.0556030.46850.320425
16-0.029384-0.24760.402583
17-0.102528-0.86390.195271
180.0041140.03470.486222
19-0.047362-0.39910.345516
20-0.210645-1.77490.040098
210.230761.94440.027904
22-0.20237-1.70520.046265
230.0520390.43850.331182
24-0.044248-0.37280.355189
25-0.084901-0.71540.238357
260.0046120.03890.484555
270.1952231.6450.052197
28-0.03648-0.30740.379726
290.0941280.79310.215171
300.0462660.38980.348909
31-0.114445-0.96430.169077
32-0.11569-0.97480.16648
33-0.100038-0.84290.201049
340.0272330.22950.409582
35-0.019998-0.16850.433331
36-0.05684-0.47890.316725
37-0.048154-0.40580.343073
38-0.113522-0.95660.171018
390.0604020.5090.306179
400.0875660.73780.231522
41-0.067616-0.56970.285324
42-0.003218-0.02710.489223
430.0532030.44830.327652
44-0.121504-1.02380.1547
450.044120.37180.355588
460.0954310.80410.212008
470.1069280.9010.185319
48-0.180414-1.52020.066451

\begin{tabular}{lllllllll}
\hline
Partial Autocorrelation Function \tabularnewline
Time lag k & PACF(k) & T-STAT & P-value \tabularnewline
1 & -0.357494 & -3.0123 & 0.001795 \tabularnewline
2 & 0.035052 & 0.2953 & 0.384294 \tabularnewline
3 & -0.123553 & -1.0411 & 0.150687 \tabularnewline
4 & -0.239721 & -2.0199 & 0.023583 \tabularnewline
5 & -0.110636 & -0.9322 & 0.177187 \tabularnewline
6 & -0.009314 & -0.0785 & 0.468834 \tabularnewline
7 & -0.117054 & -0.9863 & 0.163664 \tabularnewline
8 & 0.064709 & 0.5452 & 0.293646 \tabularnewline
9 & 0.198299 & 1.6709 & 0.049572 \tabularnewline
10 & 0.023381 & 0.197 & 0.422191 \tabularnewline
11 & -0.071848 & -0.6054 & 0.273422 \tabularnewline
12 & -0.181269 & -1.5274 & 0.065552 \tabularnewline
13 & -0.33239 & -2.8008 & 0.003282 \tabularnewline
14 & -0.1496 & -1.2606 & 0.105799 \tabularnewline
15 & 0.055603 & 0.4685 & 0.320425 \tabularnewline
16 & -0.029384 & -0.2476 & 0.402583 \tabularnewline
17 & -0.102528 & -0.8639 & 0.195271 \tabularnewline
18 & 0.004114 & 0.0347 & 0.486222 \tabularnewline
19 & -0.047362 & -0.3991 & 0.345516 \tabularnewline
20 & -0.210645 & -1.7749 & 0.040098 \tabularnewline
21 & 0.23076 & 1.9444 & 0.027904 \tabularnewline
22 & -0.20237 & -1.7052 & 0.046265 \tabularnewline
23 & 0.052039 & 0.4385 & 0.331182 \tabularnewline
24 & -0.044248 & -0.3728 & 0.355189 \tabularnewline
25 & -0.084901 & -0.7154 & 0.238357 \tabularnewline
26 & 0.004612 & 0.0389 & 0.484555 \tabularnewline
27 & 0.195223 & 1.645 & 0.052197 \tabularnewline
28 & -0.03648 & -0.3074 & 0.379726 \tabularnewline
29 & 0.094128 & 0.7931 & 0.215171 \tabularnewline
30 & 0.046266 & 0.3898 & 0.348909 \tabularnewline
31 & -0.114445 & -0.9643 & 0.169077 \tabularnewline
32 & -0.11569 & -0.9748 & 0.16648 \tabularnewline
33 & -0.100038 & -0.8429 & 0.201049 \tabularnewline
34 & 0.027233 & 0.2295 & 0.409582 \tabularnewline
35 & -0.019998 & -0.1685 & 0.433331 \tabularnewline
36 & -0.05684 & -0.4789 & 0.316725 \tabularnewline
37 & -0.048154 & -0.4058 & 0.343073 \tabularnewline
38 & -0.113522 & -0.9566 & 0.171018 \tabularnewline
39 & 0.060402 & 0.509 & 0.306179 \tabularnewline
40 & 0.087566 & 0.7378 & 0.231522 \tabularnewline
41 & -0.067616 & -0.5697 & 0.285324 \tabularnewline
42 & -0.003218 & -0.0271 & 0.489223 \tabularnewline
43 & 0.053203 & 0.4483 & 0.327652 \tabularnewline
44 & -0.121504 & -1.0238 & 0.1547 \tabularnewline
45 & 0.04412 & 0.3718 & 0.355588 \tabularnewline
46 & 0.095431 & 0.8041 & 0.212008 \tabularnewline
47 & 0.106928 & 0.901 & 0.185319 \tabularnewline
48 & -0.180414 & -1.5202 & 0.066451 \tabularnewline
\hline
\end{tabular}
%Source: https://freestatistics.org/blog/index.php?pk=112102&T=2

[TABLE]
[ROW][C]Partial Autocorrelation Function[/C][/ROW]
[ROW][C]Time lag k[/C][C]PACF(k)[/C][C]T-STAT[/C][C]P-value[/C][/ROW]
[ROW][C]1[/C][C]-0.357494[/C][C]-3.0123[/C][C]0.001795[/C][/ROW]
[ROW][C]2[/C][C]0.035052[/C][C]0.2953[/C][C]0.384294[/C][/ROW]
[ROW][C]3[/C][C]-0.123553[/C][C]-1.0411[/C][C]0.150687[/C][/ROW]
[ROW][C]4[/C][C]-0.239721[/C][C]-2.0199[/C][C]0.023583[/C][/ROW]
[ROW][C]5[/C][C]-0.110636[/C][C]-0.9322[/C][C]0.177187[/C][/ROW]
[ROW][C]6[/C][C]-0.009314[/C][C]-0.0785[/C][C]0.468834[/C][/ROW]
[ROW][C]7[/C][C]-0.117054[/C][C]-0.9863[/C][C]0.163664[/C][/ROW]
[ROW][C]8[/C][C]0.064709[/C][C]0.5452[/C][C]0.293646[/C][/ROW]
[ROW][C]9[/C][C]0.198299[/C][C]1.6709[/C][C]0.049572[/C][/ROW]
[ROW][C]10[/C][C]0.023381[/C][C]0.197[/C][C]0.422191[/C][/ROW]
[ROW][C]11[/C][C]-0.071848[/C][C]-0.6054[/C][C]0.273422[/C][/ROW]
[ROW][C]12[/C][C]-0.181269[/C][C]-1.5274[/C][C]0.065552[/C][/ROW]
[ROW][C]13[/C][C]-0.33239[/C][C]-2.8008[/C][C]0.003282[/C][/ROW]
[ROW][C]14[/C][C]-0.1496[/C][C]-1.2606[/C][C]0.105799[/C][/ROW]
[ROW][C]15[/C][C]0.055603[/C][C]0.4685[/C][C]0.320425[/C][/ROW]
[ROW][C]16[/C][C]-0.029384[/C][C]-0.2476[/C][C]0.402583[/C][/ROW]
[ROW][C]17[/C][C]-0.102528[/C][C]-0.8639[/C][C]0.195271[/C][/ROW]
[ROW][C]18[/C][C]0.004114[/C][C]0.0347[/C][C]0.486222[/C][/ROW]
[ROW][C]19[/C][C]-0.047362[/C][C]-0.3991[/C][C]0.345516[/C][/ROW]
[ROW][C]20[/C][C]-0.210645[/C][C]-1.7749[/C][C]0.040098[/C][/ROW]
[ROW][C]21[/C][C]0.23076[/C][C]1.9444[/C][C]0.027904[/C][/ROW]
[ROW][C]22[/C][C]-0.20237[/C][C]-1.7052[/C][C]0.046265[/C][/ROW]
[ROW][C]23[/C][C]0.052039[/C][C]0.4385[/C][C]0.331182[/C][/ROW]
[ROW][C]24[/C][C]-0.044248[/C][C]-0.3728[/C][C]0.355189[/C][/ROW]
[ROW][C]25[/C][C]-0.084901[/C][C]-0.7154[/C][C]0.238357[/C][/ROW]
[ROW][C]26[/C][C]0.004612[/C][C]0.0389[/C][C]0.484555[/C][/ROW]
[ROW][C]27[/C][C]0.195223[/C][C]1.645[/C][C]0.052197[/C][/ROW]
[ROW][C]28[/C][C]-0.03648[/C][C]-0.3074[/C][C]0.379726[/C][/ROW]
[ROW][C]29[/C][C]0.094128[/C][C]0.7931[/C][C]0.215171[/C][/ROW]
[ROW][C]30[/C][C]0.046266[/C][C]0.3898[/C][C]0.348909[/C][/ROW]
[ROW][C]31[/C][C]-0.114445[/C][C]-0.9643[/C][C]0.169077[/C][/ROW]
[ROW][C]32[/C][C]-0.11569[/C][C]-0.9748[/C][C]0.16648[/C][/ROW]
[ROW][C]33[/C][C]-0.100038[/C][C]-0.8429[/C][C]0.201049[/C][/ROW]
[ROW][C]34[/C][C]0.027233[/C][C]0.2295[/C][C]0.409582[/C][/ROW]
[ROW][C]35[/C][C]-0.019998[/C][C]-0.1685[/C][C]0.433331[/C][/ROW]
[ROW][C]36[/C][C]-0.05684[/C][C]-0.4789[/C][C]0.316725[/C][/ROW]
[ROW][C]37[/C][C]-0.048154[/C][C]-0.4058[/C][C]0.343073[/C][/ROW]
[ROW][C]38[/C][C]-0.113522[/C][C]-0.9566[/C][C]0.171018[/C][/ROW]
[ROW][C]39[/C][C]0.060402[/C][C]0.509[/C][C]0.306179[/C][/ROW]
[ROW][C]40[/C][C]0.087566[/C][C]0.7378[/C][C]0.231522[/C][/ROW]
[ROW][C]41[/C][C]-0.067616[/C][C]-0.5697[/C][C]0.285324[/C][/ROW]
[ROW][C]42[/C][C]-0.003218[/C][C]-0.0271[/C][C]0.489223[/C][/ROW]
[ROW][C]43[/C][C]0.053203[/C][C]0.4483[/C][C]0.327652[/C][/ROW]
[ROW][C]44[/C][C]-0.121504[/C][C]-1.0238[/C][C]0.1547[/C][/ROW]
[ROW][C]45[/C][C]0.04412[/C][C]0.3718[/C][C]0.355588[/C][/ROW]
[ROW][C]46[/C][C]0.095431[/C][C]0.8041[/C][C]0.212008[/C][/ROW]
[ROW][C]47[/C][C]0.106928[/C][C]0.901[/C][C]0.185319[/C][/ROW]
[ROW][C]48[/C][C]-0.180414[/C][C]-1.5202[/C][C]0.066451[/C][/ROW]
[/TABLE]
Source: https://freestatistics.org/blog/index.php?pk=112102&T=2

Globally Unique Identifier (entire table): ba.freestatistics.org/blog/index.php?pk=112102&T=2

As an alternative you can also use a QR Code:  

The GUIDs for individual cells are displayed in the table below:

Partial Autocorrelation Function
Time lag kPACF(k)T-STATP-value
1-0.357494-3.01230.001795
20.0350520.29530.384294
3-0.123553-1.04110.150687
4-0.239721-2.01990.023583
5-0.110636-0.93220.177187
6-0.009314-0.07850.468834
7-0.117054-0.98630.163664
80.0647090.54520.293646
90.1982991.67090.049572
100.0233810.1970.422191
11-0.071848-0.60540.273422
12-0.181269-1.52740.065552
13-0.33239-2.80080.003282
14-0.1496-1.26060.105799
150.0556030.46850.320425
16-0.029384-0.24760.402583
17-0.102528-0.86390.195271
180.0041140.03470.486222
19-0.047362-0.39910.345516
20-0.210645-1.77490.040098
210.230761.94440.027904
22-0.20237-1.70520.046265
230.0520390.43850.331182
24-0.044248-0.37280.355189
25-0.084901-0.71540.238357
260.0046120.03890.484555
270.1952231.6450.052197
28-0.03648-0.30740.379726
290.0941280.79310.215171
300.0462660.38980.348909
31-0.114445-0.96430.169077
32-0.11569-0.97480.16648
33-0.100038-0.84290.201049
340.0272330.22950.409582
35-0.019998-0.16850.433331
36-0.05684-0.47890.316725
37-0.048154-0.40580.343073
38-0.113522-0.95660.171018
390.0604020.5090.306179
400.0875660.73780.231522
41-0.067616-0.56970.285324
42-0.003218-0.02710.489223
430.0532030.44830.327652
44-0.121504-1.02380.1547
450.044120.37180.355588
460.0954310.80410.212008
470.1069280.9010.185319
48-0.180414-1.52020.066451


Parameters (Session):
par1 = 12 ;
Parameters (R input):
par1 = 48 ; par2 = 1 ; par3 = 1 ; par4 = 1 ; par5 = 12 ; par6 = White Noise ; par7 = 0.95 ; par8 = ;
R code (references can be found in the software module):
if (par1 == 'Default') {
par1 = 10*log10(length(x))
} else {
par1 <- as.numeric(par1)
}
par2 <- as.numeric(par2)
par3 <- as.numeric(par3)
par4 <- as.numeric(par4)
par5 <- as.numeric(par5)
if (par6 == 'White Noise') par6 <- 'white' else par6 <- 'ma'
par7 <- as.numeric(par7)
if (par8 != '') par8 <- as.numeric(par8)
ox <- x
if (par8 == '') {
if (par2 == 0) {
x <- log(x)
} else {
x <- (x ^ par2 - 1) / par2
}
} else {
x <- log(x,base=par8)
}
if (par3 > 0) x <- diff(x,lag=1,difference=par3)
if (par4 > 0) x <- diff(x,lag=par5,difference=par4)
bitmap(file='picts.png')
op <- par(mfrow=c(2,1))
plot(ox,type='l',main='Original Time Series',xlab='time',ylab='value')
if (par8=='') {
mytitle <- paste('Working Time Series (lambda=',par2,', d=',par3,', D=',par4,')',sep='')
mysub <- paste('(lambda=',par2,', d=',par3,', D=',par4,', CI=', par7, ', CI type=',par6,')',sep='')
} else {
mytitle <- paste('Working Time Series (base=',par8,', d=',par3,', D=',par4,')',sep='')
mysub <- paste('(base=',par8,', d=',par3,', D=',par4,', CI=', par7, ', CI type=',par6,')',sep='')
}
plot(x,type='l', main=mytitle,xlab='time',ylab='value')
par(op)
dev.off()
bitmap(file='pic1.png')
racf <- acf(x, par1, main='Autocorrelation', xlab='time lag', ylab='ACF', ci.type=par6, ci=par7, sub=mysub)
dev.off()
bitmap(file='pic2.png')
rpacf <- pacf(x,par1,main='Partial Autocorrelation',xlab='lags',ylab='PACF',sub=mysub)
dev.off()
(myacf <- c(racf$acf))
(mypacf <- c(rpacf$acf))
lengthx <- length(x)
sqrtn <- sqrt(lengthx)
load(file='createtable')
a<-table.start()
a<-table.row.start(a)
a<-table.element(a,'Autocorrelation Function',4,TRUE)
a<-table.row.end(a)
a<-table.row.start(a)
a<-table.element(a,'Time lag k',header=TRUE)
a<-table.element(a,hyperlink('basics.htm','ACF(k)','click here for more information about the Autocorrelation Function'),header=TRUE)
a<-table.element(a,'T-STAT',header=TRUE)
a<-table.element(a,'P-value',header=TRUE)
a<-table.row.end(a)
for (i in 2:(par1+1)) {
a<-table.row.start(a)
a<-table.element(a,i-1,header=TRUE)
a<-table.element(a,round(myacf[i],6))
mytstat <- myacf[i]*sqrtn
a<-table.element(a,round(mytstat,4))
a<-table.element(a,round(1-pt(abs(mytstat),lengthx),6))
a<-table.row.end(a)
}
a<-table.end(a)
table.save(a,file='mytable.tab')
a<-table.start()
a<-table.row.start(a)
a<-table.element(a,'Partial Autocorrelation Function',4,TRUE)
a<-table.row.end(a)
a<-table.row.start(a)
a<-table.element(a,'Time lag k',header=TRUE)
a<-table.element(a,hyperlink('basics.htm','PACF(k)','click here for more information about the Partial Autocorrelation Function'),header=TRUE)
a<-table.element(a,'T-STAT',header=TRUE)
a<-table.element(a,'P-value',header=TRUE)
a<-table.row.end(a)
for (i in 1:par1) {
a<-table.row.start(a)
a<-table.element(a,i,header=TRUE)
a<-table.element(a,round(mypacf[i],6))
mytstat <- mypacf[i]*sqrtn
a<-table.element(a,round(mytstat,4))
a<-table.element(a,round(1-pt(abs(mytstat),lengthx),6))
a<-table.row.end(a)
}
a<-table.end(a)
table.save(a,file='mytable1.tab')