| Multiple Linear Regression - Estimated Regression Equation |
| cultuurbesteding[t] = + 110.49 -1.72599999999997M1[t] -1.34400000000002M2[t] -1.28000000000001M3[t] -0.764000000000012M4[t] -0.72200000000001M5[t] -0.384000000000014M6[t] -0.216000000000015M7[t] + 0.165999999999983M8[t] + 1.49599999999999M9[t] + 1.69999999999998M10[t] + 1.78399999999999M11[t] + e[t] |
| Multiple Linear Regression - Ordinary Least Squares | |||||
| Variable | Parameter | S.D. | T-STAT H0: parameter = 0 | 2-tail p-value | 1-tail p-value |
| (Intercept) | 110.49 | 3.084974 | 35.8155 | 0 | 0 |
| M1 | -1.72599999999997 | 4.138928 | -0.417 | 0.678565 | 0.339283 |
| M2 | -1.34400000000002 | 4.138928 | -0.3247 | 0.746833 | 0.373416 |
| M3 | -1.28000000000001 | 4.138928 | -0.3093 | 0.758492 | 0.379246 |
| M4 | -0.764000000000012 | 4.138928 | -0.1846 | 0.854346 | 0.427173 |
| M5 | -0.72200000000001 | 4.138928 | -0.1744 | 0.862268 | 0.431134 |
| M6 | -0.384000000000014 | 4.138928 | -0.0928 | 0.926475 | 0.463237 |
| M7 | -0.216000000000015 | 4.138928 | -0.0522 | 0.958601 | 0.4793 |
| M8 | 0.165999999999983 | 4.138928 | 0.0401 | 0.968178 | 0.484089 |
| M9 | 1.49599999999999 | 4.138928 | 0.3614 | 0.719386 | 0.359693 |
| M10 | 1.69999999999998 | 4.138928 | 0.4107 | 0.683134 | 0.341567 |
| M11 | 1.78399999999999 | 4.138928 | 0.431 | 0.668417 | 0.334209 |
| Multiple Linear Regression - Regression Statistics | |
| Multiple R | 0.206383754586892 |
| R-squared | 0.0425942541573825 |
| Adjusted R-squared | -0.181479431039826 |
| F-TEST (value) | 0.190090389774663 |
| F-TEST (DF numerator) | 11 |
| F-TEST (DF denominator) | 47 |
| p-value | 0.997475740470135 |
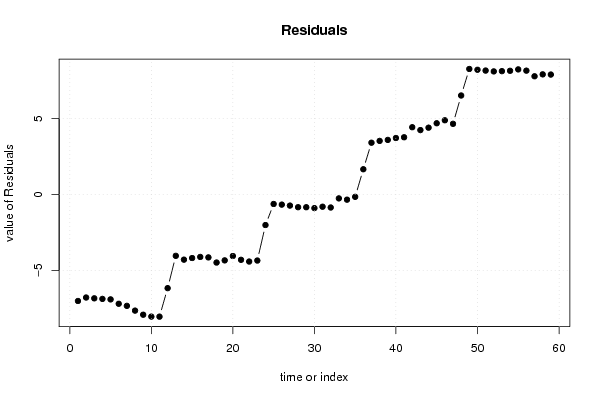
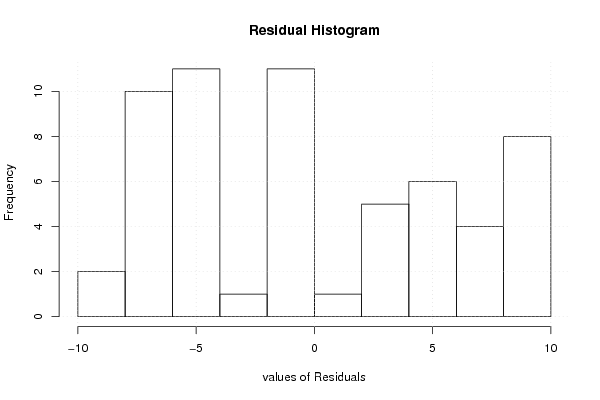
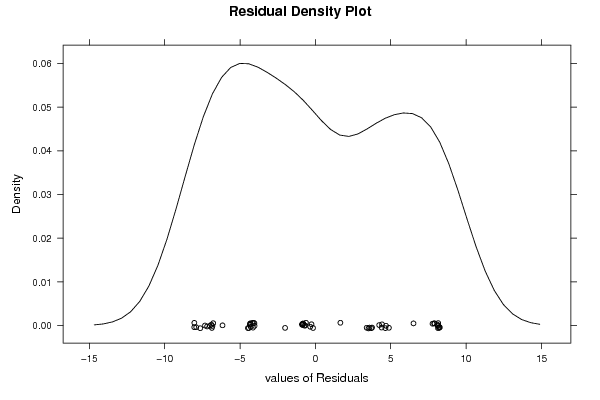
| Multiple Linear Regression - Residual Statistics | |
| Residual Standard Deviation | 6.16994886009358 |
| Sum Squared Residuals | 1789.20864000000 |
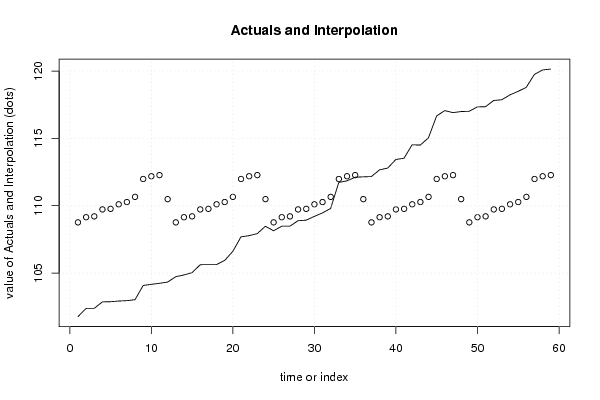
| Multiple Linear Regression - Actuals, Interpolation, and Residuals | |||
| Time or Index | Actuals | Interpolation Forecast | Residuals Prediction Error |
| 1 | 101.76 | 108.764000000000 | -7.00399999999979 |
| 2 | 102.37 | 109.146 | -6.77599999999999 |
| 3 | 102.38 | 109.21 | -6.83 |
| 4 | 102.86 | 109.726 | -6.866 |
| 5 | 102.87 | 109.768 | -6.898 |
| 6 | 102.92 | 110.106 | -7.186 |
| 7 | 102.95 | 110.274 | -7.324 |
| 8 | 103.02 | 110.656 | -7.636 |
| 9 | 104.08 | 111.986 | -7.906 |
| 10 | 104.16 | 112.19 | -8.03 |
| 11 | 104.24 | 112.274 | -8.03400000000001 |
| 12 | 104.33 | 110.49 | -6.16000000000002 |
| 13 | 104.73 | 108.764 | -4.03400000000005 |
| 14 | 104.86 | 109.146 | -4.28600000000000 |
| 15 | 105.03 | 109.21 | -4.18 |
| 16 | 105.62 | 109.726 | -4.10600000000000 |
| 17 | 105.63 | 109.768 | -4.13800000000001 |
| 18 | 105.63 | 110.106 | -4.476 |
| 19 | 105.94 | 110.274 | -4.334 |
| 20 | 106.61 | 110.656 | -4.046 |
| 21 | 107.69 | 111.986 | -4.296 |
| 22 | 107.78 | 112.19 | -4.41 |
| 23 | 107.93 | 112.274 | -4.34400000000000 |
| 24 | 108.48 | 110.49 | -2.01000000000001 |
| 25 | 108.14 | 108.764 | -0.624000000000049 |
| 26 | 108.48 | 109.146 | -0.665999999999991 |
| 27 | 108.48 | 109.21 | -0.729999999999995 |
| 28 | 108.89 | 109.726 | -0.836 |
| 29 | 108.93 | 109.768 | -0.837999999999997 |
| 30 | 109.21 | 110.106 | -0.896000000000005 |
| 31 | 109.47 | 110.274 | -0.804 |
| 32 | 109.8 | 110.656 | -0.856 |
| 33 | 111.73 | 111.986 | -0.255999999999996 |
| 34 | 111.85 | 112.19 | -0.340000000000002 |
| 35 | 112.12 | 112.274 | -0.153999999999998 |
| 36 | 112.15 | 110.49 | 1.65999999999999 |
| 37 | 112.17 | 108.764 | 3.40599999999995 |
| 38 | 112.67 | 109.146 | 3.52400000000001 |
| 39 | 112.8 | 109.21 | 3.59 |
| 40 | 113.44 | 109.726 | 3.714 |
| 41 | 113.53 | 109.768 | 3.76200000000000 |
| 42 | 114.53 | 110.106 | 4.424 |
| 43 | 114.51 | 110.274 | 4.23600000000001 |
| 44 | 115.05 | 110.656 | 4.394 |
| 45 | 116.67 | 111.986 | 4.684 |
| 46 | 117.07 | 112.19 | 4.88 |
| 47 | 116.92 | 112.274 | 4.646 |
| 48 | 117 | 110.49 | 6.50999999999999 |
| 49 | 117.02 | 108.764 | 8.25599999999994 |
| 50 | 117.35 | 109.146 | 8.204 |
| 51 | 117.36 | 109.21 | 8.15 |
| 52 | 117.82 | 109.726 | 8.094 |
| 53 | 117.88 | 109.768 | 8.11199999999999 |
| 54 | 118.24 | 110.106 | 8.134 |
| 55 | 118.5 | 110.274 | 8.226 |
| 56 | 118.8 | 110.656 | 8.144 |
| 57 | 119.76 | 111.986 | 7.774 |
| 58 | 120.09 | 112.19 | 7.9 |
| 59 | 120.16 | 112.274 | 7.886 |
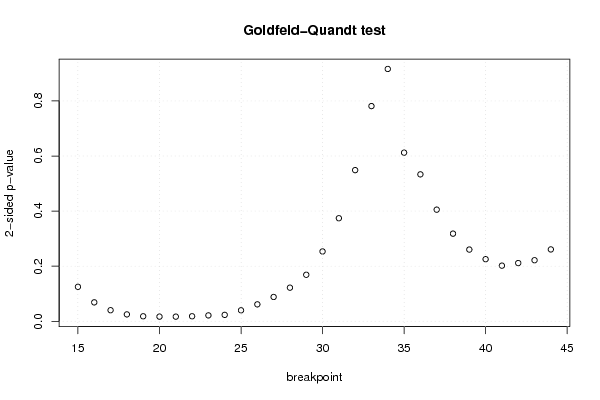
| Goldfeld-Quandt test for Heteroskedasticity | |||
| p-values | Alternative Hypothesis | ||
| breakpoint index | greater | 2-sided | less |
| 15 | 0.0625431275149165 | 0.125086255029833 | 0.937456872485083 |
| 16 | 0.0343463683012999 | 0.0686927366025997 | 0.9656536316987 |
| 17 | 0.0200632531385263 | 0.0401265062770526 | 0.979936746861474 |
| 18 | 0.0124966583389785 | 0.024993316677957 | 0.987503341661021 |
| 19 | 0.00904181575334084 | 0.0180836315066817 | 0.99095818424666 |
| 20 | 0.00838309046924735 | 0.0167661809384947 | 0.991616909530753 |
| 21 | 0.00837777033006432 | 0.0167555406601286 | 0.991622229669936 |
| 22 | 0.00906583787679538 | 0.0181316757535908 | 0.990934162123205 |
| 23 | 0.0106933044746504 | 0.0213866089493007 | 0.98930669552535 |
| 24 | 0.011628981160812 | 0.023257962321624 | 0.988371018839188 |
| 25 | 0.0199113719446392 | 0.0398227438892784 | 0.98008862805536 |
| 26 | 0.0307257853942331 | 0.0614515707884661 | 0.969274214605767 |
| 27 | 0.0441204005104185 | 0.088240801020837 | 0.955879599489582 |
| 28 | 0.060990700536247 | 0.121981401072494 | 0.939009299463753 |
| 29 | 0.0843838260014154 | 0.168767652002831 | 0.915616173998585 |
| 30 | 0.126727756521352 | 0.253455513042704 | 0.873272243478648 |
| 31 | 0.187037658629354 | 0.374075317258708 | 0.812962341370646 |
| 32 | 0.274353474425008 | 0.548706948850015 | 0.725646525574992 |
| 33 | 0.390595457388951 | 0.781190914777902 | 0.609404542611049 |
| 34 | 0.541988045063532 | 0.916023909872936 | 0.458011954936468 |
| 35 | 0.693945213381106 | 0.612109573237788 | 0.306054786618894 |
| 36 | 0.733319254071194 | 0.533361491857612 | 0.266680745928806 |
| 37 | 0.797414992803127 | 0.405170014393747 | 0.202585007196873 |
| 38 | 0.840950055903128 | 0.318099888193743 | 0.159049944096872 |
| 39 | 0.869832975124948 | 0.260334049750105 | 0.130167024875052 |
| 40 | 0.88729319770487 | 0.225413604590258 | 0.112706802295129 |
| 41 | 0.899020741137836 | 0.201958517724328 | 0.100979258862164 |
| 42 | 0.894357511222216 | 0.211284977555569 | 0.105642488777785 |
| 43 | 0.88918226793846 | 0.221635464123079 | 0.110817732061539 |
| 44 | 0.869580708478664 | 0.260838583042672 | 0.130419291521336 |
| Meta Analysis of Goldfeld-Quandt test for Heteroskedasticity | |||
| Description | # significant tests | % significant tests | OK/NOK |
| 1% type I error level | 0 | 0 | OK |
| 5% type I error level | 9 | 0.3 | NOK |
| 10% type I error level | 12 | 0.4 | NOK |