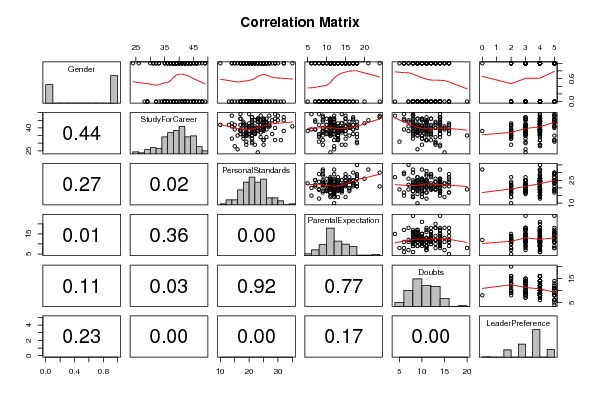
| Correlations for all pairs of data series with p-values |
| pair | Pearson r | Spearman rho | Kendall tau |
| Gender;StudyForCareer | 0.0641 | 0.0742 | 0.0623 |
| p-value | (0.444) | (0.3754) | (0.3736) |
| Gender;PersonalStandards | 0.093 | 0.1154 | 0.0976 |
| p-value | (0.2657) | (0.1668) | (0.166) |
| Gender;ParentalExpectation | 0.2246 | 0.2711 | 0.2317 |
| p-value | (0.0066) | (0.001) | (0.0011) |
| Gender;Doubts | -0.1338 | -0.1317 | -0.1134 |
| p-value | (0.1085) | (0.1144) | (0.1141) |
| Gender;LeaderPreference | 0.1003 | 0.1127 | 0.1046 |
| p-value | (0.2299) | (0.1773) | (0.1764) |
| StudyForCareer;PersonalStandards | 0.1965 | 0.2331 | 0.1762 |
| p-value | (0.0178) | (0.0048) | (0.003) |
| StudyForCareer;ParentalExpectation | 0.0766 | 0.0373 | 0.0282 |
| p-value | (0.3601) | (0.6556) | (0.6377) |
| StudyForCareer;Doubts | -0.1807 | -0.1619 | -0.1234 |
| p-value | (0.0296) | (0.0517) | (0.041) |
| StudyForCareer;LeaderPreference | 0.2954 | 0.3243 | 0.2594 |
| p-value | (3e-04) | (1e-04) | (1e-04) |
| PersonalStandards;ParentalExpectation | 0.2523 | 0.2081 | 0.1567 |
| p-value | (0.0022) | (0.012) | (0.0093) |
| PersonalStandards;Doubts | -0.0087 | 0.0311 | 0.0235 |
| p-value | (0.9175) | (0.7101) | (0.6984) |
| PersonalStandards;LeaderPreference | 0.2841 | 0.345 | 0.281 |
| p-value | (5e-04) | (0) | (0) |
| ParentalExpectation;Doubts | 0.0249 | 0.0273 | 0.0181 |
| p-value | (0.766) | (0.7442) | (0.7681) |
| ParentalExpectation;LeaderPreference | 0.1159 | 0.0701 | 0.0546 |
| p-value | (0.1652) | (0.4019) | (0.4088) |
| Doubts;LeaderPreference | -0.2633 | -0.2406 | -0.1948 |
| p-value | (0.0014) | (0.0036) | (0.0035) |