Free Statistics

of Irreproducible Research!

Author's title

Author*The author of this computation has been verified*
R Software Modulerwasp_multipleregression.wasp
Title produced by softwareMultiple Regression
Date of computationSat, 18 Dec 2010 15:51:20 +0000
Cite this page as followsStatistical Computations at FreeStatistics.org, Office for Research Development and Education, URL https://freestatistics.org/blog/index.php?v=date/2010/Dec/18/t1292687380rldkxksy1xl9nt0.htm/, Retrieved Tue, 30 Apr 2024 05:24:20 +0000
Statistical Computations at FreeStatistics.org, Office for Research Development and Education, URL https://freestatistics.org/blog/index.php?pk=112062, Retrieved Tue, 30 Apr 2024 05:24:20 +0000
QR Codes:

Original text written by user:
IsPrivate?No (this computation is public)
User-defined keywords
Estimated Impact199
Family? (F = Feedback message, R = changed R code, M = changed R Module, P = changed Parameters, D = changed Data)
-     [Multiple Regression] [Competence to learn] [2010-11-17 07:43:53] [b98453cac15ba1066b407e146608df68]
-   PD  [Multiple Regression] [Ws 7 - multiple r...] [2010-11-21 14:34:41] [603e2f5305d3a2a4e062624458fa1155]
-    D      [Multiple Regression] [PAPER - Multiple ...] [2010-12-18 15:51:20] [0829c729852d8a4b1b0c41cf0848af95] [Current]
-    D        [Multiple Regression] [PAPER - Multiple ...] [2010-12-18 16:50:17] [603e2f5305d3a2a4e062624458fa1155]
Feedback Forum

Post a new message
Dataseries X:
104,37	167.16	101,56	100,93
104,89	179.84	102,13	101,18
105,15	174.44	102,39	101,11
105,72	180.35	102,42	102,42
106,38	193.17	103,87	102,37
106,40	195.16	104,44	101,95
106,47	202.43	104,97	102,20
106,59	189.91	105,17	103,35
106,76	195.98	105,35	103,65
107,35	212.09	104,65	102,06
107,81	205.81	106,62	102,66
108,03	204.31	107,05	102,32
109,08	196.07	112,30	102,21
109,86	199.98	114,70	102,33
110,29	199.1	115,40	104,41
110,34	198.31	115,64	104,33
110,59	195.72	115,66	105,27
110,64	223.04	114,50	105,34
110,83	238.41	115,14	104,88
111,51	259.73	115,41	105,49
113,32	326.54	119,32	105,90
115,89	335.15	124,77	105,39
116,51	321.81	130,96	104,40
117,44	368.62	141,02	106,19
118,25	369.59	150,60	106,54
118,65	425	151,10	108,26
118,52	439.72	157,19	106,95
119,07	362.23	157,28	108,32
119,12	328.76	156,54	108,35
119,28	348.55	159,62	109,29
119,30	328.18	163,77	109,46
119,44	329.34	165,08	109,50
119,57	295.55	164,75	109,84
119,93	237.38	163,93	108,73
120,03	226.85	157,51	109,38
119,66	220.14	153,36	109,97
119,46	239.36	156,83	111,10
119,48	224.69	154,98	110,53
119,56	230.98	155,02	110,23
119,43	233.47	153,34	109,41
119,57	256.7	153,19	108,94
119,59	253.41	152,80	109,81
119,50	224.95	152,97	109,20
119,54	210.37	152,96	109,45
119,56	191.09	152,35	110,61
119,61	198.85	151,88	109,44
119,64	211.04	150,27	109,77
119,60	206.25	148,80	108,04
119,71	201.19	149,28	109,65
119,72	194.37	148,64	111,69
119,66	191.08	150,36	111,65
119,76	192.87	149,69	112,04
119,80	181.61	152,94	111,42
119,88	157.67	155,18	112,25
119,78	196.14	156,32	111,46
120,08	246.35	156,25	111,62
120,22	271.9 	155,52	111,77


Summary of computational transaction
Raw Inputview raw input (R code)
Raw Outputview raw output of R engine
Computing time5 seconds
R Server'RServer@AstonUniversity' @ vre.aston.ac.uk

\begin{tabular}{lllllllll}
\hline
Summary of computational transaction \tabularnewline
Raw Input & view raw input (R code)  \tabularnewline
Raw Output & view raw output of R engine  \tabularnewline
Computing time & 5 seconds \tabularnewline
R Server & 'RServer@AstonUniversity' @ vre.aston.ac.uk \tabularnewline
\hline
\end{tabular}
%Source: https://freestatistics.org/blog/index.php?pk=112062&T=0

[TABLE]
[ROW][C]Summary of computational transaction[/C][/ROW]
[ROW][C]Raw Input[/C][C]view raw input (R code) [/C][/ROW]
[ROW][C]Raw Output[/C][C]view raw output of R engine [/C][/ROW]
[ROW][C]Computing time[/C][C]5 seconds[/C][/ROW]
[ROW][C]R Server[/C][C]'RServer@AstonUniversity' @ vre.aston.ac.uk[/C][/ROW]
[/TABLE]
Source: https://freestatistics.org/blog/index.php?pk=112062&T=0

Globally Unique Identifier (entire table): ba.freestatistics.org/blog/index.php?pk=112062&T=0

As an alternative you can also use a QR Code:  

The GUIDs for individual cells are displayed in the table below:

Summary of computational transaction
Raw Inputview raw input (R code)
Raw Outputview raw output of R engine
Computing time5 seconds
R Server'RServer@AstonUniversity' @ vre.aston.ac.uk


Multiple Linear Regression - Estimated Regression Equation
Brood[t] = + 27.2751805068209 + 0.00711546804625393Tarwe[t] + 0.145572171967312Meel[t] + 0.618723143738309Water[t] + e[t]

\begin{tabular}{lllllllll}
\hline
Multiple Linear Regression - Estimated Regression Equation \tabularnewline
Brood[t] =  +  27.2751805068209 +  0.00711546804625393Tarwe[t] +  0.145572171967312Meel[t] +  0.618723143738309Water[t]  + e[t] \tabularnewline
\hline
\end{tabular}
%Source: https://freestatistics.org/blog/index.php?pk=112062&T=1

[TABLE]
[ROW][C]Multiple Linear Regression - Estimated Regression Equation[/C][/ROW]
[ROW][C]Brood[t] =  +  27.2751805068209 +  0.00711546804625393Tarwe[t] +  0.145572171967312Meel[t] +  0.618723143738309Water[t]  + e[t][/C][/ROW]
[/TABLE]
Source: https://freestatistics.org/blog/index.php?pk=112062&T=1

Globally Unique Identifier (entire table): ba.freestatistics.org/blog/index.php?pk=112062&T=1

As an alternative you can also use a QR Code:  

The GUIDs for individual cells are displayed in the table below:

Multiple Linear Regression - Estimated Regression Equation
Brood[t] = + 27.2751805068209 + 0.00711546804625393Tarwe[t] + 0.145572171967312Meel[t] + 0.618723143738309Water[t] + e[t]


Multiple Linear Regression - Ordinary Least Squares
VariableParameterS.D.T-STATH0: parameter = 02-tail p-value1-tail p-value
(Intercept)27.275180506820911.3254972.40830.0195380.009769
Tarwe0.007115468046253930.0029112.44430.0178750.008937
Meel0.1455721719673120.0215066.768900
Water0.6187231437383090.1275044.85261.1e-056e-06

\begin{tabular}{lllllllll}
\hline
Multiple Linear Regression - Ordinary Least Squares \tabularnewline
Variable & Parameter & S.D. & T-STATH0: parameter = 0 & 2-tail p-value & 1-tail p-value \tabularnewline
(Intercept) & 27.2751805068209 & 11.325497 & 2.4083 & 0.019538 & 0.009769 \tabularnewline
Tarwe & 0.00711546804625393 & 0.002911 & 2.4443 & 0.017875 & 0.008937 \tabularnewline
Meel & 0.145572171967312 & 0.021506 & 6.7689 & 0 & 0 \tabularnewline
Water & 0.618723143738309 & 0.127504 & 4.8526 & 1.1e-05 & 6e-06 \tabularnewline
\hline
\end{tabular}
%Source: https://freestatistics.org/blog/index.php?pk=112062&T=2

[TABLE]
[ROW][C]Multiple Linear Regression - Ordinary Least Squares[/C][/ROW]
[ROW][C]Variable[/C][C]Parameter[/C][C]S.D.[/C][C]T-STATH0: parameter = 0[/C][C]2-tail p-value[/C][C]1-tail p-value[/C][/ROW]
[ROW][C](Intercept)[/C][C]27.2751805068209[/C][C]11.325497[/C][C]2.4083[/C][C]0.019538[/C][C]0.009769[/C][/ROW]
[ROW][C]Tarwe[/C][C]0.00711546804625393[/C][C]0.002911[/C][C]2.4443[/C][C]0.017875[/C][C]0.008937[/C][/ROW]
[ROW][C]Meel[/C][C]0.145572171967312[/C][C]0.021506[/C][C]6.7689[/C][C]0[/C][C]0[/C][/ROW]
[ROW][C]Water[/C][C]0.618723143738309[/C][C]0.127504[/C][C]4.8526[/C][C]1.1e-05[/C][C]6e-06[/C][/ROW]
[/TABLE]
Source: https://freestatistics.org/blog/index.php?pk=112062&T=2

Globally Unique Identifier (entire table): ba.freestatistics.org/blog/index.php?pk=112062&T=2

As an alternative you can also use a QR Code:  

The GUIDs for individual cells are displayed in the table below:

Multiple Linear Regression - Ordinary Least Squares
VariableParameterS.D.T-STATH0: parameter = 02-tail p-value1-tail p-value
(Intercept)27.275180506820911.3254972.40830.0195380.009769
Tarwe0.007115468046253930.0029112.44430.0178750.008937
Meel0.1455721719673120.0215066.768900
Water0.6187231437383090.1275044.85261.1e-056e-06


Multiple Linear Regression - Regression Statistics
Multiple R0.98180639943996
R-squared0.963943805981258
Adjusted R-squared0.961902889338687
F-TEST (value)472.309248636078
F-TEST (DF numerator)3
F-TEST (DF denominator)53
p-value0
Multiple Linear Regression - Residual Statistics
Residual Standard Deviation1.09978300867724
Sum Squared Residuals64.1047013072841

\begin{tabular}{lllllllll}
\hline
Multiple Linear Regression - Regression Statistics \tabularnewline
Multiple R & 0.98180639943996 \tabularnewline
R-squared & 0.963943805981258 \tabularnewline
Adjusted R-squared & 0.961902889338687 \tabularnewline
F-TEST (value) & 472.309248636078 \tabularnewline
F-TEST (DF numerator) & 3 \tabularnewline
F-TEST (DF denominator) & 53 \tabularnewline
p-value & 0 \tabularnewline
Multiple Linear Regression - Residual Statistics \tabularnewline
Residual Standard Deviation & 1.09978300867724 \tabularnewline
Sum Squared Residuals & 64.1047013072841 \tabularnewline
\hline
\end{tabular}
%Source: https://freestatistics.org/blog/index.php?pk=112062&T=3

[TABLE]
[ROW][C]Multiple Linear Regression - Regression Statistics[/C][/ROW]
[ROW][C]Multiple R[/C][C]0.98180639943996[/C][/ROW]
[ROW][C]R-squared[/C][C]0.963943805981258[/C][/ROW]
[ROW][C]Adjusted R-squared[/C][C]0.961902889338687[/C][/ROW]
[ROW][C]F-TEST (value)[/C][C]472.309248636078[/C][/ROW]
[ROW][C]F-TEST (DF numerator)[/C][C]3[/C][/ROW]
[ROW][C]F-TEST (DF denominator)[/C][C]53[/C][/ROW]
[ROW][C]p-value[/C][C]0[/C][/ROW]
[ROW][C]Multiple Linear Regression - Residual Statistics[/C][/ROW]
[ROW][C]Residual Standard Deviation[/C][C]1.09978300867724[/C][/ROW]
[ROW][C]Sum Squared Residuals[/C][C]64.1047013072841[/C][/ROW]
[/TABLE]
Source: https://freestatistics.org/blog/index.php?pk=112062&T=3

Globally Unique Identifier (entire table): ba.freestatistics.org/blog/index.php?pk=112062&T=3

As an alternative you can also use a QR Code:  

The GUIDs for individual cells are displayed in the table below:

Multiple Linear Regression - Regression Statistics
Multiple R0.98180639943996
R-squared0.963943805981258
Adjusted R-squared0.961902889338687
F-TEST (value)472.309248636078
F-TEST (DF numerator)3
F-TEST (DF denominator)53
p-value0
Multiple Linear Regression - Residual Statistics
Residual Standard Deviation1.09978300867724
Sum Squared Residuals64.1047013072841


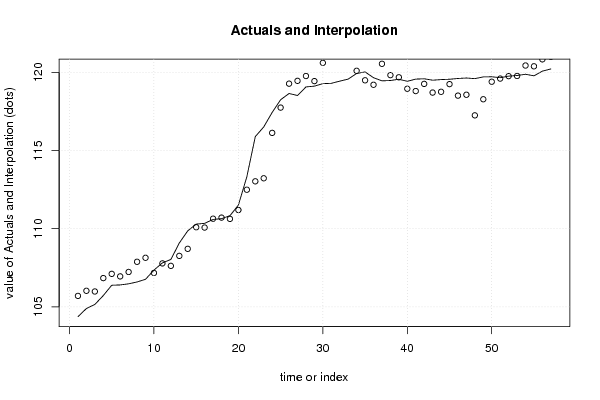
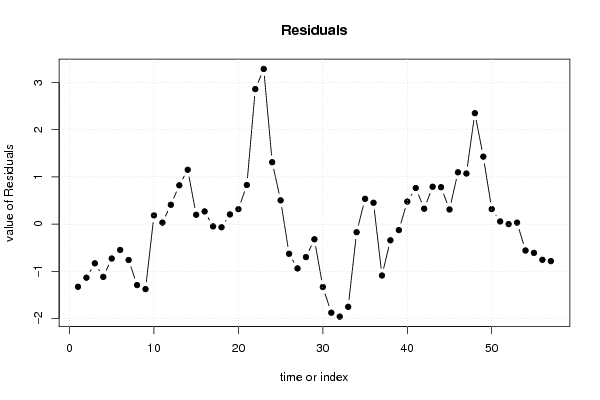
Multiple Linear Regression - Actuals, Interpolation, and Residuals
Time or IndexActualsInterpolationForecastResidualsPrediction Error
1104.37105.69663882794-1.32663882794046
2104.89106.024519886723-1.1345198867229
3105.15105.980634503923-0.830634503922941
4105.72106.837581403533-1.11758140353251
5106.38107.108945196051-0.728945196051182
6106.4106.946217395115-0.546217395114492
7106.47107.229780884888-0.759780884888019
8106.59107.881341274641-1.29134127464143
9106.76108.136352099758-1.3763520997578
10107.35107.1653119710620.184688028938067
11107.81107.778637896750.0313621032499622
12108.03107.6201948597560.409805140244426
13109.08108.2577577600720.82224223992838
14109.86108.7091992301031.15080076989738
15110.29110.0917822775750.198217722425288
16110.34110.0716005275910.268399472408735
17110.59110.637682663905-0.0476826639048221
18110.64110.706524151508-0.0665241515080871
19110.83110.6244424393180.205557560681535
20111.51111.1928698221760.317130177823866
21113.32112.4911179236710.828882076328725
22115.89113.0302016374652.85979836253518
23116.51113.2238371259053.28616287409547
24117.44116.1288826624321.31111733756758
25118.25117.7469191741930.503080825807459
26118.65119.278177151849-0.628177151849014
27118.52119.458924050474-0.938924050473626
28119.07119.768298633968-0.698298633967948
29119.12119.440982205516-0.320982205516155
30119.28120.611759362925-1.33175936292486
31119.3121.176124726923-1.87612472692253
32119.44121.399827140883-1.9598271408829
33119.57121.321722527722-1.75172252772179
34119.93120.101663880908-0.17166388090847
35120.03119.4943347017810.535665298218829
36119.66119.2075120523320.452487947667925
37119.46120.548563937332-1.08856393733194
38119.48119.822199311023-0.34219931102302
39119.56119.687161548791-0.127161548791163
40119.43118.9529648374560.477035162544173
41119.57118.8056214568180.764378543181783
42119.59119.2637275549310.326272445068886
43119.5118.7085474858890.791452514111197
44119.54118.7580290259890.78197097401068
45119.56119.2497626238940.310237376106077
46119.61118.5126536569341.0973463430656
47119.64118.5691986529841.0708013470155
48119.6117.2507334295842.34926657041626
49119.71118.2807480652331.42925193476732
50119.72119.4012495963240.318750403675717
51119.66119.6034749164860.0565250835136374
52119.76119.7599802751291.9724871011073e-05
53119.8119.7693613147040.0306386852958137
54119.88120.438638884186-0.558638884186446
55119.78120.389531932415-0.609531932415295
56120.08120.835605233978-0.755605233978133
57120.22121.003946228585-0.783946228584525

\begin{tabular}{lllllllll}
\hline
Multiple Linear Regression - Actuals, Interpolation, and Residuals \tabularnewline
Time or Index & Actuals & InterpolationForecast & ResidualsPrediction Error \tabularnewline
1 & 104.37 & 105.69663882794 & -1.32663882794046 \tabularnewline
2 & 104.89 & 106.024519886723 & -1.1345198867229 \tabularnewline
3 & 105.15 & 105.980634503923 & -0.830634503922941 \tabularnewline
4 & 105.72 & 106.837581403533 & -1.11758140353251 \tabularnewline
5 & 106.38 & 107.108945196051 & -0.728945196051182 \tabularnewline
6 & 106.4 & 106.946217395115 & -0.546217395114492 \tabularnewline
7 & 106.47 & 107.229780884888 & -0.759780884888019 \tabularnewline
8 & 106.59 & 107.881341274641 & -1.29134127464143 \tabularnewline
9 & 106.76 & 108.136352099758 & -1.3763520997578 \tabularnewline
10 & 107.35 & 107.165311971062 & 0.184688028938067 \tabularnewline
11 & 107.81 & 107.77863789675 & 0.0313621032499622 \tabularnewline
12 & 108.03 & 107.620194859756 & 0.409805140244426 \tabularnewline
13 & 109.08 & 108.257757760072 & 0.82224223992838 \tabularnewline
14 & 109.86 & 108.709199230103 & 1.15080076989738 \tabularnewline
15 & 110.29 & 110.091782277575 & 0.198217722425288 \tabularnewline
16 & 110.34 & 110.071600527591 & 0.268399472408735 \tabularnewline
17 & 110.59 & 110.637682663905 & -0.0476826639048221 \tabularnewline
18 & 110.64 & 110.706524151508 & -0.0665241515080871 \tabularnewline
19 & 110.83 & 110.624442439318 & 0.205557560681535 \tabularnewline
20 & 111.51 & 111.192869822176 & 0.317130177823866 \tabularnewline
21 & 113.32 & 112.491117923671 & 0.828882076328725 \tabularnewline
22 & 115.89 & 113.030201637465 & 2.85979836253518 \tabularnewline
23 & 116.51 & 113.223837125905 & 3.28616287409547 \tabularnewline
24 & 117.44 & 116.128882662432 & 1.31111733756758 \tabularnewline
25 & 118.25 & 117.746919174193 & 0.503080825807459 \tabularnewline
26 & 118.65 & 119.278177151849 & -0.628177151849014 \tabularnewline
27 & 118.52 & 119.458924050474 & -0.938924050473626 \tabularnewline
28 & 119.07 & 119.768298633968 & -0.698298633967948 \tabularnewline
29 & 119.12 & 119.440982205516 & -0.320982205516155 \tabularnewline
30 & 119.28 & 120.611759362925 & -1.33175936292486 \tabularnewline
31 & 119.3 & 121.176124726923 & -1.87612472692253 \tabularnewline
32 & 119.44 & 121.399827140883 & -1.9598271408829 \tabularnewline
33 & 119.57 & 121.321722527722 & -1.75172252772179 \tabularnewline
34 & 119.93 & 120.101663880908 & -0.17166388090847 \tabularnewline
35 & 120.03 & 119.494334701781 & 0.535665298218829 \tabularnewline
36 & 119.66 & 119.207512052332 & 0.452487947667925 \tabularnewline
37 & 119.46 & 120.548563937332 & -1.08856393733194 \tabularnewline
38 & 119.48 & 119.822199311023 & -0.34219931102302 \tabularnewline
39 & 119.56 & 119.687161548791 & -0.127161548791163 \tabularnewline
40 & 119.43 & 118.952964837456 & 0.477035162544173 \tabularnewline
41 & 119.57 & 118.805621456818 & 0.764378543181783 \tabularnewline
42 & 119.59 & 119.263727554931 & 0.326272445068886 \tabularnewline
43 & 119.5 & 118.708547485889 & 0.791452514111197 \tabularnewline
44 & 119.54 & 118.758029025989 & 0.78197097401068 \tabularnewline
45 & 119.56 & 119.249762623894 & 0.310237376106077 \tabularnewline
46 & 119.61 & 118.512653656934 & 1.0973463430656 \tabularnewline
47 & 119.64 & 118.569198652984 & 1.0708013470155 \tabularnewline
48 & 119.6 & 117.250733429584 & 2.34926657041626 \tabularnewline
49 & 119.71 & 118.280748065233 & 1.42925193476732 \tabularnewline
50 & 119.72 & 119.401249596324 & 0.318750403675717 \tabularnewline
51 & 119.66 & 119.603474916486 & 0.0565250835136374 \tabularnewline
52 & 119.76 & 119.759980275129 & 1.9724871011073e-05 \tabularnewline
53 & 119.8 & 119.769361314704 & 0.0306386852958137 \tabularnewline
54 & 119.88 & 120.438638884186 & -0.558638884186446 \tabularnewline
55 & 119.78 & 120.389531932415 & -0.609531932415295 \tabularnewline
56 & 120.08 & 120.835605233978 & -0.755605233978133 \tabularnewline
57 & 120.22 & 121.003946228585 & -0.783946228584525 \tabularnewline
\hline
\end{tabular}
%Source: https://freestatistics.org/blog/index.php?pk=112062&T=4

[TABLE]
[ROW][C]Multiple Linear Regression - Actuals, Interpolation, and Residuals[/C][/ROW]
[ROW][C]Time or Index[/C][C]Actuals[/C][C]InterpolationForecast[/C][C]ResidualsPrediction Error[/C][/ROW]
[ROW][C]1[/C][C]104.37[/C][C]105.69663882794[/C][C]-1.32663882794046[/C][/ROW]
[ROW][C]2[/C][C]104.89[/C][C]106.024519886723[/C][C]-1.1345198867229[/C][/ROW]
[ROW][C]3[/C][C]105.15[/C][C]105.980634503923[/C][C]-0.830634503922941[/C][/ROW]
[ROW][C]4[/C][C]105.72[/C][C]106.837581403533[/C][C]-1.11758140353251[/C][/ROW]
[ROW][C]5[/C][C]106.38[/C][C]107.108945196051[/C][C]-0.728945196051182[/C][/ROW]
[ROW][C]6[/C][C]106.4[/C][C]106.946217395115[/C][C]-0.546217395114492[/C][/ROW]
[ROW][C]7[/C][C]106.47[/C][C]107.229780884888[/C][C]-0.759780884888019[/C][/ROW]
[ROW][C]8[/C][C]106.59[/C][C]107.881341274641[/C][C]-1.29134127464143[/C][/ROW]
[ROW][C]9[/C][C]106.76[/C][C]108.136352099758[/C][C]-1.3763520997578[/C][/ROW]
[ROW][C]10[/C][C]107.35[/C][C]107.165311971062[/C][C]0.184688028938067[/C][/ROW]
[ROW][C]11[/C][C]107.81[/C][C]107.77863789675[/C][C]0.0313621032499622[/C][/ROW]
[ROW][C]12[/C][C]108.03[/C][C]107.620194859756[/C][C]0.409805140244426[/C][/ROW]
[ROW][C]13[/C][C]109.08[/C][C]108.257757760072[/C][C]0.82224223992838[/C][/ROW]
[ROW][C]14[/C][C]109.86[/C][C]108.709199230103[/C][C]1.15080076989738[/C][/ROW]
[ROW][C]15[/C][C]110.29[/C][C]110.091782277575[/C][C]0.198217722425288[/C][/ROW]
[ROW][C]16[/C][C]110.34[/C][C]110.071600527591[/C][C]0.268399472408735[/C][/ROW]
[ROW][C]17[/C][C]110.59[/C][C]110.637682663905[/C][C]-0.0476826639048221[/C][/ROW]
[ROW][C]18[/C][C]110.64[/C][C]110.706524151508[/C][C]-0.0665241515080871[/C][/ROW]
[ROW][C]19[/C][C]110.83[/C][C]110.624442439318[/C][C]0.205557560681535[/C][/ROW]
[ROW][C]20[/C][C]111.51[/C][C]111.192869822176[/C][C]0.317130177823866[/C][/ROW]
[ROW][C]21[/C][C]113.32[/C][C]112.491117923671[/C][C]0.828882076328725[/C][/ROW]
[ROW][C]22[/C][C]115.89[/C][C]113.030201637465[/C][C]2.85979836253518[/C][/ROW]
[ROW][C]23[/C][C]116.51[/C][C]113.223837125905[/C][C]3.28616287409547[/C][/ROW]
[ROW][C]24[/C][C]117.44[/C][C]116.128882662432[/C][C]1.31111733756758[/C][/ROW]
[ROW][C]25[/C][C]118.25[/C][C]117.746919174193[/C][C]0.503080825807459[/C][/ROW]
[ROW][C]26[/C][C]118.65[/C][C]119.278177151849[/C][C]-0.628177151849014[/C][/ROW]
[ROW][C]27[/C][C]118.52[/C][C]119.458924050474[/C][C]-0.938924050473626[/C][/ROW]
[ROW][C]28[/C][C]119.07[/C][C]119.768298633968[/C][C]-0.698298633967948[/C][/ROW]
[ROW][C]29[/C][C]119.12[/C][C]119.440982205516[/C][C]-0.320982205516155[/C][/ROW]
[ROW][C]30[/C][C]119.28[/C][C]120.611759362925[/C][C]-1.33175936292486[/C][/ROW]
[ROW][C]31[/C][C]119.3[/C][C]121.176124726923[/C][C]-1.87612472692253[/C][/ROW]
[ROW][C]32[/C][C]119.44[/C][C]121.399827140883[/C][C]-1.9598271408829[/C][/ROW]
[ROW][C]33[/C][C]119.57[/C][C]121.321722527722[/C][C]-1.75172252772179[/C][/ROW]
[ROW][C]34[/C][C]119.93[/C][C]120.101663880908[/C][C]-0.17166388090847[/C][/ROW]
[ROW][C]35[/C][C]120.03[/C][C]119.494334701781[/C][C]0.535665298218829[/C][/ROW]
[ROW][C]36[/C][C]119.66[/C][C]119.207512052332[/C][C]0.452487947667925[/C][/ROW]
[ROW][C]37[/C][C]119.46[/C][C]120.548563937332[/C][C]-1.08856393733194[/C][/ROW]
[ROW][C]38[/C][C]119.48[/C][C]119.822199311023[/C][C]-0.34219931102302[/C][/ROW]
[ROW][C]39[/C][C]119.56[/C][C]119.687161548791[/C][C]-0.127161548791163[/C][/ROW]
[ROW][C]40[/C][C]119.43[/C][C]118.952964837456[/C][C]0.477035162544173[/C][/ROW]
[ROW][C]41[/C][C]119.57[/C][C]118.805621456818[/C][C]0.764378543181783[/C][/ROW]
[ROW][C]42[/C][C]119.59[/C][C]119.263727554931[/C][C]0.326272445068886[/C][/ROW]
[ROW][C]43[/C][C]119.5[/C][C]118.708547485889[/C][C]0.791452514111197[/C][/ROW]
[ROW][C]44[/C][C]119.54[/C][C]118.758029025989[/C][C]0.78197097401068[/C][/ROW]
[ROW][C]45[/C][C]119.56[/C][C]119.249762623894[/C][C]0.310237376106077[/C][/ROW]
[ROW][C]46[/C][C]119.61[/C][C]118.512653656934[/C][C]1.0973463430656[/C][/ROW]
[ROW][C]47[/C][C]119.64[/C][C]118.569198652984[/C][C]1.0708013470155[/C][/ROW]
[ROW][C]48[/C][C]119.6[/C][C]117.250733429584[/C][C]2.34926657041626[/C][/ROW]
[ROW][C]49[/C][C]119.71[/C][C]118.280748065233[/C][C]1.42925193476732[/C][/ROW]
[ROW][C]50[/C][C]119.72[/C][C]119.401249596324[/C][C]0.318750403675717[/C][/ROW]
[ROW][C]51[/C][C]119.66[/C][C]119.603474916486[/C][C]0.0565250835136374[/C][/ROW]
[ROW][C]52[/C][C]119.76[/C][C]119.759980275129[/C][C]1.9724871011073e-05[/C][/ROW]
[ROW][C]53[/C][C]119.8[/C][C]119.769361314704[/C][C]0.0306386852958137[/C][/ROW]
[ROW][C]54[/C][C]119.88[/C][C]120.438638884186[/C][C]-0.558638884186446[/C][/ROW]
[ROW][C]55[/C][C]119.78[/C][C]120.389531932415[/C][C]-0.609531932415295[/C][/ROW]
[ROW][C]56[/C][C]120.08[/C][C]120.835605233978[/C][C]-0.755605233978133[/C][/ROW]
[ROW][C]57[/C][C]120.22[/C][C]121.003946228585[/C][C]-0.783946228584525[/C][/ROW]
[/TABLE]
Source: https://freestatistics.org/blog/index.php?pk=112062&T=4

Globally Unique Identifier (entire table): ba.freestatistics.org/blog/index.php?pk=112062&T=4

As an alternative you can also use a QR Code:  

The GUIDs for individual cells are displayed in the table below:

Multiple Linear Regression - Actuals, Interpolation, and Residuals
Time or IndexActualsInterpolationForecastResidualsPrediction Error
1104.37105.69663882794-1.32663882794046
2104.89106.024519886723-1.1345198867229
3105.15105.980634503923-0.830634503922941
4105.72106.837581403533-1.11758140353251
5106.38107.108945196051-0.728945196051182
6106.4106.946217395115-0.546217395114492
7106.47107.229780884888-0.759780884888019
8106.59107.881341274641-1.29134127464143
9106.76108.136352099758-1.3763520997578
10107.35107.1653119710620.184688028938067
11107.81107.778637896750.0313621032499622
12108.03107.6201948597560.409805140244426
13109.08108.2577577600720.82224223992838
14109.86108.7091992301031.15080076989738
15110.29110.0917822775750.198217722425288
16110.34110.0716005275910.268399472408735
17110.59110.637682663905-0.0476826639048221
18110.64110.706524151508-0.0665241515080871
19110.83110.6244424393180.205557560681535
20111.51111.1928698221760.317130177823866
21113.32112.4911179236710.828882076328725
22115.89113.0302016374652.85979836253518
23116.51113.2238371259053.28616287409547
24117.44116.1288826624321.31111733756758
25118.25117.7469191741930.503080825807459
26118.65119.278177151849-0.628177151849014
27118.52119.458924050474-0.938924050473626
28119.07119.768298633968-0.698298633967948
29119.12119.440982205516-0.320982205516155
30119.28120.611759362925-1.33175936292486
31119.3121.176124726923-1.87612472692253
32119.44121.399827140883-1.9598271408829
33119.57121.321722527722-1.75172252772179
34119.93120.101663880908-0.17166388090847
35120.03119.4943347017810.535665298218829
36119.66119.2075120523320.452487947667925
37119.46120.548563937332-1.08856393733194
38119.48119.822199311023-0.34219931102302
39119.56119.687161548791-0.127161548791163
40119.43118.9529648374560.477035162544173
41119.57118.8056214568180.764378543181783
42119.59119.2637275549310.326272445068886
43119.5118.7085474858890.791452514111197
44119.54118.7580290259890.78197097401068
45119.56119.2497626238940.310237376106077
46119.61118.5126536569341.0973463430656
47119.64118.5691986529841.0708013470155
48119.6117.2507334295842.34926657041626
49119.71118.2807480652331.42925193476732
50119.72119.4012495963240.318750403675717
51119.66119.6034749164860.0565250835136374
52119.76119.7599802751291.9724871011073e-05
53119.8119.7693613147040.0306386852958137
54119.88120.438638884186-0.558638884186446
55119.78120.389531932415-0.609531932415295
56120.08120.835605233978-0.755605233978133
57120.22121.003946228585-0.783946228584525


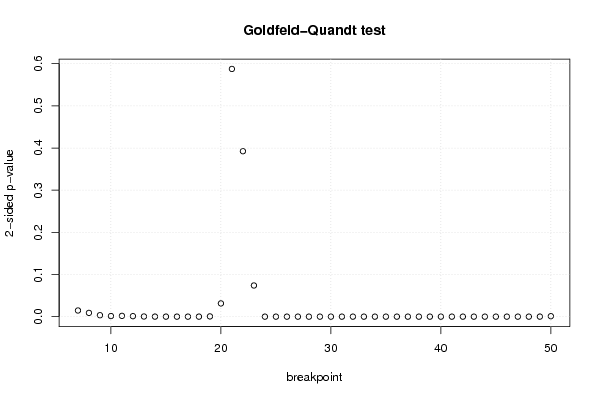
Goldfeld-Quandt test for Heteroskedasticity
p-valuesAlternative Hypothesis
breakpoint indexgreater2-sidedless
70.007317600013965930.01463520002793190.992682399986034
80.004451914592635270.008903829185270530.995548085407365
90.001694698473031570.003389396946063150.998305301526968
100.000727461244827250.00145492248965450.999272538755173
110.00092635754062630.00185271508125260.999073642459374
120.0005818512168050940.001163702433610190.999418148783195
130.0001786625376571910.0003573250753143830.999821337462343
145.3286328930436e-050.0001065726578608720.99994671367107
151.70026493308216e-053.40052986616432e-050.99998299735067
166.30884262379384e-061.26176852475877e-050.999993691157376
174.79873349175221e-069.59746698350443e-060.999995201266508
181.09352375949204e-052.18704751898408e-050.999989064762405
190.000298426506903460.000596853013806920.999701573493097
200.01571271440194130.03142542880388250.98428728559806
210.7062043226793060.5875913546413880.293795677320694
220.8037784621347480.3924430757305040.196221537865252
230.9630230153079930.07395396938401510.0369769846920075
240.999999986709352.65813005598526e-081.32906502799263e-08
250.9999999999901311.97370688609101e-119.86853443045504e-12
260.9999999999996976.06330792741829e-133.03165396370914e-13
270.9999999999999529.55705546408133e-144.77852773204066e-14
280.9999999999998333.33054101238272e-131.66527050619136e-13
290.9999999999993781.24387636905123e-126.21938184525613e-13
300.999999999998013.98160243773045e-121.99080121886522e-12
310.9999999999966536.69464902705846e-123.34732451352923e-12
320.9999999999933071.33854610639422e-116.69273053197109e-12
330.9999999999889272.21466824403792e-111.10733412201896e-11
340.9999999999843823.12352504036653e-111.56176252018327e-11
350.9999999999982623.47644760463728e-121.73822380231864e-12
360.9999999999918761.62481846061782e-118.12409230308911e-12
370.9999999999927571.44863521523635e-117.24317607618173e-12
380.9999999999869962.60078829997037e-111.30039414998518e-11
390.9999999999507189.85648796235672e-114.92824398117836e-11
400.9999999999096941.80611352307819e-109.03056761539094e-11
410.999999999540239.1954135768042e-104.5977067884021e-10
420.999999999145221.70955901691853e-098.54779508459265e-10
430.9999999984418023.11639614380511e-091.55819807190256e-09
440.9999999956829548.63409201901848e-094.31704600950924e-09
450.999999989230932.15381424229861e-081.0769071211493e-08
460.9999999078697941.84260412097819e-079.21302060489093e-08
470.9999992390171171.52196576556385e-067.60982882781923e-07
480.9999915807883951.68384232104029e-058.41921160520143e-06
490.9999652902117456.94195765107814e-053.47097882553907e-05
500.999464647035770.001070705928458640.00053535296422932

\begin{tabular}{lllllllll}
\hline
Goldfeld-Quandt test for Heteroskedasticity \tabularnewline
p-values & Alternative Hypothesis \tabularnewline
breakpoint index & greater & 2-sided & less \tabularnewline
7 & 0.00731760001396593 & 0.0146352000279319 & 0.992682399986034 \tabularnewline
8 & 0.00445191459263527 & 0.00890382918527053 & 0.995548085407365 \tabularnewline
9 & 0.00169469847303157 & 0.00338939694606315 & 0.998305301526968 \tabularnewline
10 & 0.00072746124482725 & 0.0014549224896545 & 0.999272538755173 \tabularnewline
11 & 0.0009263575406263 & 0.0018527150812526 & 0.999073642459374 \tabularnewline
12 & 0.000581851216805094 & 0.00116370243361019 & 0.999418148783195 \tabularnewline
13 & 0.000178662537657191 & 0.000357325075314383 & 0.999821337462343 \tabularnewline
14 & 5.3286328930436e-05 & 0.000106572657860872 & 0.99994671367107 \tabularnewline
15 & 1.70026493308216e-05 & 3.40052986616432e-05 & 0.99998299735067 \tabularnewline
16 & 6.30884262379384e-06 & 1.26176852475877e-05 & 0.999993691157376 \tabularnewline
17 & 4.79873349175221e-06 & 9.59746698350443e-06 & 0.999995201266508 \tabularnewline
18 & 1.09352375949204e-05 & 2.18704751898408e-05 & 0.999989064762405 \tabularnewline
19 & 0.00029842650690346 & 0.00059685301380692 & 0.999701573493097 \tabularnewline
20 & 0.0157127144019413 & 0.0314254288038825 & 0.98428728559806 \tabularnewline
21 & 0.706204322679306 & 0.587591354641388 & 0.293795677320694 \tabularnewline
22 & 0.803778462134748 & 0.392443075730504 & 0.196221537865252 \tabularnewline
23 & 0.963023015307993 & 0.0739539693840151 & 0.0369769846920075 \tabularnewline
24 & 0.99999998670935 & 2.65813005598526e-08 & 1.32906502799263e-08 \tabularnewline
25 & 0.999999999990131 & 1.97370688609101e-11 & 9.86853443045504e-12 \tabularnewline
26 & 0.999999999999697 & 6.06330792741829e-13 & 3.03165396370914e-13 \tabularnewline
27 & 0.999999999999952 & 9.55705546408133e-14 & 4.77852773204066e-14 \tabularnewline
28 & 0.999999999999833 & 3.33054101238272e-13 & 1.66527050619136e-13 \tabularnewline
29 & 0.999999999999378 & 1.24387636905123e-12 & 6.21938184525613e-13 \tabularnewline
30 & 0.99999999999801 & 3.98160243773045e-12 & 1.99080121886522e-12 \tabularnewline
31 & 0.999999999996653 & 6.69464902705846e-12 & 3.34732451352923e-12 \tabularnewline
32 & 0.999999999993307 & 1.33854610639422e-11 & 6.69273053197109e-12 \tabularnewline
33 & 0.999999999988927 & 2.21466824403792e-11 & 1.10733412201896e-11 \tabularnewline
34 & 0.999999999984382 & 3.12352504036653e-11 & 1.56176252018327e-11 \tabularnewline
35 & 0.999999999998262 & 3.47644760463728e-12 & 1.73822380231864e-12 \tabularnewline
36 & 0.999999999991876 & 1.62481846061782e-11 & 8.12409230308911e-12 \tabularnewline
37 & 0.999999999992757 & 1.44863521523635e-11 & 7.24317607618173e-12 \tabularnewline
38 & 0.999999999986996 & 2.60078829997037e-11 & 1.30039414998518e-11 \tabularnewline
39 & 0.999999999950718 & 9.85648796235672e-11 & 4.92824398117836e-11 \tabularnewline
40 & 0.999999999909694 & 1.80611352307819e-10 & 9.03056761539094e-11 \tabularnewline
41 & 0.99999999954023 & 9.1954135768042e-10 & 4.5977067884021e-10 \tabularnewline
42 & 0.99999999914522 & 1.70955901691853e-09 & 8.54779508459265e-10 \tabularnewline
43 & 0.999999998441802 & 3.11639614380511e-09 & 1.55819807190256e-09 \tabularnewline
44 & 0.999999995682954 & 8.63409201901848e-09 & 4.31704600950924e-09 \tabularnewline
45 & 0.99999998923093 & 2.15381424229861e-08 & 1.0769071211493e-08 \tabularnewline
46 & 0.999999907869794 & 1.84260412097819e-07 & 9.21302060489093e-08 \tabularnewline
47 & 0.999999239017117 & 1.52196576556385e-06 & 7.60982882781923e-07 \tabularnewline
48 & 0.999991580788395 & 1.68384232104029e-05 & 8.41921160520143e-06 \tabularnewline
49 & 0.999965290211745 & 6.94195765107814e-05 & 3.47097882553907e-05 \tabularnewline
50 & 0.99946464703577 & 0.00107070592845864 & 0.00053535296422932 \tabularnewline
\hline
\end{tabular}
%Source: https://freestatistics.org/blog/index.php?pk=112062&T=5

[TABLE]
[ROW][C]Goldfeld-Quandt test for Heteroskedasticity[/C][/ROW]
[ROW][C]p-values[/C][C]Alternative Hypothesis[/C][/ROW]
[ROW][C]breakpoint index[/C][C]greater[/C][C]2-sided[/C][C]less[/C][/ROW]
[ROW][C]7[/C][C]0.00731760001396593[/C][C]0.0146352000279319[/C][C]0.992682399986034[/C][/ROW]
[ROW][C]8[/C][C]0.00445191459263527[/C][C]0.00890382918527053[/C][C]0.995548085407365[/C][/ROW]
[ROW][C]9[/C][C]0.00169469847303157[/C][C]0.00338939694606315[/C][C]0.998305301526968[/C][/ROW]
[ROW][C]10[/C][C]0.00072746124482725[/C][C]0.0014549224896545[/C][C]0.999272538755173[/C][/ROW]
[ROW][C]11[/C][C]0.0009263575406263[/C][C]0.0018527150812526[/C][C]0.999073642459374[/C][/ROW]
[ROW][C]12[/C][C]0.000581851216805094[/C][C]0.00116370243361019[/C][C]0.999418148783195[/C][/ROW]
[ROW][C]13[/C][C]0.000178662537657191[/C][C]0.000357325075314383[/C][C]0.999821337462343[/C][/ROW]
[ROW][C]14[/C][C]5.3286328930436e-05[/C][C]0.000106572657860872[/C][C]0.99994671367107[/C][/ROW]
[ROW][C]15[/C][C]1.70026493308216e-05[/C][C]3.40052986616432e-05[/C][C]0.99998299735067[/C][/ROW]
[ROW][C]16[/C][C]6.30884262379384e-06[/C][C]1.26176852475877e-05[/C][C]0.999993691157376[/C][/ROW]
[ROW][C]17[/C][C]4.79873349175221e-06[/C][C]9.59746698350443e-06[/C][C]0.999995201266508[/C][/ROW]
[ROW][C]18[/C][C]1.09352375949204e-05[/C][C]2.18704751898408e-05[/C][C]0.999989064762405[/C][/ROW]
[ROW][C]19[/C][C]0.00029842650690346[/C][C]0.00059685301380692[/C][C]0.999701573493097[/C][/ROW]
[ROW][C]20[/C][C]0.0157127144019413[/C][C]0.0314254288038825[/C][C]0.98428728559806[/C][/ROW]
[ROW][C]21[/C][C]0.706204322679306[/C][C]0.587591354641388[/C][C]0.293795677320694[/C][/ROW]
[ROW][C]22[/C][C]0.803778462134748[/C][C]0.392443075730504[/C][C]0.196221537865252[/C][/ROW]
[ROW][C]23[/C][C]0.963023015307993[/C][C]0.0739539693840151[/C][C]0.0369769846920075[/C][/ROW]
[ROW][C]24[/C][C]0.99999998670935[/C][C]2.65813005598526e-08[/C][C]1.32906502799263e-08[/C][/ROW]
[ROW][C]25[/C][C]0.999999999990131[/C][C]1.97370688609101e-11[/C][C]9.86853443045504e-12[/C][/ROW]
[ROW][C]26[/C][C]0.999999999999697[/C][C]6.06330792741829e-13[/C][C]3.03165396370914e-13[/C][/ROW]
[ROW][C]27[/C][C]0.999999999999952[/C][C]9.55705546408133e-14[/C][C]4.77852773204066e-14[/C][/ROW]
[ROW][C]28[/C][C]0.999999999999833[/C][C]3.33054101238272e-13[/C][C]1.66527050619136e-13[/C][/ROW]
[ROW][C]29[/C][C]0.999999999999378[/C][C]1.24387636905123e-12[/C][C]6.21938184525613e-13[/C][/ROW]
[ROW][C]30[/C][C]0.99999999999801[/C][C]3.98160243773045e-12[/C][C]1.99080121886522e-12[/C][/ROW]
[ROW][C]31[/C][C]0.999999999996653[/C][C]6.69464902705846e-12[/C][C]3.34732451352923e-12[/C][/ROW]
[ROW][C]32[/C][C]0.999999999993307[/C][C]1.33854610639422e-11[/C][C]6.69273053197109e-12[/C][/ROW]
[ROW][C]33[/C][C]0.999999999988927[/C][C]2.21466824403792e-11[/C][C]1.10733412201896e-11[/C][/ROW]
[ROW][C]34[/C][C]0.999999999984382[/C][C]3.12352504036653e-11[/C][C]1.56176252018327e-11[/C][/ROW]
[ROW][C]35[/C][C]0.999999999998262[/C][C]3.47644760463728e-12[/C][C]1.73822380231864e-12[/C][/ROW]
[ROW][C]36[/C][C]0.999999999991876[/C][C]1.62481846061782e-11[/C][C]8.12409230308911e-12[/C][/ROW]
[ROW][C]37[/C][C]0.999999999992757[/C][C]1.44863521523635e-11[/C][C]7.24317607618173e-12[/C][/ROW]
[ROW][C]38[/C][C]0.999999999986996[/C][C]2.60078829997037e-11[/C][C]1.30039414998518e-11[/C][/ROW]
[ROW][C]39[/C][C]0.999999999950718[/C][C]9.85648796235672e-11[/C][C]4.92824398117836e-11[/C][/ROW]
[ROW][C]40[/C][C]0.999999999909694[/C][C]1.80611352307819e-10[/C][C]9.03056761539094e-11[/C][/ROW]
[ROW][C]41[/C][C]0.99999999954023[/C][C]9.1954135768042e-10[/C][C]4.5977067884021e-10[/C][/ROW]
[ROW][C]42[/C][C]0.99999999914522[/C][C]1.70955901691853e-09[/C][C]8.54779508459265e-10[/C][/ROW]
[ROW][C]43[/C][C]0.999999998441802[/C][C]3.11639614380511e-09[/C][C]1.55819807190256e-09[/C][/ROW]
[ROW][C]44[/C][C]0.999999995682954[/C][C]8.63409201901848e-09[/C][C]4.31704600950924e-09[/C][/ROW]
[ROW][C]45[/C][C]0.99999998923093[/C][C]2.15381424229861e-08[/C][C]1.0769071211493e-08[/C][/ROW]
[ROW][C]46[/C][C]0.999999907869794[/C][C]1.84260412097819e-07[/C][C]9.21302060489093e-08[/C][/ROW]
[ROW][C]47[/C][C]0.999999239017117[/C][C]1.52196576556385e-06[/C][C]7.60982882781923e-07[/C][/ROW]
[ROW][C]48[/C][C]0.999991580788395[/C][C]1.68384232104029e-05[/C][C]8.41921160520143e-06[/C][/ROW]
[ROW][C]49[/C][C]0.999965290211745[/C][C]6.94195765107814e-05[/C][C]3.47097882553907e-05[/C][/ROW]
[ROW][C]50[/C][C]0.99946464703577[/C][C]0.00107070592845864[/C][C]0.00053535296422932[/C][/ROW]
[/TABLE]
Source: https://freestatistics.org/blog/index.php?pk=112062&T=5

Globally Unique Identifier (entire table): ba.freestatistics.org/blog/index.php?pk=112062&T=5

As an alternative you can also use a QR Code:  

The GUIDs for individual cells are displayed in the table below:

Goldfeld-Quandt test for Heteroskedasticity
p-valuesAlternative Hypothesis
breakpoint indexgreater2-sidedless
70.007317600013965930.01463520002793190.992682399986034
80.004451914592635270.008903829185270530.995548085407365
90.001694698473031570.003389396946063150.998305301526968
100.000727461244827250.00145492248965450.999272538755173
110.00092635754062630.00185271508125260.999073642459374
120.0005818512168050940.001163702433610190.999418148783195
130.0001786625376571910.0003573250753143830.999821337462343
145.3286328930436e-050.0001065726578608720.99994671367107
151.70026493308216e-053.40052986616432e-050.99998299735067
166.30884262379384e-061.26176852475877e-050.999993691157376
174.79873349175221e-069.59746698350443e-060.999995201266508
181.09352375949204e-052.18704751898408e-050.999989064762405
190.000298426506903460.000596853013806920.999701573493097
200.01571271440194130.03142542880388250.98428728559806
210.7062043226793060.5875913546413880.293795677320694
220.8037784621347480.3924430757305040.196221537865252
230.9630230153079930.07395396938401510.0369769846920075
240.999999986709352.65813005598526e-081.32906502799263e-08
250.9999999999901311.97370688609101e-119.86853443045504e-12
260.9999999999996976.06330792741829e-133.03165396370914e-13
270.9999999999999529.55705546408133e-144.77852773204066e-14
280.9999999999998333.33054101238272e-131.66527050619136e-13
290.9999999999993781.24387636905123e-126.21938184525613e-13
300.999999999998013.98160243773045e-121.99080121886522e-12
310.9999999999966536.69464902705846e-123.34732451352923e-12
320.9999999999933071.33854610639422e-116.69273053197109e-12
330.9999999999889272.21466824403792e-111.10733412201896e-11
340.9999999999843823.12352504036653e-111.56176252018327e-11
350.9999999999982623.47644760463728e-121.73822380231864e-12
360.9999999999918761.62481846061782e-118.12409230308911e-12
370.9999999999927571.44863521523635e-117.24317607618173e-12
380.9999999999869962.60078829997037e-111.30039414998518e-11
390.9999999999507189.85648796235672e-114.92824398117836e-11
400.9999999999096941.80611352307819e-109.03056761539094e-11
410.999999999540239.1954135768042e-104.5977067884021e-10
420.999999999145221.70955901691853e-098.54779508459265e-10
430.9999999984418023.11639614380511e-091.55819807190256e-09
440.9999999956829548.63409201901848e-094.31704600950924e-09
450.999999989230932.15381424229861e-081.0769071211493e-08
460.9999999078697941.84260412097819e-079.21302060489093e-08
470.9999992390171171.52196576556385e-067.60982882781923e-07
480.9999915807883951.68384232104029e-058.41921160520143e-06
490.9999652902117456.94195765107814e-053.47097882553907e-05
500.999464647035770.001070705928458640.00053535296422932


Meta Analysis of Goldfeld-Quandt test for Heteroskedasticity
Description# significant tests% significant testsOK/NOK
1% type I error level390.886363636363636NOK
5% type I error level410.931818181818182NOK
10% type I error level420.954545454545455NOK

\begin{tabular}{lllllllll}
\hline
Meta Analysis of Goldfeld-Quandt test for Heteroskedasticity \tabularnewline
Description & # significant tests & % significant tests & OK/NOK \tabularnewline
1% type I error level & 39 & 0.886363636363636 & NOK \tabularnewline
5% type I error level & 41 & 0.931818181818182 & NOK \tabularnewline
10% type I error level & 42 & 0.954545454545455 & NOK \tabularnewline
\hline
\end{tabular}
%Source: https://freestatistics.org/blog/index.php?pk=112062&T=6

[TABLE]
[ROW][C]Meta Analysis of Goldfeld-Quandt test for Heteroskedasticity[/C][/ROW]
[ROW][C]Description[/C][C]# significant tests[/C][C]% significant tests[/C][C]OK/NOK[/C][/ROW]
[ROW][C]1% type I error level[/C][C]39[/C][C]0.886363636363636[/C][C]NOK[/C][/ROW]
[ROW][C]5% type I error level[/C][C]41[/C][C]0.931818181818182[/C][C]NOK[/C][/ROW]
[ROW][C]10% type I error level[/C][C]42[/C][C]0.954545454545455[/C][C]NOK[/C][/ROW]
[/TABLE]
Source: https://freestatistics.org/blog/index.php?pk=112062&T=6

Globally Unique Identifier (entire table): ba.freestatistics.org/blog/index.php?pk=112062&T=6

As an alternative you can also use a QR Code:  

The GUIDs for individual cells are displayed in the table below:

Meta Analysis of Goldfeld-Quandt test for Heteroskedasticity
Description# significant tests% significant testsOK/NOK
1% type I error level390.886363636363636NOK
5% type I error level410.931818181818182NOK
10% type I error level420.954545454545455NOK


Parameters (Session):
par1 = 1 ; par2 = Do not include Seasonal Dummies ; par3 = No Linear Trend ;
Parameters (R input):
par1 = 1 ; par2 = Do not include Seasonal Dummies ; par3 = No Linear Trend ;
R code (references can be found in the software module):
library(lattice)
library(lmtest)
n25 <- 25 #minimum number of obs. for Goldfeld-Quandt test
par1 <- as.numeric(par1)
x <- t(y)
k <- length(x[1,])
n <- length(x[,1])
x1 <- cbind(x[,par1], x[,1:k!=par1])
mycolnames <- c(colnames(x)[par1], colnames(x)[1:k!=par1])
colnames(x1) <- mycolnames #colnames(x)[par1]
x <- x1
if (par3 == 'First Differences'){
x2 <- array(0, dim=c(n-1,k), dimnames=list(1:(n-1), paste('(1-B)',colnames(x),sep='')))
for (i in 1:n-1) {
for (j in 1:k) {
x2[i,j] <- x[i+1,j] - x[i,j]
}
}
x <- x2
}
if (par2 == 'Include Monthly Dummies'){
x2 <- array(0, dim=c(n,11), dimnames=list(1:n, paste('M', seq(1:11), sep ='')))
for (i in 1:11){
x2[seq(i,n,12),i] <- 1
}
x <- cbind(x, x2)
}
if (par2 == 'Include Quarterly Dummies'){
x2 <- array(0, dim=c(n,3), dimnames=list(1:n, paste('Q', seq(1:3), sep ='')))
for (i in 1:3){
x2[seq(i,n,4),i] <- 1
}
x <- cbind(x, x2)
}
k <- length(x[1,])
if (par3 == 'Linear Trend'){
x <- cbind(x, c(1:n))
colnames(x)[k+1] <- 't'
}
x
k <- length(x[1,])
df <- as.data.frame(x)
(mylm <- lm(df))
(mysum <- summary(mylm))
if (n > n25) {
kp3 <- k + 3
nmkm3 <- n - k - 3
gqarr <- array(NA, dim=c(nmkm3-kp3+1,3))
numgqtests <- 0
numsignificant1 <- 0
numsignificant5 <- 0
numsignificant10 <- 0
for (mypoint in kp3:nmkm3) {
j <- 0
numgqtests <- numgqtests + 1
for (myalt in c('greater', 'two.sided', 'less')) {
j <- j + 1
gqarr[mypoint-kp3+1,j] <- gqtest(mylm, point=mypoint, alternative=myalt)$p.value
}
if (gqarr[mypoint-kp3+1,2] < 0.01) numsignificant1 <- numsignificant1 + 1
if (gqarr[mypoint-kp3+1,2] < 0.05) numsignificant5 <- numsignificant5 + 1
if (gqarr[mypoint-kp3+1,2] < 0.10) numsignificant10 <- numsignificant10 + 1
}
gqarr
}
bitmap(file='test0.png')
plot(x[,1], type='l', main='Actuals and Interpolation', ylab='value of Actuals and Interpolation (dots)', xlab='time or index')
points(x[,1]-mysum$resid)
grid()
dev.off()
bitmap(file='test1.png')
plot(mysum$resid, type='b', pch=19, main='Residuals', ylab='value of Residuals', xlab='time or index')
grid()
dev.off()
bitmap(file='test2.png')
hist(mysum$resid, main='Residual Histogram', xlab='values of Residuals')
grid()
dev.off()
bitmap(file='test3.png')
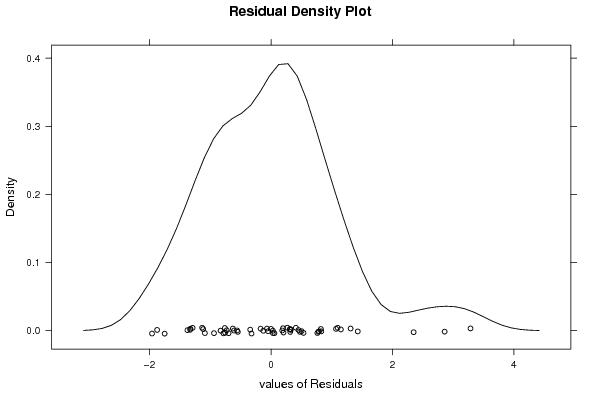
densityplot(~mysum$resid,col='black',main='Residual Density Plot', xlab='values of Residuals')
dev.off()
bitmap(file='test4.png')
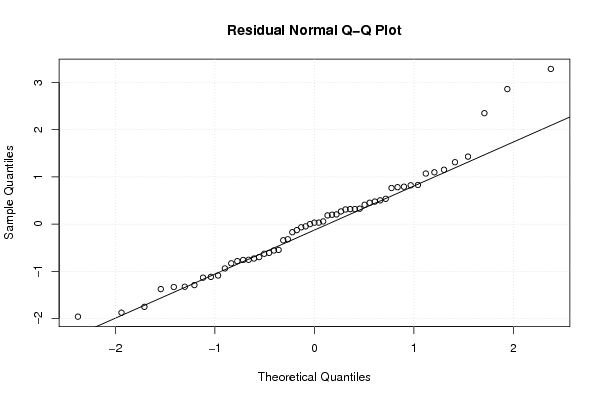
qqnorm(mysum$resid, main='Residual Normal Q-Q Plot')
qqline(mysum$resid)
grid()
dev.off()
(myerror <- as.ts(mysum$resid))
bitmap(file='test5.png')
dum <- cbind(lag(myerror,k=1),myerror)
dum
dum1 <- dum[2:length(myerror),]
dum1
z <- as.data.frame(dum1)
z
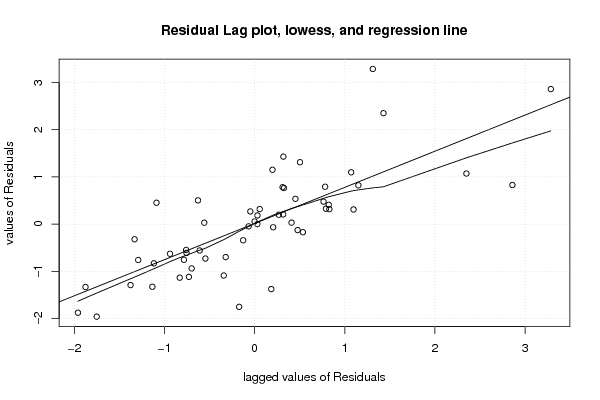
plot(z,main=paste('Residual Lag plot, lowess, and regression line'), ylab='values of Residuals', xlab='lagged values of Residuals')
lines(lowess(z))
abline(lm(z))
grid()
dev.off()
bitmap(file='test6.png')
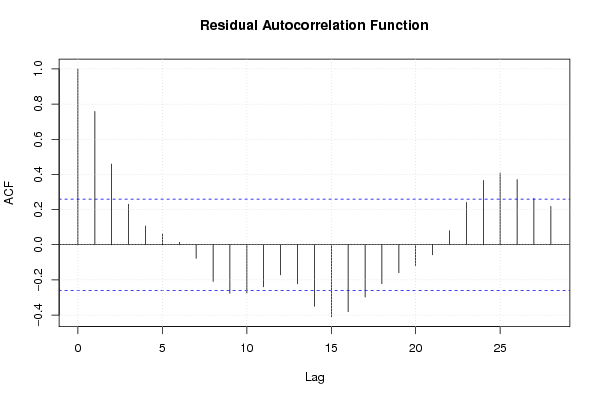
acf(mysum$resid, lag.max=length(mysum$resid)/2, main='Residual Autocorrelation Function')
grid()
dev.off()
bitmap(file='test7.png')
pacf(mysum$resid, lag.max=length(mysum$resid)/2, main='Residual Partial Autocorrelation Function')
grid()
dev.off()
bitmap(file='test8.png')
opar <- par(mfrow = c(2,2), oma = c(0, 0, 1.1, 0))
plot(mylm, las = 1, sub='Residual Diagnostics')
par(opar)
dev.off()
if (n > n25) {
bitmap(file='test9.png')
plot(kp3:nmkm3,gqarr[,2], main='Goldfeld-Quandt test',ylab='2-sided p-value',xlab='breakpoint')
grid()
dev.off()
}
load(file='createtable')
a<-table.start()
a<-table.row.start(a)
a<-table.element(a, 'Multiple Linear Regression - Estimated Regression Equation', 1, TRUE)
a<-table.row.end(a)
myeq <- colnames(x)[1]
myeq <- paste(myeq, '[t] = ', sep='')
for (i in 1:k){
if (mysum$coefficients[i,1] > 0) myeq <- paste(myeq, '+', '')
myeq <- paste(myeq, mysum$coefficients[i,1], sep=' ')
if (rownames(mysum$coefficients)[i] != '(Intercept)') {
myeq <- paste(myeq, rownames(mysum$coefficients)[i], sep='')
if (rownames(mysum$coefficients)[i] != 't') myeq <- paste(myeq, '[t]', sep='')
}
}
myeq <- paste(myeq, ' + e[t]')
a<-table.row.start(a)
a<-table.element(a, myeq)
a<-table.row.end(a)
a<-table.end(a)
table.save(a,file='mytable1.tab')
a<-table.start()
a<-table.row.start(a)
a<-table.element(a,hyperlink('ols1.htm','Multiple Linear Regression - Ordinary Least Squares',''), 6, TRUE)
a<-table.row.end(a)
a<-table.row.start(a)
a<-table.element(a,'Variable',header=TRUE)
a<-table.element(a,'Parameter',header=TRUE)
a<-table.element(a,'S.D.',header=TRUE)
a<-table.element(a,'T-STAT
H0: parameter = 0',header=TRUE)
a<-table.element(a,'2-tail p-value',header=TRUE)
a<-table.element(a,'1-tail p-value',header=TRUE)
a<-table.row.end(a)
for (i in 1:k){
a<-table.row.start(a)
a<-table.element(a,rownames(mysum$coefficients)[i],header=TRUE)
a<-table.element(a,mysum$coefficients[i,1])
a<-table.element(a, round(mysum$coefficients[i,2],6))
a<-table.element(a, round(mysum$coefficients[i,3],4))
a<-table.element(a, round(mysum$coefficients[i,4],6))
a<-table.element(a, round(mysum$coefficients[i,4]/2,6))
a<-table.row.end(a)
}
a<-table.end(a)
table.save(a,file='mytable2.tab')
a<-table.start()
a<-table.row.start(a)
a<-table.element(a, 'Multiple Linear Regression - Regression Statistics', 2, TRUE)
a<-table.row.end(a)
a<-table.row.start(a)
a<-table.element(a, 'Multiple R',1,TRUE)
a<-table.element(a, sqrt(mysum$r.squared))
a<-table.row.end(a)
a<-table.row.start(a)
a<-table.element(a, 'R-squared',1,TRUE)
a<-table.element(a, mysum$r.squared)
a<-table.row.end(a)
a<-table.row.start(a)
a<-table.element(a, 'Adjusted R-squared',1,TRUE)
a<-table.element(a, mysum$adj.r.squared)
a<-table.row.end(a)
a<-table.row.start(a)
a<-table.element(a, 'F-TEST (value)',1,TRUE)
a<-table.element(a, mysum$fstatistic[1])
a<-table.row.end(a)
a<-table.row.start(a)
a<-table.element(a, 'F-TEST (DF numerator)',1,TRUE)
a<-table.element(a, mysum$fstatistic[2])
a<-table.row.end(a)
a<-table.row.start(a)
a<-table.element(a, 'F-TEST (DF denominator)',1,TRUE)
a<-table.element(a, mysum$fstatistic[3])
a<-table.row.end(a)
a<-table.row.start(a)
a<-table.element(a, 'p-value',1,TRUE)
a<-table.element(a, 1-pf(mysum$fstatistic[1],mysum$fstatistic[2],mysum$fstatistic[3]))
a<-table.row.end(a)
a<-table.row.start(a)
a<-table.element(a, 'Multiple Linear Regression - Residual Statistics', 2, TRUE)
a<-table.row.end(a)
a<-table.row.start(a)
a<-table.element(a, 'Residual Standard Deviation',1,TRUE)
a<-table.element(a, mysum$sigma)
a<-table.row.end(a)
a<-table.row.start(a)
a<-table.element(a, 'Sum Squared Residuals',1,TRUE)
a<-table.element(a, sum(myerror*myerror))
a<-table.row.end(a)
a<-table.end(a)
table.save(a,file='mytable3.tab')
a<-table.start()
a<-table.row.start(a)
a<-table.element(a, 'Multiple Linear Regression - Actuals, Interpolation, and Residuals', 4, TRUE)
a<-table.row.end(a)
a<-table.row.start(a)
a<-table.element(a, 'Time or Index', 1, TRUE)
a<-table.element(a, 'Actuals', 1, TRUE)
a<-table.element(a, 'Interpolation
Forecast', 1, TRUE)
a<-table.element(a, 'Residuals
Prediction Error', 1, TRUE)
a<-table.row.end(a)
for (i in 1:n) {
a<-table.row.start(a)
a<-table.element(a,i, 1, TRUE)
a<-table.element(a,x[i])
a<-table.element(a,x[i]-mysum$resid[i])
a<-table.element(a,mysum$resid[i])
a<-table.row.end(a)
}
a<-table.end(a)
table.save(a,file='mytable4.tab')
if (n > n25) {
a<-table.start()
a<-table.row.start(a)
a<-table.element(a,'Goldfeld-Quandt test for Heteroskedasticity',4,TRUE)
a<-table.row.end(a)
a<-table.row.start(a)
a<-table.element(a,'p-values',header=TRUE)
a<-table.element(a,'Alternative Hypothesis',3,header=TRUE)
a<-table.row.end(a)
a<-table.row.start(a)
a<-table.element(a,'breakpoint index',header=TRUE)
a<-table.element(a,'greater',header=TRUE)
a<-table.element(a,'2-sided',header=TRUE)
a<-table.element(a,'less',header=TRUE)
a<-table.row.end(a)
for (mypoint in kp3:nmkm3) {
a<-table.row.start(a)
a<-table.element(a,mypoint,header=TRUE)
a<-table.element(a,gqarr[mypoint-kp3+1,1])
a<-table.element(a,gqarr[mypoint-kp3+1,2])
a<-table.element(a,gqarr[mypoint-kp3+1,3])
a<-table.row.end(a)
}
a<-table.end(a)
table.save(a,file='mytable5.tab')
a<-table.start()
a<-table.row.start(a)
a<-table.element(a,'Meta Analysis of Goldfeld-Quandt test for Heteroskedasticity',4,TRUE)
a<-table.row.end(a)
a<-table.row.start(a)
a<-table.element(a,'Description',header=TRUE)
a<-table.element(a,'# significant tests',header=TRUE)
a<-table.element(a,'% significant tests',header=TRUE)
a<-table.element(a,'OK/NOK',header=TRUE)
a<-table.row.end(a)
a<-table.row.start(a)
a<-table.element(a,'1% type I error level',header=TRUE)
a<-table.element(a,numsignificant1)
a<-table.element(a,numsignificant1/numgqtests)
if (numsignificant1/numgqtests < 0.01) dum <- 'OK' else dum <- 'NOK'
a<-table.element(a,dum)
a<-table.row.end(a)
a<-table.row.start(a)
a<-table.element(a,'5% type I error level',header=TRUE)
a<-table.element(a,numsignificant5)
a<-table.element(a,numsignificant5/numgqtests)
if (numsignificant5/numgqtests < 0.05) dum <- 'OK' else dum <- 'NOK'
a<-table.element(a,dum)
a<-table.row.end(a)
a<-table.row.start(a)
a<-table.element(a,'10% type I error level',header=TRUE)
a<-table.element(a,numsignificant10)
a<-table.element(a,numsignificant10/numgqtests)
if (numsignificant10/numgqtests < 0.1) dum <- 'OK' else dum <- 'NOK'
a<-table.element(a,dum)
a<-table.row.end(a)
a<-table.end(a)
table.save(a,file='mytable6.tab')
}