Free Statistics

of Irreproducible Research!

Author's title

Author*The author of this computation has been verified*
R Software Modulerwasp_exponentialsmoothing.wasp
Title produced by softwareExponential Smoothing
Date of computationSat, 18 Dec 2010 15:43:31 +0000
Cite this page as followsStatistical Computations at FreeStatistics.org, Office for Research Development and Education, URL https://freestatistics.org/blog/index.php?v=date/2010/Dec/18/t1292686891r4cgve8l6icwg2z.htm/, Retrieved Tue, 30 Apr 2024 05:07:59 +0000
Statistical Computations at FreeStatistics.org, Office for Research Development and Education, URL https://freestatistics.org/blog/index.php?pk=112058, Retrieved Tue, 30 Apr 2024 05:07:59 +0000
QR Codes:

Original text written by user:
IsPrivate?No (this computation is public)
User-defined keywords
Estimated Impact188
Family? (F = Feedback message, R = changed R code, M = changed R Module, P = changed Parameters, D = changed Data)
-     [Exponential Smoothing] [HPC Retail Sales] [2008-03-10 17:43:04] [74be16979710d4c4e7c6647856088456]
- RMPD  [Exponential Smoothing] [Triple Exponentia...] [2010-11-30 10:00:50] [f4dc4aa51d65be851b8508203d9f6001]
-   PD      [Exponential Smoothing] [Triple Exponentia...] [2010-12-18 15:43:31] [7a87ed98a7b21a29d6a45388a9b7b229] [Current]
Feedback Forum

Post a new message
Dataseries X:
989236
1008380
1207763
1368839
1469798
1498721
1761769
1653214
1599104
1421179
1163995
1037735
1015407
1039210
1258049
1469445
1552346
1549144
1785895
1662335
1629440
1467430
1202209
1076982
1039367
1063449
1335135
1491602
1591972
1641248
1898849
1798580
1762444
1622044
1368955
1262973
1195650
1269530
1479279
1607819
1712466
1721766
1949843
1821326
1757802
1590367
1260647
1149235
1016367
1027885
1262159
1520854
1544144
1564709
1821776
1741365
1623386
1498658
1241822
1136029


Summary of computational transaction
Raw Inputview raw input (R code)
Raw Outputview raw output of R engine
Computing time3 seconds
R Server'George Udny Yule' @ 72.249.76.132

\begin{tabular}{lllllllll}
\hline
Summary of computational transaction \tabularnewline
Raw Input & view raw input (R code)  \tabularnewline
Raw Output & view raw output of R engine  \tabularnewline
Computing time & 3 seconds \tabularnewline
R Server & 'George Udny Yule' @ 72.249.76.132 \tabularnewline
\hline
\end{tabular}
%Source: https://freestatistics.org/blog/index.php?pk=112058&T=0

[TABLE]
[ROW][C]Summary of computational transaction[/C][/ROW]
[ROW][C]Raw Input[/C][C]view raw input (R code) [/C][/ROW]
[ROW][C]Raw Output[/C][C]view raw output of R engine [/C][/ROW]
[ROW][C]Computing time[/C][C]3 seconds[/C][/ROW]
[ROW][C]R Server[/C][C]'George Udny Yule' @ 72.249.76.132[/C][/ROW]
[/TABLE]
Source: https://freestatistics.org/blog/index.php?pk=112058&T=0

Globally Unique Identifier (entire table): ba.freestatistics.org/blog/index.php?pk=112058&T=0

As an alternative you can also use a QR Code:  

The GUIDs for individual cells are displayed in the table below:

Summary of computational transaction
Raw Inputview raw input (R code)
Raw Outputview raw output of R engine
Computing time3 seconds
R Server'George Udny Yule' @ 72.249.76.132


Estimated Parameters of Exponential Smoothing
ParameterValue
alpha0.799748250351652
beta0
gamma1

\begin{tabular}{lllllllll}
\hline
Estimated Parameters of Exponential Smoothing \tabularnewline
Parameter & Value \tabularnewline
alpha & 0.799748250351652 \tabularnewline
beta & 0 \tabularnewline
gamma & 1 \tabularnewline
\hline
\end{tabular}
%Source: https://freestatistics.org/blog/index.php?pk=112058&T=1

[TABLE]
[ROW][C]Estimated Parameters of Exponential Smoothing[/C][/ROW]
[ROW][C]Parameter[/C][C]Value[/C][/ROW]
[ROW][C]alpha[/C][C]0.799748250351652[/C][/ROW]
[ROW][C]beta[/C][C]0[/C][/ROW]
[ROW][C]gamma[/C][C]1[/C][/ROW]
[/TABLE]
Source: https://freestatistics.org/blog/index.php?pk=112058&T=1

Globally Unique Identifier (entire table): ba.freestatistics.org/blog/index.php?pk=112058&T=1

As an alternative you can also use a QR Code:  

The GUIDs for individual cells are displayed in the table below:

Estimated Parameters of Exponential Smoothing
ParameterValue
alpha0.799748250351652
beta0
gamma1


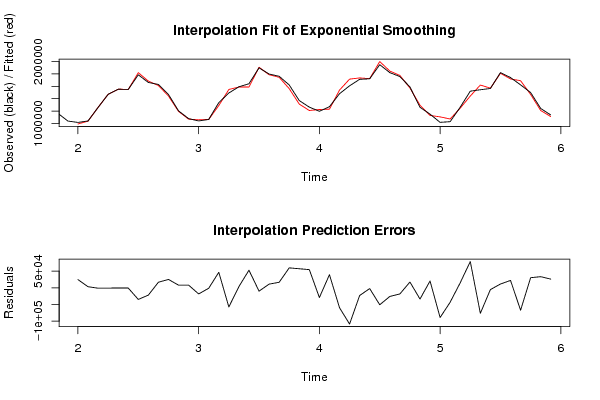
Interpolation Forecasts of Exponential Smoothing
tObservedFittedResiduals
131015407990882.9681417924524.0318582107
1410392101036047.571542253162.42845775408
1512580491259294.85702845-1245.85702844826
1614694451470437.25201058-992.25201058248
1715523461552927.33288122-581.332881218055
1815491441549955.31444310-811.31444310327
1917858951820892.99602625-34997.996026248
2016623351684184.76104171-21849.7610417139
2116294401612683.1062348616756.8937651436
2214674301442504.4851398524925.5148601532
2312022091194386.265765257822.73423475004
2410769821069000.800189257981.19981075241
2510393671057828.32166223-18461.3216622269
2610634491064836.51853100-1387.51853099861
2713351351288665.5591496946469.4408503058
2814916021549230.75612511-57628.7561251118
2915919721588321.068307993650.93169201491
3016412481588516.2068632252731.7931367804
3118988491908985.60830716-10136.6083071560
3217985801787611.5821812110968.4178187922
3317624441745956.8239549716487.1760450257
3416220441562321.0371372459722.9628627566
3513689551311888.1048578157066.8951421913
3612629731208527.1339150254445.8660849752
3711956501224981.68371554-29331.6837155405
3812695301230192.3358441739337.6641558325
3914792791538916.47732906-59637.4773290628
4016078191716587.54572995-108768.545729950
4117124661735665.70761836-23199.7076183553
4217217661724140.05097383-2374.05097382911
4319498432000805.44613200-50962.4461319959
4418213261847330.30510845-26004.3051084459
4517578021776349.21317027-18547.2131702679
4615903671573099.3836560817267.6163439204
4712606471294347.44433739-33700.4443373862
4811492351128830.3704605220404.629539483
4910163671105536.02568602-89169.025686017
5010278851071140.40527100-43255.4052710028
5112621591247076.4430013215082.5569986831
5215208541442198.3809871478655.6190128594
5315441441620660.96425899-76516.9642589898
5415647091570049.97072102-5340.97072102036
5518217761810514.9995048011261.0004951961
5617413651719258.7578273122106.2421726948
5716233861690684.44399885-67298.4439988541
5814986581468340.0240661130317.9759338873
5912418221208501.2132200033320.7867800028
6011360291110004.9117044526024.0882955454

\begin{tabular}{lllllllll}
\hline
Interpolation Forecasts of Exponential Smoothing \tabularnewline
t & Observed & Fitted & Residuals \tabularnewline
13 & 1015407 & 990882.96814179 & 24524.0318582107 \tabularnewline
14 & 1039210 & 1036047.57154225 & 3162.42845775408 \tabularnewline
15 & 1258049 & 1259294.85702845 & -1245.85702844826 \tabularnewline
16 & 1469445 & 1470437.25201058 & -992.25201058248 \tabularnewline
17 & 1552346 & 1552927.33288122 & -581.332881218055 \tabularnewline
18 & 1549144 & 1549955.31444310 & -811.31444310327 \tabularnewline
19 & 1785895 & 1820892.99602625 & -34997.996026248 \tabularnewline
20 & 1662335 & 1684184.76104171 & -21849.7610417139 \tabularnewline
21 & 1629440 & 1612683.10623486 & 16756.8937651436 \tabularnewline
22 & 1467430 & 1442504.48513985 & 24925.5148601532 \tabularnewline
23 & 1202209 & 1194386.26576525 & 7822.73423475004 \tabularnewline
24 & 1076982 & 1069000.80018925 & 7981.19981075241 \tabularnewline
25 & 1039367 & 1057828.32166223 & -18461.3216622269 \tabularnewline
26 & 1063449 & 1064836.51853100 & -1387.51853099861 \tabularnewline
27 & 1335135 & 1288665.55914969 & 46469.4408503058 \tabularnewline
28 & 1491602 & 1549230.75612511 & -57628.7561251118 \tabularnewline
29 & 1591972 & 1588321.06830799 & 3650.93169201491 \tabularnewline
30 & 1641248 & 1588516.20686322 & 52731.7931367804 \tabularnewline
31 & 1898849 & 1908985.60830716 & -10136.6083071560 \tabularnewline
32 & 1798580 & 1787611.58218121 & 10968.4178187922 \tabularnewline
33 & 1762444 & 1745956.82395497 & 16487.1760450257 \tabularnewline
34 & 1622044 & 1562321.03713724 & 59722.9628627566 \tabularnewline
35 & 1368955 & 1311888.10485781 & 57066.8951421913 \tabularnewline
36 & 1262973 & 1208527.13391502 & 54445.8660849752 \tabularnewline
37 & 1195650 & 1224981.68371554 & -29331.6837155405 \tabularnewline
38 & 1269530 & 1230192.33584417 & 39337.6641558325 \tabularnewline
39 & 1479279 & 1538916.47732906 & -59637.4773290628 \tabularnewline
40 & 1607819 & 1716587.54572995 & -108768.545729950 \tabularnewline
41 & 1712466 & 1735665.70761836 & -23199.7076183553 \tabularnewline
42 & 1721766 & 1724140.05097383 & -2374.05097382911 \tabularnewline
43 & 1949843 & 2000805.44613200 & -50962.4461319959 \tabularnewline
44 & 1821326 & 1847330.30510845 & -26004.3051084459 \tabularnewline
45 & 1757802 & 1776349.21317027 & -18547.2131702679 \tabularnewline
46 & 1590367 & 1573099.38365608 & 17267.6163439204 \tabularnewline
47 & 1260647 & 1294347.44433739 & -33700.4443373862 \tabularnewline
48 & 1149235 & 1128830.37046052 & 20404.629539483 \tabularnewline
49 & 1016367 & 1105536.02568602 & -89169.025686017 \tabularnewline
50 & 1027885 & 1071140.40527100 & -43255.4052710028 \tabularnewline
51 & 1262159 & 1247076.44300132 & 15082.5569986831 \tabularnewline
52 & 1520854 & 1442198.38098714 & 78655.6190128594 \tabularnewline
53 & 1544144 & 1620660.96425899 & -76516.9642589898 \tabularnewline
54 & 1564709 & 1570049.97072102 & -5340.97072102036 \tabularnewline
55 & 1821776 & 1810514.99950480 & 11261.0004951961 \tabularnewline
56 & 1741365 & 1719258.75782731 & 22106.2421726948 \tabularnewline
57 & 1623386 & 1690684.44399885 & -67298.4439988541 \tabularnewline
58 & 1498658 & 1468340.02406611 & 30317.9759338873 \tabularnewline
59 & 1241822 & 1208501.21322000 & 33320.7867800028 \tabularnewline
60 & 1136029 & 1110004.91170445 & 26024.0882955454 \tabularnewline
\hline
\end{tabular}
%Source: https://freestatistics.org/blog/index.php?pk=112058&T=2

[TABLE]
[ROW][C]Interpolation Forecasts of Exponential Smoothing[/C][/ROW]
[ROW][C]t[/C][C]Observed[/C][C]Fitted[/C][C]Residuals[/C][/ROW]
[ROW][C]13[/C][C]1015407[/C][C]990882.96814179[/C][C]24524.0318582107[/C][/ROW]
[ROW][C]14[/C][C]1039210[/C][C]1036047.57154225[/C][C]3162.42845775408[/C][/ROW]
[ROW][C]15[/C][C]1258049[/C][C]1259294.85702845[/C][C]-1245.85702844826[/C][/ROW]
[ROW][C]16[/C][C]1469445[/C][C]1470437.25201058[/C][C]-992.25201058248[/C][/ROW]
[ROW][C]17[/C][C]1552346[/C][C]1552927.33288122[/C][C]-581.332881218055[/C][/ROW]
[ROW][C]18[/C][C]1549144[/C][C]1549955.31444310[/C][C]-811.31444310327[/C][/ROW]
[ROW][C]19[/C][C]1785895[/C][C]1820892.99602625[/C][C]-34997.996026248[/C][/ROW]
[ROW][C]20[/C][C]1662335[/C][C]1684184.76104171[/C][C]-21849.7610417139[/C][/ROW]
[ROW][C]21[/C][C]1629440[/C][C]1612683.10623486[/C][C]16756.8937651436[/C][/ROW]
[ROW][C]22[/C][C]1467430[/C][C]1442504.48513985[/C][C]24925.5148601532[/C][/ROW]
[ROW][C]23[/C][C]1202209[/C][C]1194386.26576525[/C][C]7822.73423475004[/C][/ROW]
[ROW][C]24[/C][C]1076982[/C][C]1069000.80018925[/C][C]7981.19981075241[/C][/ROW]
[ROW][C]25[/C][C]1039367[/C][C]1057828.32166223[/C][C]-18461.3216622269[/C][/ROW]
[ROW][C]26[/C][C]1063449[/C][C]1064836.51853100[/C][C]-1387.51853099861[/C][/ROW]
[ROW][C]27[/C][C]1335135[/C][C]1288665.55914969[/C][C]46469.4408503058[/C][/ROW]
[ROW][C]28[/C][C]1491602[/C][C]1549230.75612511[/C][C]-57628.7561251118[/C][/ROW]
[ROW][C]29[/C][C]1591972[/C][C]1588321.06830799[/C][C]3650.93169201491[/C][/ROW]
[ROW][C]30[/C][C]1641248[/C][C]1588516.20686322[/C][C]52731.7931367804[/C][/ROW]
[ROW][C]31[/C][C]1898849[/C][C]1908985.60830716[/C][C]-10136.6083071560[/C][/ROW]
[ROW][C]32[/C][C]1798580[/C][C]1787611.58218121[/C][C]10968.4178187922[/C][/ROW]
[ROW][C]33[/C][C]1762444[/C][C]1745956.82395497[/C][C]16487.1760450257[/C][/ROW]
[ROW][C]34[/C][C]1622044[/C][C]1562321.03713724[/C][C]59722.9628627566[/C][/ROW]
[ROW][C]35[/C][C]1368955[/C][C]1311888.10485781[/C][C]57066.8951421913[/C][/ROW]
[ROW][C]36[/C][C]1262973[/C][C]1208527.13391502[/C][C]54445.8660849752[/C][/ROW]
[ROW][C]37[/C][C]1195650[/C][C]1224981.68371554[/C][C]-29331.6837155405[/C][/ROW]
[ROW][C]38[/C][C]1269530[/C][C]1230192.33584417[/C][C]39337.6641558325[/C][/ROW]
[ROW][C]39[/C][C]1479279[/C][C]1538916.47732906[/C][C]-59637.4773290628[/C][/ROW]
[ROW][C]40[/C][C]1607819[/C][C]1716587.54572995[/C][C]-108768.545729950[/C][/ROW]
[ROW][C]41[/C][C]1712466[/C][C]1735665.70761836[/C][C]-23199.7076183553[/C][/ROW]
[ROW][C]42[/C][C]1721766[/C][C]1724140.05097383[/C][C]-2374.05097382911[/C][/ROW]
[ROW][C]43[/C][C]1949843[/C][C]2000805.44613200[/C][C]-50962.4461319959[/C][/ROW]
[ROW][C]44[/C][C]1821326[/C][C]1847330.30510845[/C][C]-26004.3051084459[/C][/ROW]
[ROW][C]45[/C][C]1757802[/C][C]1776349.21317027[/C][C]-18547.2131702679[/C][/ROW]
[ROW][C]46[/C][C]1590367[/C][C]1573099.38365608[/C][C]17267.6163439204[/C][/ROW]
[ROW][C]47[/C][C]1260647[/C][C]1294347.44433739[/C][C]-33700.4443373862[/C][/ROW]
[ROW][C]48[/C][C]1149235[/C][C]1128830.37046052[/C][C]20404.629539483[/C][/ROW]
[ROW][C]49[/C][C]1016367[/C][C]1105536.02568602[/C][C]-89169.025686017[/C][/ROW]
[ROW][C]50[/C][C]1027885[/C][C]1071140.40527100[/C][C]-43255.4052710028[/C][/ROW]
[ROW][C]51[/C][C]1262159[/C][C]1247076.44300132[/C][C]15082.5569986831[/C][/ROW]
[ROW][C]52[/C][C]1520854[/C][C]1442198.38098714[/C][C]78655.6190128594[/C][/ROW]
[ROW][C]53[/C][C]1544144[/C][C]1620660.96425899[/C][C]-76516.9642589898[/C][/ROW]
[ROW][C]54[/C][C]1564709[/C][C]1570049.97072102[/C][C]-5340.97072102036[/C][/ROW]
[ROW][C]55[/C][C]1821776[/C][C]1810514.99950480[/C][C]11261.0004951961[/C][/ROW]
[ROW][C]56[/C][C]1741365[/C][C]1719258.75782731[/C][C]22106.2421726948[/C][/ROW]
[ROW][C]57[/C][C]1623386[/C][C]1690684.44399885[/C][C]-67298.4439988541[/C][/ROW]
[ROW][C]58[/C][C]1498658[/C][C]1468340.02406611[/C][C]30317.9759338873[/C][/ROW]
[ROW][C]59[/C][C]1241822[/C][C]1208501.21322000[/C][C]33320.7867800028[/C][/ROW]
[ROW][C]60[/C][C]1136029[/C][C]1110004.91170445[/C][C]26024.0882955454[/C][/ROW]
[/TABLE]
Source: https://freestatistics.org/blog/index.php?pk=112058&T=2

Globally Unique Identifier (entire table): ba.freestatistics.org/blog/index.php?pk=112058&T=2

As an alternative you can also use a QR Code:  

The GUIDs for individual cells are displayed in the table below:

Interpolation Forecasts of Exponential Smoothing
tObservedFittedResiduals
131015407990882.9681417924524.0318582107
1410392101036047.571542253162.42845775408
1512580491259294.85702845-1245.85702844826
1614694451470437.25201058-992.25201058248
1715523461552927.33288122-581.332881218055
1815491441549955.31444310-811.31444310327
1917858951820892.99602625-34997.996026248
2016623351684184.76104171-21849.7610417139
2116294401612683.1062348616756.8937651436
2214674301442504.4851398524925.5148601532
2312022091194386.265765257822.73423475004
2410769821069000.800189257981.19981075241
2510393671057828.32166223-18461.3216622269
2610634491064836.51853100-1387.51853099861
2713351351288665.5591496946469.4408503058
2814916021549230.75612511-57628.7561251118
2915919721588321.068307993650.93169201491
3016412481588516.2068632252731.7931367804
3118988491908985.60830716-10136.6083071560
3217985801787611.5821812110968.4178187922
3317624441745956.8239549716487.1760450257
3416220441562321.0371372459722.9628627566
3513689551311888.1048578157066.8951421913
3612629731208527.1339150254445.8660849752
3711956501224981.68371554-29331.6837155405
3812695301230192.3358441739337.6641558325
3914792791538916.47732906-59637.4773290628
4016078191716587.54572995-108768.545729950
4117124661735665.70761836-23199.7076183553
4217217661724140.05097383-2374.05097382911
4319498432000805.44613200-50962.4461319959
4418213261847330.30510845-26004.3051084459
4517578021776349.21317027-18547.2131702679
4615903671573099.3836560817267.6163439204
4712606471294347.44433739-33700.4443373862
4811492351128830.3704605220404.629539483
4910163671105536.02568602-89169.025686017
5010278851071140.40527100-43255.4052710028
5112621591247076.4430013215082.5569986831
5215208541442198.3809871478655.6190128594
5315441441620660.96425899-76516.9642589898
5415647091570049.97072102-5340.97072102036
5518217761810514.9995048011261.0004951961
5617413651719258.7578273122106.2421726948
5716233861690684.44399885-67298.4439988541
5814986581468340.0240661130317.9759338873
5912418221208501.2132200033320.7867800028
6011360291110004.9117044526024.0882955454


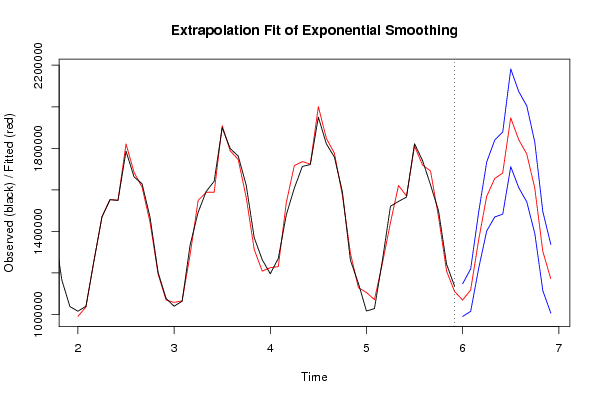
Extrapolation Forecasts of Exponential Smoothing
tForecast95% Lower Bound95% Upper Bound
611069081.91111003990368.0375936681147795.78462640
621117130.619279081014658.473057091219602.76550106
631358299.289032281222817.963392071493780.61467248
641567986.603393111401946.629635211734026.57715102
651654337.313652491469257.346229241839417.28107573
661680635.150842171482963.297261571878307.00442277
671946693.285196171711380.629431852182005.94096049
681841506.292555741610195.017606042072817.56750544
691772931.281662611541677.120451562004185.44287366
701609748.600618551390140.556712101829356.64452501
711304850.844135151114419.237752061495282.45051825
721171568.134924121006354.460127431336781.80972081

\begin{tabular}{lllllllll}
\hline
Extrapolation Forecasts of Exponential Smoothing \tabularnewline
t & Forecast & 95% Lower Bound & 95% Upper Bound \tabularnewline
61 & 1069081.91111003 & 990368.037593668 & 1147795.78462640 \tabularnewline
62 & 1117130.61927908 & 1014658.47305709 & 1219602.76550106 \tabularnewline
63 & 1358299.28903228 & 1222817.96339207 & 1493780.61467248 \tabularnewline
64 & 1567986.60339311 & 1401946.62963521 & 1734026.57715102 \tabularnewline
65 & 1654337.31365249 & 1469257.34622924 & 1839417.28107573 \tabularnewline
66 & 1680635.15084217 & 1482963.29726157 & 1878307.00442277 \tabularnewline
67 & 1946693.28519617 & 1711380.62943185 & 2182005.94096049 \tabularnewline
68 & 1841506.29255574 & 1610195.01760604 & 2072817.56750544 \tabularnewline
69 & 1772931.28166261 & 1541677.12045156 & 2004185.44287366 \tabularnewline
70 & 1609748.60061855 & 1390140.55671210 & 1829356.64452501 \tabularnewline
71 & 1304850.84413515 & 1114419.23775206 & 1495282.45051825 \tabularnewline
72 & 1171568.13492412 & 1006354.46012743 & 1336781.80972081 \tabularnewline
\hline
\end{tabular}
%Source: https://freestatistics.org/blog/index.php?pk=112058&T=3

[TABLE]
[ROW][C]Extrapolation Forecasts of Exponential Smoothing[/C][/ROW]
[ROW][C]t[/C][C]Forecast[/C][C]95% Lower Bound[/C][C]95% Upper Bound[/C][/ROW]
[ROW][C]61[/C][C]1069081.91111003[/C][C]990368.037593668[/C][C]1147795.78462640[/C][/ROW]
[ROW][C]62[/C][C]1117130.61927908[/C][C]1014658.47305709[/C][C]1219602.76550106[/C][/ROW]
[ROW][C]63[/C][C]1358299.28903228[/C][C]1222817.96339207[/C][C]1493780.61467248[/C][/ROW]
[ROW][C]64[/C][C]1567986.60339311[/C][C]1401946.62963521[/C][C]1734026.57715102[/C][/ROW]
[ROW][C]65[/C][C]1654337.31365249[/C][C]1469257.34622924[/C][C]1839417.28107573[/C][/ROW]
[ROW][C]66[/C][C]1680635.15084217[/C][C]1482963.29726157[/C][C]1878307.00442277[/C][/ROW]
[ROW][C]67[/C][C]1946693.28519617[/C][C]1711380.62943185[/C][C]2182005.94096049[/C][/ROW]
[ROW][C]68[/C][C]1841506.29255574[/C][C]1610195.01760604[/C][C]2072817.56750544[/C][/ROW]
[ROW][C]69[/C][C]1772931.28166261[/C][C]1541677.12045156[/C][C]2004185.44287366[/C][/ROW]
[ROW][C]70[/C][C]1609748.60061855[/C][C]1390140.55671210[/C][C]1829356.64452501[/C][/ROW]
[ROW][C]71[/C][C]1304850.84413515[/C][C]1114419.23775206[/C][C]1495282.45051825[/C][/ROW]
[ROW][C]72[/C][C]1171568.13492412[/C][C]1006354.46012743[/C][C]1336781.80972081[/C][/ROW]
[/TABLE]
Source: https://freestatistics.org/blog/index.php?pk=112058&T=3

Globally Unique Identifier (entire table): ba.freestatistics.org/blog/index.php?pk=112058&T=3

As an alternative you can also use a QR Code:  

The GUIDs for individual cells are displayed in the table below:

Extrapolation Forecasts of Exponential Smoothing
tForecast95% Lower Bound95% Upper Bound
611069081.91111003990368.0375936681147795.78462640
621117130.619279081014658.473057091219602.76550106
631358299.289032281222817.963392071493780.61467248
641567986.603393111401946.629635211734026.57715102
651654337.313652491469257.346229241839417.28107573
661680635.150842171482963.297261571878307.00442277
671946693.285196171711380.629431852182005.94096049
681841506.292555741610195.017606042072817.56750544
691772931.281662611541677.120451562004185.44287366
701609748.600618551390140.556712101829356.64452501
711304850.844135151114419.237752061495282.45051825
721171568.134924121006354.460127431336781.80972081


Parameters (Session):
par1 = 12 ; par2 = Triple ; par3 = multiplicative ;
Parameters (R input):
par1 = 12 ; par2 = Triple ; par3 = multiplicative ;
R code (references can be found in the software module):
par1 <- as.numeric(par1)
if (par2 == 'Single') K <- 1
if (par2 == 'Double') K <- 2
if (par2 == 'Triple') K <- par1
nx <- length(x)
nxmK <- nx - K
x <- ts(x, frequency = par1)
if (par2 == 'Single') fit <- HoltWinters(x, gamma=F, beta=F)
if (par2 == 'Double') fit <- HoltWinters(x, gamma=F)
if (par2 == 'Triple') fit <- HoltWinters(x, seasonal=par3)
fit
myresid <- x - fit$fitted[,'xhat']
bitmap(file='test1.png')
op <- par(mfrow=c(2,1))
plot(fit,ylab='Observed (black) / Fitted (red)',main='Interpolation Fit of Exponential Smoothing')
plot(myresid,ylab='Residuals',main='Interpolation Prediction Errors')
par(op)
dev.off()
bitmap(file='test2.png')
p <- predict(fit, par1, prediction.interval=TRUE)
np <- length(p[,1])
plot(fit,p,ylab='Observed (black) / Fitted (red)',main='Extrapolation Fit of Exponential Smoothing')
dev.off()
bitmap(file='test3.png')
op <- par(mfrow = c(2,2))
acf(as.numeric(myresid),lag.max = nx/2,main='Residual ACF')
spectrum(myresid,main='Residals Periodogram')
cpgram(myresid,main='Residal Cumulative Periodogram')
qqnorm(myresid,main='Residual Normal QQ Plot')
qqline(myresid)
par(op)
dev.off()
load(file='createtable')
a<-table.start()
a<-table.row.start(a)
a<-table.element(a,'Estimated Parameters of Exponential Smoothing',2,TRUE)
a<-table.row.end(a)
a<-table.row.start(a)
a<-table.element(a,'Parameter',header=TRUE)
a<-table.element(a,'Value',header=TRUE)
a<-table.row.end(a)
a<-table.row.start(a)
a<-table.element(a,'alpha',header=TRUE)
a<-table.element(a,fit$alpha)
a<-table.row.end(a)
a<-table.row.start(a)
a<-table.element(a,'beta',header=TRUE)
a<-table.element(a,fit$beta)
a<-table.row.end(a)
a<-table.row.start(a)
a<-table.element(a,'gamma',header=TRUE)
a<-table.element(a,fit$gamma)
a<-table.row.end(a)
a<-table.end(a)
table.save(a,file='mytable.tab')
a<-table.start()
a<-table.row.start(a)
a<-table.element(a,'Interpolation Forecasts of Exponential Smoothing',4,TRUE)
a<-table.row.end(a)
a<-table.row.start(a)
a<-table.element(a,'t',header=TRUE)
a<-table.element(a,'Observed',header=TRUE)
a<-table.element(a,'Fitted',header=TRUE)
a<-table.element(a,'Residuals',header=TRUE)
a<-table.row.end(a)
for (i in 1:nxmK) {
a<-table.row.start(a)
a<-table.element(a,i+K,header=TRUE)
a<-table.element(a,x[i+K])
a<-table.element(a,fit$fitted[i,'xhat'])
a<-table.element(a,myresid[i])
a<-table.row.end(a)
}
a<-table.end(a)
table.save(a,file='mytable1.tab')
a<-table.start()
a<-table.row.start(a)
a<-table.element(a,'Extrapolation Forecasts of Exponential Smoothing',4,TRUE)
a<-table.row.end(a)
a<-table.row.start(a)
a<-table.element(a,'t',header=TRUE)
a<-table.element(a,'Forecast',header=TRUE)
a<-table.element(a,'95% Lower Bound',header=TRUE)
a<-table.element(a,'95% Upper Bound',header=TRUE)
a<-table.row.end(a)
for (i in 1:np) {
a<-table.row.start(a)
a<-table.element(a,nx+i,header=TRUE)
a<-table.element(a,p[i,'fit'])
a<-table.element(a,p[i,'lwr'])
a<-table.element(a,p[i,'upr'])
a<-table.row.end(a)
}
a<-table.end(a)
table.save(a,file='mytable2.tab')