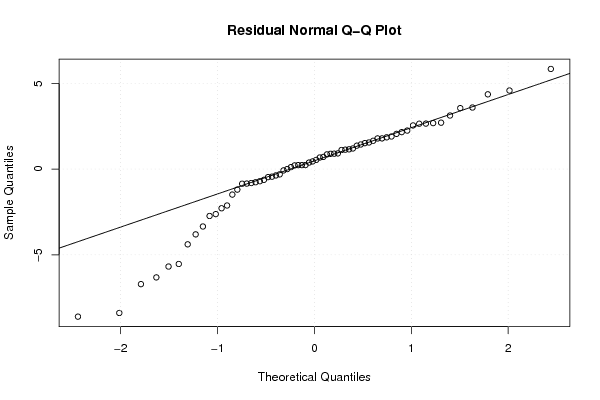
| Multiple Linear Regression - Estimated Regression Equation |
| productie[t] = + 46.1552447002207 + 0.00505160940148495uitvoer[t] + 0.0383667038748176ondernemersvertrouwen[t] -0.00168342883758715invoer[t] -0.811036404092018M1[t] -0.973083226425028M2[t] + 2.90543493194508M3[t] + 0.833635686943556M4[t] -0.761320508547857M5[t] + 3.8949428776532M6[t] -16.7307285401992M7[t] + 2.80207449536563M8[t] + 4.80789720302752M9[t] + 5.7307324544371M10[t] + 2.13148046506502M11[t] + e[t] |
| Multiple Linear Regression - Ordinary Least Squares | |||||
| Variable | Parameter | S.D. | T-STAT H0: parameter = 0 | 2-tail p-value | 1-tail p-value |
| (Intercept) | 46.1552447002207 | 6.365331 | 7.251 | 0 | 0 |
| uitvoer | 0.00505160940148495 | 0.001218 | 4.1488 | 0.000122 | 6.1e-05 |
| ondernemersvertrouwen | 0.0383667038748176 | 0.064588 | 0.594 | 0.555026 | 0.277513 |
| invoer | -0.00168342883758715 | 0.000934 | -1.8021 | 0.077217 | 0.038609 |
| M1 | -0.811036404092018 | 2.031718 | -0.3992 | 0.691359 | 0.34568 |
| M2 | -0.973083226425028 | 2.304074 | -0.4223 | 0.674491 | 0.337246 |
| M3 | 2.90543493194508 | 2.665866 | 1.0899 | 0.280703 | 0.140351 |
| M4 | 0.833635686943556 | 2.318668 | 0.3595 | 0.720626 | 0.360313 |
| M5 | -0.761320508547857 | 2.424216 | -0.314 | 0.754717 | 0.377359 |
| M6 | 3.8949428776532 | 2.884573 | 1.3503 | 0.182668 | 0.091334 |
| M7 | -16.7307285401992 | 2.654719 | -6.3023 | 0 | 0 |
| M8 | 2.80207449536563 | 2.008727 | 1.395 | 0.16885 | 0.084425 |
| M9 | 4.80789720302752 | 2.835534 | 1.6956 | 0.095832 | 0.047916 |
| M10 | 5.7307324544371 | 2.741573 | 2.0903 | 0.041403 | 0.020701 |
| M11 | 2.13148046506502 | 2.368087 | 0.9001 | 0.372146 | 0.186073 |
| Multiple Linear Regression - Regression Statistics | |
| Multiple R | 0.956648353467096 |
| R-squared | 0.915176072191306 |
| Adjusted R-squared | 0.892769751638066 |
| F-TEST (value) | 40.8445496446749 |
| F-TEST (DF numerator) | 14 |
| F-TEST (DF denominator) | 53 |
| p-value | 0 |
| Multiple Linear Regression - Residual Statistics | |
| Residual Standard Deviation | 3.25824317233053 |
| Sum Squared Residuals | 562.65587421204 |
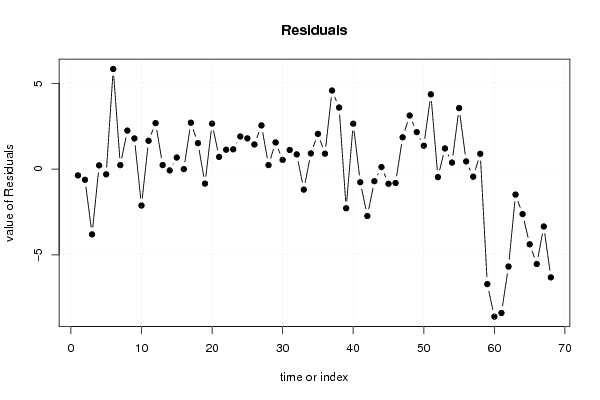
| Multiple Linear Regression - Actuals, Interpolation, and Residuals | |||
| Time or Index | Actuals | Interpolation Forecast | Residuals Prediction Error |
| 1 | 94.6 | 94.969598057866 | -0.369598057866019 |
| 2 | 95.9 | 96.526156617868 | -0.626156617868087 |
| 3 | 104.7 | 108.507378302136 | -3.80737830213619 |
| 4 | 102.8 | 102.585556631797 | 0.214443368202853 |
| 5 | 98.1 | 98.4066701041732 | -0.306670104173226 |
| 6 | 113.9 | 108.060332635596 | 5.83966736440451 |
| 7 | 80.9 | 80.6683122864409 | 0.231687713559128 |
| 8 | 95.7 | 93.454720240091 | 2.24527975990896 |
| 9 | 113.2 | 111.413254714242 | 1.78674528575835 |
| 10 | 105.9 | 108.024031658051 | -2.12403165805073 |
| 11 | 108.8 | 107.149541869433 | 1.65045813056723 |
| 12 | 102.3 | 99.6180856094853 | 2.68191439051471 |
| 13 | 99 | 98.7657035376907 | 0.234296462309329 |
| 14 | 100.7 | 100.778189175965 | -0.0781891759648243 |
| 15 | 115.5 | 114.825736356014 | 0.67426364398636 |
| 16 | 100.7 | 100.698463052538 | 0.00153694746230977 |
| 17 | 109.9 | 107.194037046041 | 2.70596295395865 |
| 18 | 114.6 | 113.086360459366 | 1.51363954063359 |
| 19 | 85.4 | 86.245657372753 | -0.845657372752984 |
| 20 | 100.5 | 97.848825297835 | 2.65117470216506 |
| 21 | 114.8 | 114.09065238837 | 0.709347611630004 |
| 22 | 116.5 | 115.369202254961 | 1.13079774503859 |
| 23 | 112.9 | 111.746896099671 | 1.15310390032901 |
| 24 | 102 | 100.097975011781 | 1.90202498821894 |
| 25 | 106 | 104.209981784296 | 1.79001821570377 |
| 26 | 105.3 | 103.865183773834 | 1.43481622616565 |
| 27 | 118.8 | 116.254335916183 | 2.54566408381689 |
| 28 | 106.1 | 105.867123959049 | 0.232876040950923 |
| 29 | 109.3 | 107.747983946984 | 1.55201605301631 |
| 30 | 117.2 | 116.665625436352 | 0.534374563647559 |
| 31 | 92.5 | 91.3860761225183 | 1.11392387748171 |
| 32 | 104.2 | 103.343643062282 | 0.856356937717804 |
| 33 | 112.5 | 113.697229521053 | -1.197229521053 |
| 34 | 122.4 | 121.484807003031 | 0.915192996969053 |
| 35 | 113.3 | 111.245847431050 | 2.05415256895049 |
| 36 | 100 | 99.100976196418 | 0.899023803582064 |
| 37 | 110.7 | 106.119112515975 | 4.58088748402466 |
| 38 | 112.8 | 109.211144473798 | 3.58885552620155 |
| 39 | 109.8 | 112.085196433485 | -2.28519643348522 |
| 40 | 117.3 | 114.654409109446 | 2.64559089055353 |
| 41 | 109.1 | 109.866681550249 | -0.76668155024892 |
| 42 | 115.9 | 118.634337700095 | -2.73433770009517 |
| 43 | 96 | 96.7073036832525 | -0.707303683252473 |
| 44 | 99.8 | 99.684088503765 | 0.115911496235029 |
| 45 | 116.8 | 117.655097115629 | -0.855097115629007 |
| 46 | 115.7 | 116.512477458939 | -0.812477458939358 |
| 47 | 99.4 | 97.5476323575325 | 1.85236764246753 |
| 48 | 94.3 | 91.17694524485 | 3.12305475515003 |
| 49 | 91 | 88.844677011853 | 2.15532298814703 |
| 50 | 93.2 | 91.8351713002317 | 1.36482869976828 |
| 51 | 103.1 | 98.7399774263942 | 4.36002257360574 |
| 52 | 94.1 | 94.5684811180168 | -0.468481118016770 |
| 53 | 91.8 | 90.5961728917603 | 1.20382710823968 |
| 54 | 102.7 | 102.319358498603 | 0.380641501397293 |
| 55 | 82.6 | 79.0446914694287 | 3.55530853057128 |
| 56 | 89.1 | 88.6521973895424 | 0.447802610457574 |
| 57 | 104.5 | 104.943766260706 | -0.443766260706347 |
| 58 | 105.1 | 104.209481625018 | 0.89051837498245 |
| 59 | 95.1 | 101.810082242314 | -6.71008224231426 |
| 60 | 88.7 | 97.3060179374658 | -8.60601793746575 |
| 61 | 86.3 | 94.6909270923188 | -8.39092709231877 |
| 62 | 91.8 | 97.4841546583026 | -5.68415465830257 |
| 63 | 111.5 | 112.987375565788 | -1.48737556578758 |
| 64 | 99.7 | 102.325966129153 | -2.62596612915285 |
| 65 | 97.5 | 101.888454460793 | -4.3884544607925 |
| 66 | 111.7 | 117.233985269988 | -5.53398526998778 |
| 67 | 86.2 | 89.5479590656066 | -3.34795906560665 |
| 68 | 95.4 | 101.716525506484 | -6.31652550648442 |
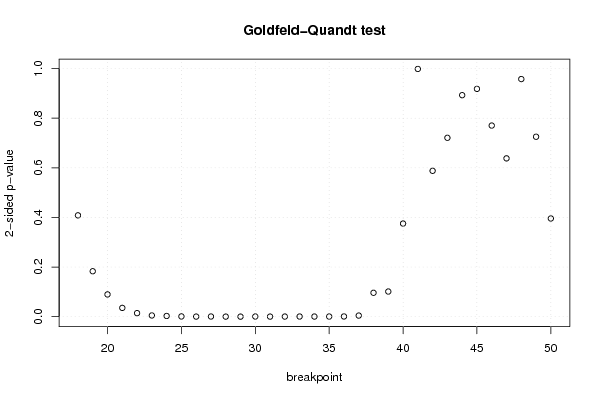
| Goldfeld-Quandt test for Heteroskedasticity | |||
| p-values | Alternative Hypothesis | ||
| breakpoint index | greater | 2-sided | less |
| 18 | 0.204241237356359 | 0.408482474712718 | 0.795758762643641 |
| 19 | 0.0915902683032055 | 0.183180536606411 | 0.908409731696795 |
| 20 | 0.0448605062004119 | 0.0897210124008238 | 0.955139493799588 |
| 21 | 0.0177213931126614 | 0.0354427862253227 | 0.982278606887339 |
| 22 | 0.00718135558994334 | 0.0143627111798867 | 0.992818644410057 |
| 23 | 0.00248608533915074 | 0.00497217067830148 | 0.99751391466085 |
| 24 | 0.00146120360638945 | 0.00292240721277891 | 0.99853879639361 |
| 25 | 0.000507176965821918 | 0.00101435393164384 | 0.999492823034178 |
| 26 | 0.000188818391732301 | 0.000377636783464601 | 0.999811181608268 |
| 27 | 0.000359906954673567 | 0.000719813909347134 | 0.999640093045326 |
| 28 | 0.000139996488128244 | 0.000279992976256488 | 0.999860003511872 |
| 29 | 6.60396745814442e-05 | 0.000132079349162888 | 0.999933960325418 |
| 30 | 0.000346044834059082 | 0.000692089668118165 | 0.99965395516594 |
| 31 | 0.000178433378315343 | 0.000356866756630687 | 0.999821566621685 |
| 32 | 0.000236641577457648 | 0.000473283154915297 | 0.999763358422542 |
| 33 | 0.000323891164706825 | 0.00064778232941365 | 0.999676108835293 |
| 34 | 0.000253753017868478 | 0.000507506035736956 | 0.999746246982132 |
| 35 | 0.000270165696905012 | 0.000540331393810023 | 0.999729834303095 |
| 36 | 0.000457255613132525 | 0.000914511226265049 | 0.999542744386867 |
| 37 | 0.00221800157764916 | 0.00443600315529833 | 0.99778199842235 |
| 38 | 0.0481614440705238 | 0.0963228881410476 | 0.951838555929476 |
| 39 | 0.0506935151423605 | 0.101387030284721 | 0.94930648485764 |
| 40 | 0.187673679871330 | 0.375347359742659 | 0.81232632012867 |
| 41 | 0.499255375715733 | 0.998510751431466 | 0.500744624284267 |
| 42 | 0.706032052838019 | 0.587935894323963 | 0.293967947161981 |
| 43 | 0.63947114622992 | 0.721057707540159 | 0.360528853770080 |
| 44 | 0.553613514651145 | 0.892772970697711 | 0.446386485348855 |
| 45 | 0.459031595357453 | 0.918063190714906 | 0.540968404642547 |
| 46 | 0.385188685358491 | 0.770377370716982 | 0.614811314641509 |
| 47 | 0.319090938472801 | 0.638181876945601 | 0.6809090615272 |
| 48 | 0.478876520128577 | 0.957753040257155 | 0.521123479871423 |
| 49 | 0.637374651467775 | 0.725250697064451 | 0.362625348532225 |
| 50 | 0.80209534102294 | 0.395809317954119 | 0.197904658977059 |
| Meta Analysis of Goldfeld-Quandt test for Heteroskedasticity | |||
| Description | # significant tests | % significant tests | OK/NOK |
| 1% type I error level | 15 | 0.454545454545455 | NOK |
| 5% type I error level | 17 | 0.515151515151515 | NOK |
| 10% type I error level | 19 | 0.575757575757576 | NOK |