| Tabulation of Results | ||
| Motivatie x Leermogelijkheden | ||
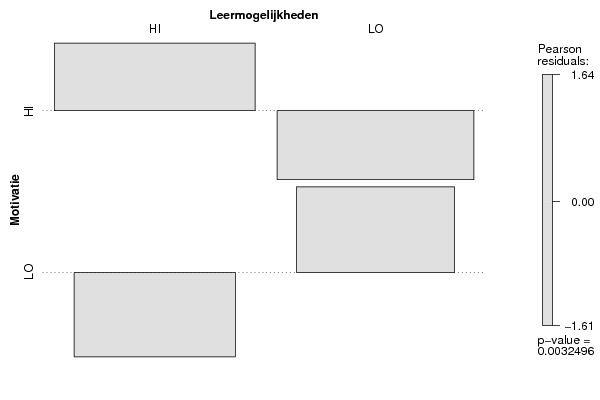
| HI | LO | HI | 53 | 34 | LO | 20 | 36 |
| Tabulation of Expected Results | ||
| Motivatie x Leermogelijkheden | ||
| HI | LO | HI | 44.41 | 42.59 | LO | 28.59 | 27.41 |
| Statistical Results | |
| Pearson's Chi-squared test with simulated p-value (based on 2000 replicates) | |
| Exact Pearson Chi Square Statistic | 8.66 |
| P value | 0 |