| Tabulation of Results | ||
| Persoonlijke_redenen x Leermogelijkheden | ||
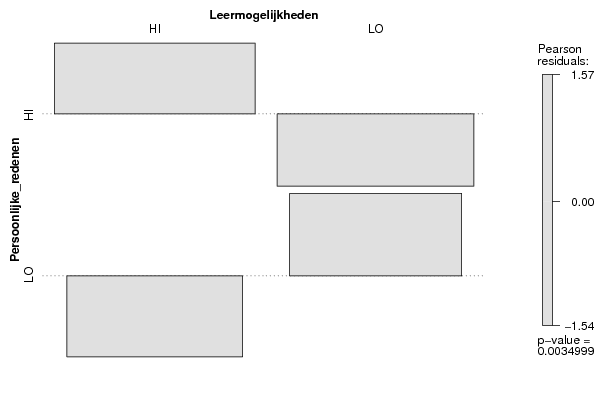
| HI | LO | HI | 50 | 31 | LO | 23 | 39 |
| Tabulation of Expected Results | ||
| Persoonlijke_redenen x Leermogelijkheden | ||
| HI | LO | HI | 41.35 | 39.65 | LO | 31.65 | 30.35 |
| Statistical Results | |
| Pearson's Chi-squared test with simulated p-value (based on 2000 replicates) | |
| Exact Pearson Chi Square Statistic | 8.53 |
| P value | 0 |