| Tabulation of Results | ||
| Ouders x Motivatie | ||
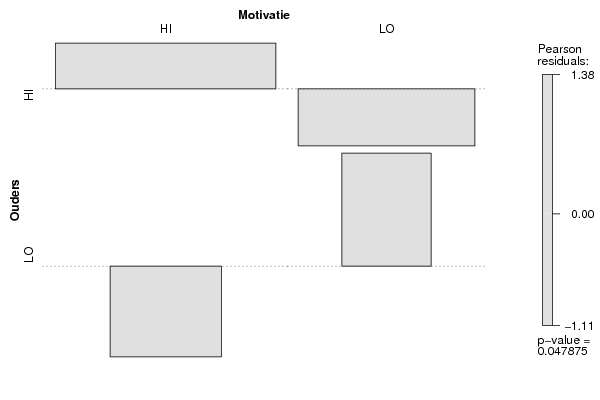
| HI | LO | HI | 74 | 40 | LO | 13 | 16 |
| Tabulation of Expected Results | ||
| Ouders x Motivatie | ||
| HI | LO | HI | 69.36 | 44.64 | LO | 17.64 | 11.36 |
| Statistical Results | |
| Pearson's Chi-squared test with simulated p-value (based on 2000 replicates) | |
| Exact Pearson Chi Square Statistic | 3.91 |
| P value | 0.06 |