| Tabulation of Results | ||
| Ouders x Leermogelijkheden | ||
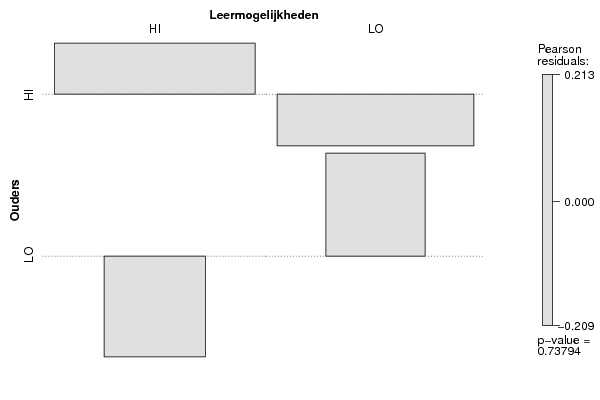
| HI | LO | HI | 59 | 55 | LO | 14 | 15 |
| Tabulation of Expected Results | ||
| Ouders x Leermogelijkheden | ||
| HI | LO | HI | 58.2 | 55.8 | LO | 14.8 | 14.2 |
| Statistical Results | |
| Pearson's Chi-squared test with simulated p-value (based on 2000 replicates) | |
| Exact Pearson Chi Square Statistic | 0.11 |
| P value | 0.83 |