| Tabulation of Results | ||
| Ouders x Persoonlijke_redenen | ||
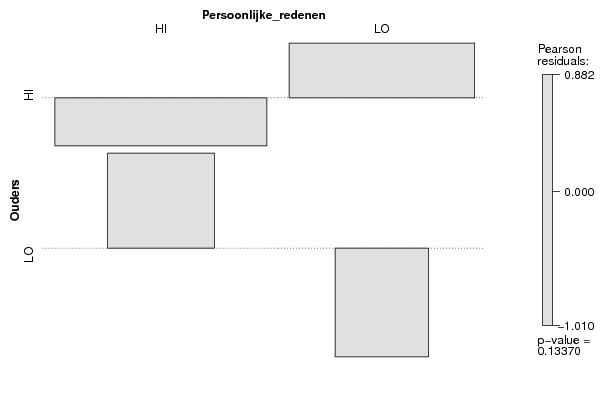
| HI | LO | HI | 61 | 53 | LO | 20 | 9 |
| Tabulation of Expected Results | ||
| Ouders x Persoonlijke_redenen | ||
| HI | LO | HI | 64.57 | 49.43 | LO | 16.43 | 12.57 |
| Statistical Results | |
| Pearson's Chi-squared test with simulated p-value (based on 2000 replicates) | |
| Exact Pearson Chi Square Statistic | 2.25 |
| P value | 0.13 |