| Tabulation of Results | ||
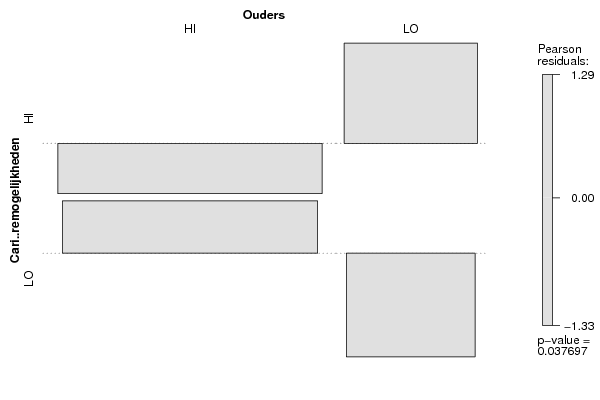
| Carièremogelijkheden x Ouders | ||
| HI | LO | HI | 54 | 20 | LO | 60 | 9 |
| Tabulation of Expected Results | ||
| Carièremogelijkheden x Ouders | ||
| HI | LO | HI | 58.99 | 15.01 | LO | 55.01 | 13.99 |
| Statistical Results | |
| Pearson's Chi-squared test with simulated p-value (based on 2000 replicates) | |
| Exact Pearson Chi Square Statistic | 4.32 |
| P value | 0.06 |