| Tabulation of Results | ||
| Carièremogelijkheden x Persoonlijke_redenen | ||
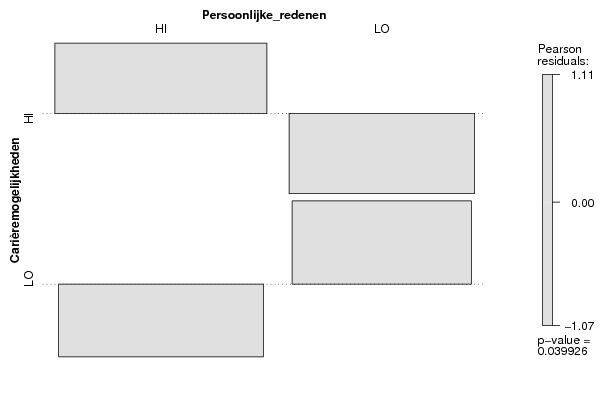
| HI | LO | HI | 48 | 26 | LO | 33 | 36 |
| Tabulation of Expected Results | ||
| Carièremogelijkheden x Persoonlijke_redenen | ||
| HI | LO | HI | 41.92 | 32.08 | LO | 39.08 | 29.92 |
| Statistical Results | |
| Pearson's Chi-squared test with simulated p-value (based on 2000 replicates) | |
| Exact Pearson Chi Square Statistic | 4.22 |
| P value | 0.05 |