Free Statistics

of Irreproducible Research!

Author's title

Author*The author of this computation has been verified*
R Software Modulerwasp_autocorrelation.wasp
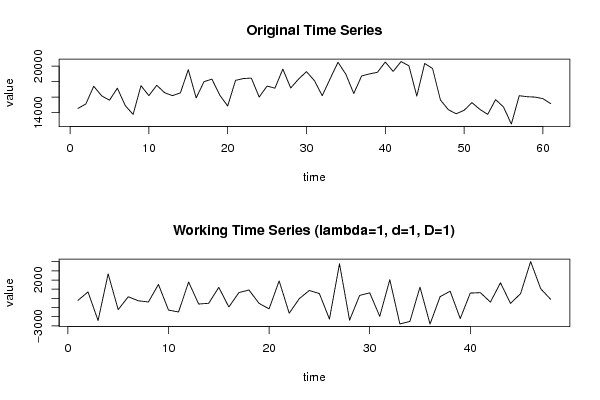
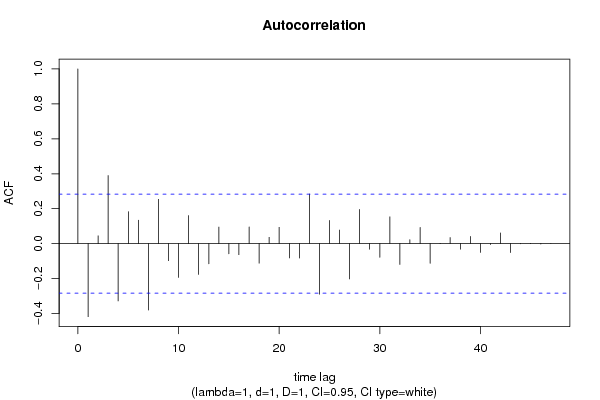
Title produced by software(Partial) Autocorrelation Function
Date of computationSat, 18 Dec 2010 15:14:54 +0000
Cite this page as followsStatistical Computations at FreeStatistics.org, Office for Research Development and Education, URL https://freestatistics.org/blog/index.php?v=date/2010/Dec/18/t1292685195r9sl9oqmsyokus7.htm/, Retrieved Tue, 30 Apr 2024 03:44:32 +0000
Statistical Computations at FreeStatistics.org, Office for Research Development and Education, URL https://freestatistics.org/blog/index.php?pk=112029, Retrieved Tue, 30 Apr 2024 03:44:32 +0000
QR Codes:

Original text written by user:
IsPrivate?No (this computation is public)
User-defined keywords
Estimated Impact121
Family? (F = Feedback message, R = changed R code, M = changed R Module, P = changed Parameters, D = changed Data)
-     [(Partial) Autocorrelation Function] [autocorrelatiefun...] [2010-12-18 13:12:07] [b659239b537e56f17142ee5c56ad6265]
-   P     [(Partial) Autocorrelation Function] [Gedifferentieerde...] [2010-12-18 15:14:54] [efffa7146cfe4c2b113f6c7f36d84ca0] [Current]
Feedback Forum

Post a new message
Dataseries X:
14544
15116
17413
16181
15607
17160
14915
13768
17487
16198
17535
16571
16198
16554
19554
15903
18003
18329
16260
14851
18174
18406
18466
16016
17428
17167
19630
17183
18344
19301
18147
16192
18374
20515
18957
16471
18746
19009
19211
20547
19325
20605
20056
16141
20359
19711
15638
14384
13855
14308
15290
14423
13779
15686
14733
12522
16189
16059
16007
15806
15160


Summary of computational transaction
Raw Inputview raw input (R code)
Raw Outputview raw output of R engine
Computing time2 seconds
R Server'George Udny Yule' @ 72.249.76.132

\begin{tabular}{lllllllll}
\hline
Summary of computational transaction \tabularnewline
Raw Input & view raw input (R code)  \tabularnewline
Raw Output & view raw output of R engine  \tabularnewline
Computing time & 2 seconds \tabularnewline
R Server & 'George Udny Yule' @ 72.249.76.132 \tabularnewline
\hline
\end{tabular}
%Source: https://freestatistics.org/blog/index.php?pk=112029&T=0

[TABLE]
[ROW][C]Summary of computational transaction[/C][/ROW]
[ROW][C]Raw Input[/C][C]view raw input (R code) [/C][/ROW]
[ROW][C]Raw Output[/C][C]view raw output of R engine [/C][/ROW]
[ROW][C]Computing time[/C][C]2 seconds[/C][/ROW]
[ROW][C]R Server[/C][C]'George Udny Yule' @ 72.249.76.132[/C][/ROW]
[/TABLE]
Source: https://freestatistics.org/blog/index.php?pk=112029&T=0

Globally Unique Identifier (entire table): ba.freestatistics.org/blog/index.php?pk=112029&T=0

As an alternative you can also use a QR Code:  

The GUIDs for individual cells are displayed in the table below:

Summary of computational transaction
Raw Inputview raw input (R code)
Raw Outputview raw output of R engine
Computing time2 seconds
R Server'George Udny Yule' @ 72.249.76.132


Autocorrelation Function
Time lag kACF(k)T-STATP-value
1-0.418123-2.89680.002831
20.044740.310.378964
30.389372.69760.004804
4-0.32798-2.27230.013793
50.1826691.26560.105889
60.1344620.93160.178109
7-0.380672-2.63740.005613
80.2538041.75840.042526
9-0.097646-0.67650.250982
10-0.193409-1.340.093281
110.1605441.11230.135779
12-0.176372-1.22190.113848
13-0.115667-0.80140.213435
140.094890.65740.257027
15-0.058345-0.40420.343921
16-0.063258-0.43830.331581
170.0953430.66060.256028
18-0.112064-0.77640.22066
190.0362850.25140.401294
200.0930440.64460.26112
21-0.081956-0.56780.286405
22-0.082869-0.57410.284278
230.2839711.96740.027465
24-0.289766-2.00760.025169
250.1324660.91770.181669
260.0777870.53890.296216
27-0.202235-1.40110.083804
280.1956671.35560.090782
29-0.032156-0.22280.412326
30-0.078563-0.54430.294378
310.1532211.06150.146877
32-0.119323-0.82670.206251
330.0224240.15540.438594
340.0928890.64360.261464
35-0.112428-0.77890.219924
360.0019290.01340.494695
370.0350070.24250.404699
38-0.031539-0.21850.413981
390.041220.28560.388215
40-0.050256-0.34820.364613
41-0.005519-0.03820.484828
420.0613110.42480.336449
43-0.051262-0.35520.362014
44-0.000818-0.00570.497751
450.0014510.010.496012
46-0.002454-0.0170.493254
470.0001880.00130.499484
48NANANA
49NANANA
50NANANA
51NANANA
52NANANA
53NANANA
54NANANA
55NANANA
56NANANA
57NANANA
58NANANA
59NANANA
60NANANA

\begin{tabular}{lllllllll}
\hline
Autocorrelation Function \tabularnewline
Time lag k & ACF(k) & T-STAT & P-value \tabularnewline
1 & -0.418123 & -2.8968 & 0.002831 \tabularnewline
2 & 0.04474 & 0.31 & 0.378964 \tabularnewline
3 & 0.38937 & 2.6976 & 0.004804 \tabularnewline
4 & -0.32798 & -2.2723 & 0.013793 \tabularnewline
5 & 0.182669 & 1.2656 & 0.105889 \tabularnewline
6 & 0.134462 & 0.9316 & 0.178109 \tabularnewline
7 & -0.380672 & -2.6374 & 0.005613 \tabularnewline
8 & 0.253804 & 1.7584 & 0.042526 \tabularnewline
9 & -0.097646 & -0.6765 & 0.250982 \tabularnewline
10 & -0.193409 & -1.34 & 0.093281 \tabularnewline
11 & 0.160544 & 1.1123 & 0.135779 \tabularnewline
12 & -0.176372 & -1.2219 & 0.113848 \tabularnewline
13 & -0.115667 & -0.8014 & 0.213435 \tabularnewline
14 & 0.09489 & 0.6574 & 0.257027 \tabularnewline
15 & -0.058345 & -0.4042 & 0.343921 \tabularnewline
16 & -0.063258 & -0.4383 & 0.331581 \tabularnewline
17 & 0.095343 & 0.6606 & 0.256028 \tabularnewline
18 & -0.112064 & -0.7764 & 0.22066 \tabularnewline
19 & 0.036285 & 0.2514 & 0.401294 \tabularnewline
20 & 0.093044 & 0.6446 & 0.26112 \tabularnewline
21 & -0.081956 & -0.5678 & 0.286405 \tabularnewline
22 & -0.082869 & -0.5741 & 0.284278 \tabularnewline
23 & 0.283971 & 1.9674 & 0.027465 \tabularnewline
24 & -0.289766 & -2.0076 & 0.025169 \tabularnewline
25 & 0.132466 & 0.9177 & 0.181669 \tabularnewline
26 & 0.077787 & 0.5389 & 0.296216 \tabularnewline
27 & -0.202235 & -1.4011 & 0.083804 \tabularnewline
28 & 0.195667 & 1.3556 & 0.090782 \tabularnewline
29 & -0.032156 & -0.2228 & 0.412326 \tabularnewline
30 & -0.078563 & -0.5443 & 0.294378 \tabularnewline
31 & 0.153221 & 1.0615 & 0.146877 \tabularnewline
32 & -0.119323 & -0.8267 & 0.206251 \tabularnewline
33 & 0.022424 & 0.1554 & 0.438594 \tabularnewline
34 & 0.092889 & 0.6436 & 0.261464 \tabularnewline
35 & -0.112428 & -0.7789 & 0.219924 \tabularnewline
36 & 0.001929 & 0.0134 & 0.494695 \tabularnewline
37 & 0.035007 & 0.2425 & 0.404699 \tabularnewline
38 & -0.031539 & -0.2185 & 0.413981 \tabularnewline
39 & 0.04122 & 0.2856 & 0.388215 \tabularnewline
40 & -0.050256 & -0.3482 & 0.364613 \tabularnewline
41 & -0.005519 & -0.0382 & 0.484828 \tabularnewline
42 & 0.061311 & 0.4248 & 0.336449 \tabularnewline
43 & -0.051262 & -0.3552 & 0.362014 \tabularnewline
44 & -0.000818 & -0.0057 & 0.497751 \tabularnewline
45 & 0.001451 & 0.01 & 0.496012 \tabularnewline
46 & -0.002454 & -0.017 & 0.493254 \tabularnewline
47 & 0.000188 & 0.0013 & 0.499484 \tabularnewline
48 & NA & NA & NA \tabularnewline
49 & NA & NA & NA \tabularnewline
50 & NA & NA & NA \tabularnewline
51 & NA & NA & NA \tabularnewline
52 & NA & NA & NA \tabularnewline
53 & NA & NA & NA \tabularnewline
54 & NA & NA & NA \tabularnewline
55 & NA & NA & NA \tabularnewline
56 & NA & NA & NA \tabularnewline
57 & NA & NA & NA \tabularnewline
58 & NA & NA & NA \tabularnewline
59 & NA & NA & NA \tabularnewline
60 & NA & NA & NA \tabularnewline
\hline
\end{tabular}
%Source: https://freestatistics.org/blog/index.php?pk=112029&T=1

[TABLE]
[ROW][C]Autocorrelation Function[/C][/ROW]
[ROW][C]Time lag k[/C][C]ACF(k)[/C][C]T-STAT[/C][C]P-value[/C][/ROW]
[ROW][C]1[/C][C]-0.418123[/C][C]-2.8968[/C][C]0.002831[/C][/ROW]
[ROW][C]2[/C][C]0.04474[/C][C]0.31[/C][C]0.378964[/C][/ROW]
[ROW][C]3[/C][C]0.38937[/C][C]2.6976[/C][C]0.004804[/C][/ROW]
[ROW][C]4[/C][C]-0.32798[/C][C]-2.2723[/C][C]0.013793[/C][/ROW]
[ROW][C]5[/C][C]0.182669[/C][C]1.2656[/C][C]0.105889[/C][/ROW]
[ROW][C]6[/C][C]0.134462[/C][C]0.9316[/C][C]0.178109[/C][/ROW]
[ROW][C]7[/C][C]-0.380672[/C][C]-2.6374[/C][C]0.005613[/C][/ROW]
[ROW][C]8[/C][C]0.253804[/C][C]1.7584[/C][C]0.042526[/C][/ROW]
[ROW][C]9[/C][C]-0.097646[/C][C]-0.6765[/C][C]0.250982[/C][/ROW]
[ROW][C]10[/C][C]-0.193409[/C][C]-1.34[/C][C]0.093281[/C][/ROW]
[ROW][C]11[/C][C]0.160544[/C][C]1.1123[/C][C]0.135779[/C][/ROW]
[ROW][C]12[/C][C]-0.176372[/C][C]-1.2219[/C][C]0.113848[/C][/ROW]
[ROW][C]13[/C][C]-0.115667[/C][C]-0.8014[/C][C]0.213435[/C][/ROW]
[ROW][C]14[/C][C]0.09489[/C][C]0.6574[/C][C]0.257027[/C][/ROW]
[ROW][C]15[/C][C]-0.058345[/C][C]-0.4042[/C][C]0.343921[/C][/ROW]
[ROW][C]16[/C][C]-0.063258[/C][C]-0.4383[/C][C]0.331581[/C][/ROW]
[ROW][C]17[/C][C]0.095343[/C][C]0.6606[/C][C]0.256028[/C][/ROW]
[ROW][C]18[/C][C]-0.112064[/C][C]-0.7764[/C][C]0.22066[/C][/ROW]
[ROW][C]19[/C][C]0.036285[/C][C]0.2514[/C][C]0.401294[/C][/ROW]
[ROW][C]20[/C][C]0.093044[/C][C]0.6446[/C][C]0.26112[/C][/ROW]
[ROW][C]21[/C][C]-0.081956[/C][C]-0.5678[/C][C]0.286405[/C][/ROW]
[ROW][C]22[/C][C]-0.082869[/C][C]-0.5741[/C][C]0.284278[/C][/ROW]
[ROW][C]23[/C][C]0.283971[/C][C]1.9674[/C][C]0.027465[/C][/ROW]
[ROW][C]24[/C][C]-0.289766[/C][C]-2.0076[/C][C]0.025169[/C][/ROW]
[ROW][C]25[/C][C]0.132466[/C][C]0.9177[/C][C]0.181669[/C][/ROW]
[ROW][C]26[/C][C]0.077787[/C][C]0.5389[/C][C]0.296216[/C][/ROW]
[ROW][C]27[/C][C]-0.202235[/C][C]-1.4011[/C][C]0.083804[/C][/ROW]
[ROW][C]28[/C][C]0.195667[/C][C]1.3556[/C][C]0.090782[/C][/ROW]
[ROW][C]29[/C][C]-0.032156[/C][C]-0.2228[/C][C]0.412326[/C][/ROW]
[ROW][C]30[/C][C]-0.078563[/C][C]-0.5443[/C][C]0.294378[/C][/ROW]
[ROW][C]31[/C][C]0.153221[/C][C]1.0615[/C][C]0.146877[/C][/ROW]
[ROW][C]32[/C][C]-0.119323[/C][C]-0.8267[/C][C]0.206251[/C][/ROW]
[ROW][C]33[/C][C]0.022424[/C][C]0.1554[/C][C]0.438594[/C][/ROW]
[ROW][C]34[/C][C]0.092889[/C][C]0.6436[/C][C]0.261464[/C][/ROW]
[ROW][C]35[/C][C]-0.112428[/C][C]-0.7789[/C][C]0.219924[/C][/ROW]
[ROW][C]36[/C][C]0.001929[/C][C]0.0134[/C][C]0.494695[/C][/ROW]
[ROW][C]37[/C][C]0.035007[/C][C]0.2425[/C][C]0.404699[/C][/ROW]
[ROW][C]38[/C][C]-0.031539[/C][C]-0.2185[/C][C]0.413981[/C][/ROW]
[ROW][C]39[/C][C]0.04122[/C][C]0.2856[/C][C]0.388215[/C][/ROW]
[ROW][C]40[/C][C]-0.050256[/C][C]-0.3482[/C][C]0.364613[/C][/ROW]
[ROW][C]41[/C][C]-0.005519[/C][C]-0.0382[/C][C]0.484828[/C][/ROW]
[ROW][C]42[/C][C]0.061311[/C][C]0.4248[/C][C]0.336449[/C][/ROW]
[ROW][C]43[/C][C]-0.051262[/C][C]-0.3552[/C][C]0.362014[/C][/ROW]
[ROW][C]44[/C][C]-0.000818[/C][C]-0.0057[/C][C]0.497751[/C][/ROW]
[ROW][C]45[/C][C]0.001451[/C][C]0.01[/C][C]0.496012[/C][/ROW]
[ROW][C]46[/C][C]-0.002454[/C][C]-0.017[/C][C]0.493254[/C][/ROW]
[ROW][C]47[/C][C]0.000188[/C][C]0.0013[/C][C]0.499484[/C][/ROW]
[ROW][C]48[/C][C]NA[/C][C]NA[/C][C]NA[/C][/ROW]
[ROW][C]49[/C][C]NA[/C][C]NA[/C][C]NA[/C][/ROW]
[ROW][C]50[/C][C]NA[/C][C]NA[/C][C]NA[/C][/ROW]
[ROW][C]51[/C][C]NA[/C][C]NA[/C][C]NA[/C][/ROW]
[ROW][C]52[/C][C]NA[/C][C]NA[/C][C]NA[/C][/ROW]
[ROW][C]53[/C][C]NA[/C][C]NA[/C][C]NA[/C][/ROW]
[ROW][C]54[/C][C]NA[/C][C]NA[/C][C]NA[/C][/ROW]
[ROW][C]55[/C][C]NA[/C][C]NA[/C][C]NA[/C][/ROW]
[ROW][C]56[/C][C]NA[/C][C]NA[/C][C]NA[/C][/ROW]
[ROW][C]57[/C][C]NA[/C][C]NA[/C][C]NA[/C][/ROW]
[ROW][C]58[/C][C]NA[/C][C]NA[/C][C]NA[/C][/ROW]
[ROW][C]59[/C][C]NA[/C][C]NA[/C][C]NA[/C][/ROW]
[ROW][C]60[/C][C]NA[/C][C]NA[/C][C]NA[/C][/ROW]
[/TABLE]
Source: https://freestatistics.org/blog/index.php?pk=112029&T=1

Globally Unique Identifier (entire table): ba.freestatistics.org/blog/index.php?pk=112029&T=1

As an alternative you can also use a QR Code:  

The GUIDs for individual cells are displayed in the table below:

Autocorrelation Function
Time lag kACF(k)T-STATP-value
1-0.418123-2.89680.002831
20.044740.310.378964
30.389372.69760.004804
4-0.32798-2.27230.013793
50.1826691.26560.105889
60.1344620.93160.178109
7-0.380672-2.63740.005613
80.2538041.75840.042526
9-0.097646-0.67650.250982
10-0.193409-1.340.093281
110.1605441.11230.135779
12-0.176372-1.22190.113848
13-0.115667-0.80140.213435
140.094890.65740.257027
15-0.058345-0.40420.343921
16-0.063258-0.43830.331581
170.0953430.66060.256028
18-0.112064-0.77640.22066
190.0362850.25140.401294
200.0930440.64460.26112
21-0.081956-0.56780.286405
22-0.082869-0.57410.284278
230.2839711.96740.027465
24-0.289766-2.00760.025169
250.1324660.91770.181669
260.0777870.53890.296216
27-0.202235-1.40110.083804
280.1956671.35560.090782
29-0.032156-0.22280.412326
30-0.078563-0.54430.294378
310.1532211.06150.146877
32-0.119323-0.82670.206251
330.0224240.15540.438594
340.0928890.64360.261464
35-0.112428-0.77890.219924
360.0019290.01340.494695
370.0350070.24250.404699
38-0.031539-0.21850.413981
390.041220.28560.388215
40-0.050256-0.34820.364613
41-0.005519-0.03820.484828
420.0613110.42480.336449
43-0.051262-0.35520.362014
44-0.000818-0.00570.497751
450.0014510.010.496012
46-0.002454-0.0170.493254
470.0001880.00130.499484
48NANANA
49NANANA
50NANANA
51NANANA
52NANANA
53NANANA
54NANANA
55NANANA
56NANANA
57NANANA
58NANANA
59NANANA
60NANANA


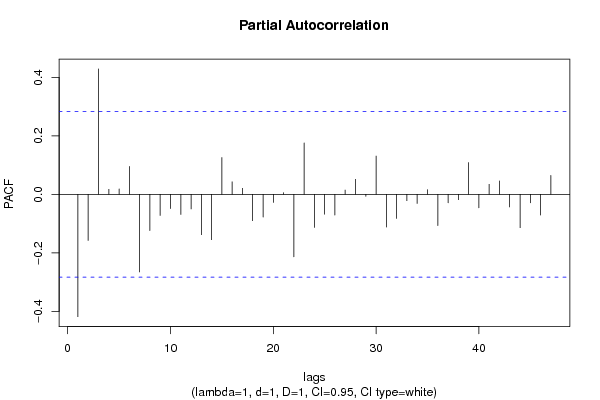
Partial Autocorrelation Function
Time lag kPACF(k)T-STATP-value
1-0.418123-2.89680.002831
2-0.157648-1.09220.140095
30.4288862.97140.002311
40.0171430.11880.452977
50.0186190.1290.448951
60.0954170.66110.255866
7-0.265031-1.83620.036263
8-0.123694-0.8570.197858
9-0.072124-0.49970.309789
10-0.048707-0.33750.368624
11-0.068528-0.47480.31855
12-0.049771-0.34480.365868
13-0.13788-0.95530.172116
14-0.155166-1.0750.14387
150.1260390.87320.193444
160.0430560.29830.383381
170.0205750.14250.443622
18-0.090035-0.62380.267862
19-0.077454-0.53660.297004
20-0.027744-0.19220.424193
210.0058780.04070.483843
22-0.213455-1.47890.072855
230.1759581.21910.114386
24-0.113148-0.78390.218472
25-0.067937-0.47070.32
26-0.070729-0.490.313174
270.0149520.10360.458962
280.0513460.35570.361798
29-0.006445-0.04470.482285
300.1309730.90740.184363
31-0.111822-0.77470.221151
32-0.082313-0.57030.285574
33-0.021648-0.150.440703
34-0.030815-0.21350.415923
350.016090.11150.455853
36-0.106654-0.73890.231777
37-0.028935-0.20050.420982
38-0.018304-0.12680.449808
390.1086540.75280.227629
40-0.045778-0.31720.376248
410.0343950.23830.406334
420.0458330.31750.376105
43-0.043012-0.2980.383496
44-0.114056-0.79020.216647
45-0.028873-0.20.421147
46-0.07064-0.48940.313391
470.0646410.44780.328139
48NANANA
49NANANA
50NANANA
51NANANA
52NANANA
53NANANA
54NANANA
55NANANA
56NANANA
57NANANA
58NANANA
59NANANA
60NANANA

\begin{tabular}{lllllllll}
\hline
Partial Autocorrelation Function \tabularnewline
Time lag k & PACF(k) & T-STAT & P-value \tabularnewline
1 & -0.418123 & -2.8968 & 0.002831 \tabularnewline
2 & -0.157648 & -1.0922 & 0.140095 \tabularnewline
3 & 0.428886 & 2.9714 & 0.002311 \tabularnewline
4 & 0.017143 & 0.1188 & 0.452977 \tabularnewline
5 & 0.018619 & 0.129 & 0.448951 \tabularnewline
6 & 0.095417 & 0.6611 & 0.255866 \tabularnewline
7 & -0.265031 & -1.8362 & 0.036263 \tabularnewline
8 & -0.123694 & -0.857 & 0.197858 \tabularnewline
9 & -0.072124 & -0.4997 & 0.309789 \tabularnewline
10 & -0.048707 & -0.3375 & 0.368624 \tabularnewline
11 & -0.068528 & -0.4748 & 0.31855 \tabularnewline
12 & -0.049771 & -0.3448 & 0.365868 \tabularnewline
13 & -0.13788 & -0.9553 & 0.172116 \tabularnewline
14 & -0.155166 & -1.075 & 0.14387 \tabularnewline
15 & 0.126039 & 0.8732 & 0.193444 \tabularnewline
16 & 0.043056 & 0.2983 & 0.383381 \tabularnewline
17 & 0.020575 & 0.1425 & 0.443622 \tabularnewline
18 & -0.090035 & -0.6238 & 0.267862 \tabularnewline
19 & -0.077454 & -0.5366 & 0.297004 \tabularnewline
20 & -0.027744 & -0.1922 & 0.424193 \tabularnewline
21 & 0.005878 & 0.0407 & 0.483843 \tabularnewline
22 & -0.213455 & -1.4789 & 0.072855 \tabularnewline
23 & 0.175958 & 1.2191 & 0.114386 \tabularnewline
24 & -0.113148 & -0.7839 & 0.218472 \tabularnewline
25 & -0.067937 & -0.4707 & 0.32 \tabularnewline
26 & -0.070729 & -0.49 & 0.313174 \tabularnewline
27 & 0.014952 & 0.1036 & 0.458962 \tabularnewline
28 & 0.051346 & 0.3557 & 0.361798 \tabularnewline
29 & -0.006445 & -0.0447 & 0.482285 \tabularnewline
30 & 0.130973 & 0.9074 & 0.184363 \tabularnewline
31 & -0.111822 & -0.7747 & 0.221151 \tabularnewline
32 & -0.082313 & -0.5703 & 0.285574 \tabularnewline
33 & -0.021648 & -0.15 & 0.440703 \tabularnewline
34 & -0.030815 & -0.2135 & 0.415923 \tabularnewline
35 & 0.01609 & 0.1115 & 0.455853 \tabularnewline
36 & -0.106654 & -0.7389 & 0.231777 \tabularnewline
37 & -0.028935 & -0.2005 & 0.420982 \tabularnewline
38 & -0.018304 & -0.1268 & 0.449808 \tabularnewline
39 & 0.108654 & 0.7528 & 0.227629 \tabularnewline
40 & -0.045778 & -0.3172 & 0.376248 \tabularnewline
41 & 0.034395 & 0.2383 & 0.406334 \tabularnewline
42 & 0.045833 & 0.3175 & 0.376105 \tabularnewline
43 & -0.043012 & -0.298 & 0.383496 \tabularnewline
44 & -0.114056 & -0.7902 & 0.216647 \tabularnewline
45 & -0.028873 & -0.2 & 0.421147 \tabularnewline
46 & -0.07064 & -0.4894 & 0.313391 \tabularnewline
47 & 0.064641 & 0.4478 & 0.328139 \tabularnewline
48 & NA & NA & NA \tabularnewline
49 & NA & NA & NA \tabularnewline
50 & NA & NA & NA \tabularnewline
51 & NA & NA & NA \tabularnewline
52 & NA & NA & NA \tabularnewline
53 & NA & NA & NA \tabularnewline
54 & NA & NA & NA \tabularnewline
55 & NA & NA & NA \tabularnewline
56 & NA & NA & NA \tabularnewline
57 & NA & NA & NA \tabularnewline
58 & NA & NA & NA \tabularnewline
59 & NA & NA & NA \tabularnewline
60 & NA & NA & NA \tabularnewline
\hline
\end{tabular}
%Source: https://freestatistics.org/blog/index.php?pk=112029&T=2

[TABLE]
[ROW][C]Partial Autocorrelation Function[/C][/ROW]
[ROW][C]Time lag k[/C][C]PACF(k)[/C][C]T-STAT[/C][C]P-value[/C][/ROW]
[ROW][C]1[/C][C]-0.418123[/C][C]-2.8968[/C][C]0.002831[/C][/ROW]
[ROW][C]2[/C][C]-0.157648[/C][C]-1.0922[/C][C]0.140095[/C][/ROW]
[ROW][C]3[/C][C]0.428886[/C][C]2.9714[/C][C]0.002311[/C][/ROW]
[ROW][C]4[/C][C]0.017143[/C][C]0.1188[/C][C]0.452977[/C][/ROW]
[ROW][C]5[/C][C]0.018619[/C][C]0.129[/C][C]0.448951[/C][/ROW]
[ROW][C]6[/C][C]0.095417[/C][C]0.6611[/C][C]0.255866[/C][/ROW]
[ROW][C]7[/C][C]-0.265031[/C][C]-1.8362[/C][C]0.036263[/C][/ROW]
[ROW][C]8[/C][C]-0.123694[/C][C]-0.857[/C][C]0.197858[/C][/ROW]
[ROW][C]9[/C][C]-0.072124[/C][C]-0.4997[/C][C]0.309789[/C][/ROW]
[ROW][C]10[/C][C]-0.048707[/C][C]-0.3375[/C][C]0.368624[/C][/ROW]
[ROW][C]11[/C][C]-0.068528[/C][C]-0.4748[/C][C]0.31855[/C][/ROW]
[ROW][C]12[/C][C]-0.049771[/C][C]-0.3448[/C][C]0.365868[/C][/ROW]
[ROW][C]13[/C][C]-0.13788[/C][C]-0.9553[/C][C]0.172116[/C][/ROW]
[ROW][C]14[/C][C]-0.155166[/C][C]-1.075[/C][C]0.14387[/C][/ROW]
[ROW][C]15[/C][C]0.126039[/C][C]0.8732[/C][C]0.193444[/C][/ROW]
[ROW][C]16[/C][C]0.043056[/C][C]0.2983[/C][C]0.383381[/C][/ROW]
[ROW][C]17[/C][C]0.020575[/C][C]0.1425[/C][C]0.443622[/C][/ROW]
[ROW][C]18[/C][C]-0.090035[/C][C]-0.6238[/C][C]0.267862[/C][/ROW]
[ROW][C]19[/C][C]-0.077454[/C][C]-0.5366[/C][C]0.297004[/C][/ROW]
[ROW][C]20[/C][C]-0.027744[/C][C]-0.1922[/C][C]0.424193[/C][/ROW]
[ROW][C]21[/C][C]0.005878[/C][C]0.0407[/C][C]0.483843[/C][/ROW]
[ROW][C]22[/C][C]-0.213455[/C][C]-1.4789[/C][C]0.072855[/C][/ROW]
[ROW][C]23[/C][C]0.175958[/C][C]1.2191[/C][C]0.114386[/C][/ROW]
[ROW][C]24[/C][C]-0.113148[/C][C]-0.7839[/C][C]0.218472[/C][/ROW]
[ROW][C]25[/C][C]-0.067937[/C][C]-0.4707[/C][C]0.32[/C][/ROW]
[ROW][C]26[/C][C]-0.070729[/C][C]-0.49[/C][C]0.313174[/C][/ROW]
[ROW][C]27[/C][C]0.014952[/C][C]0.1036[/C][C]0.458962[/C][/ROW]
[ROW][C]28[/C][C]0.051346[/C][C]0.3557[/C][C]0.361798[/C][/ROW]
[ROW][C]29[/C][C]-0.006445[/C][C]-0.0447[/C][C]0.482285[/C][/ROW]
[ROW][C]30[/C][C]0.130973[/C][C]0.9074[/C][C]0.184363[/C][/ROW]
[ROW][C]31[/C][C]-0.111822[/C][C]-0.7747[/C][C]0.221151[/C][/ROW]
[ROW][C]32[/C][C]-0.082313[/C][C]-0.5703[/C][C]0.285574[/C][/ROW]
[ROW][C]33[/C][C]-0.021648[/C][C]-0.15[/C][C]0.440703[/C][/ROW]
[ROW][C]34[/C][C]-0.030815[/C][C]-0.2135[/C][C]0.415923[/C][/ROW]
[ROW][C]35[/C][C]0.01609[/C][C]0.1115[/C][C]0.455853[/C][/ROW]
[ROW][C]36[/C][C]-0.106654[/C][C]-0.7389[/C][C]0.231777[/C][/ROW]
[ROW][C]37[/C][C]-0.028935[/C][C]-0.2005[/C][C]0.420982[/C][/ROW]
[ROW][C]38[/C][C]-0.018304[/C][C]-0.1268[/C][C]0.449808[/C][/ROW]
[ROW][C]39[/C][C]0.108654[/C][C]0.7528[/C][C]0.227629[/C][/ROW]
[ROW][C]40[/C][C]-0.045778[/C][C]-0.3172[/C][C]0.376248[/C][/ROW]
[ROW][C]41[/C][C]0.034395[/C][C]0.2383[/C][C]0.406334[/C][/ROW]
[ROW][C]42[/C][C]0.045833[/C][C]0.3175[/C][C]0.376105[/C][/ROW]
[ROW][C]43[/C][C]-0.043012[/C][C]-0.298[/C][C]0.383496[/C][/ROW]
[ROW][C]44[/C][C]-0.114056[/C][C]-0.7902[/C][C]0.216647[/C][/ROW]
[ROW][C]45[/C][C]-0.028873[/C][C]-0.2[/C][C]0.421147[/C][/ROW]
[ROW][C]46[/C][C]-0.07064[/C][C]-0.4894[/C][C]0.313391[/C][/ROW]
[ROW][C]47[/C][C]0.064641[/C][C]0.4478[/C][C]0.328139[/C][/ROW]
[ROW][C]48[/C][C]NA[/C][C]NA[/C][C]NA[/C][/ROW]
[ROW][C]49[/C][C]NA[/C][C]NA[/C][C]NA[/C][/ROW]
[ROW][C]50[/C][C]NA[/C][C]NA[/C][C]NA[/C][/ROW]
[ROW][C]51[/C][C]NA[/C][C]NA[/C][C]NA[/C][/ROW]
[ROW][C]52[/C][C]NA[/C][C]NA[/C][C]NA[/C][/ROW]
[ROW][C]53[/C][C]NA[/C][C]NA[/C][C]NA[/C][/ROW]
[ROW][C]54[/C][C]NA[/C][C]NA[/C][C]NA[/C][/ROW]
[ROW][C]55[/C][C]NA[/C][C]NA[/C][C]NA[/C][/ROW]
[ROW][C]56[/C][C]NA[/C][C]NA[/C][C]NA[/C][/ROW]
[ROW][C]57[/C][C]NA[/C][C]NA[/C][C]NA[/C][/ROW]
[ROW][C]58[/C][C]NA[/C][C]NA[/C][C]NA[/C][/ROW]
[ROW][C]59[/C][C]NA[/C][C]NA[/C][C]NA[/C][/ROW]
[ROW][C]60[/C][C]NA[/C][C]NA[/C][C]NA[/C][/ROW]
[/TABLE]
Source: https://freestatistics.org/blog/index.php?pk=112029&T=2

Globally Unique Identifier (entire table): ba.freestatistics.org/blog/index.php?pk=112029&T=2

As an alternative you can also use a QR Code:  

The GUIDs for individual cells are displayed in the table below:

Partial Autocorrelation Function
Time lag kPACF(k)T-STATP-value
1-0.418123-2.89680.002831
2-0.157648-1.09220.140095
30.4288862.97140.002311
40.0171430.11880.452977
50.0186190.1290.448951
60.0954170.66110.255866
7-0.265031-1.83620.036263
8-0.123694-0.8570.197858
9-0.072124-0.49970.309789
10-0.048707-0.33750.368624
11-0.068528-0.47480.31855
12-0.049771-0.34480.365868
13-0.13788-0.95530.172116
14-0.155166-1.0750.14387
150.1260390.87320.193444
160.0430560.29830.383381
170.0205750.14250.443622
18-0.090035-0.62380.267862
19-0.077454-0.53660.297004
20-0.027744-0.19220.424193
210.0058780.04070.483843
22-0.213455-1.47890.072855
230.1759581.21910.114386
24-0.113148-0.78390.218472
25-0.067937-0.47070.32
26-0.070729-0.490.313174
270.0149520.10360.458962
280.0513460.35570.361798
29-0.006445-0.04470.482285
300.1309730.90740.184363
31-0.111822-0.77470.221151
32-0.082313-0.57030.285574
33-0.021648-0.150.440703
34-0.030815-0.21350.415923
350.016090.11150.455853
36-0.106654-0.73890.231777
37-0.028935-0.20050.420982
38-0.018304-0.12680.449808
390.1086540.75280.227629
40-0.045778-0.31720.376248
410.0343950.23830.406334
420.0458330.31750.376105
43-0.043012-0.2980.383496
44-0.114056-0.79020.216647
45-0.028873-0.20.421147
46-0.07064-0.48940.313391
470.0646410.44780.328139
48NANANA
49NANANA
50NANANA
51NANANA
52NANANA
53NANANA
54NANANA
55NANANA
56NANANA
57NANANA
58NANANA
59NANANA
60NANANA


Parameters (Session):
par1 = 60 ; par2 = 1 ; par3 = 1 ; par4 = 1 ; par5 = 12 ; par6 = White Noise ; par7 = 0.95 ;
Parameters (R input):
par1 = 60 ; par2 = 1 ; par3 = 1 ; par4 = 1 ; par5 = 12 ; par6 = White Noise ; par7 = 0.95 ; par8 = ;
R code (references can be found in the software module):
if (par1 == 'Default') {
par1 = 10*log10(length(x))
} else {
par1 <- as.numeric(par1)
}
par2 <- as.numeric(par2)
par3 <- as.numeric(par3)
par4 <- as.numeric(par4)
par5 <- as.numeric(par5)
if (par6 == 'White Noise') par6 <- 'white' else par6 <- 'ma'
par7 <- as.numeric(par7)
if (par8 != '') par8 <- as.numeric(par8)
ox <- x
if (par8 == '') {
if (par2 == 0) {
x <- log(x)
} else {
x <- (x ^ par2 - 1) / par2
}
} else {
x <- log(x,base=par8)
}
if (par3 > 0) x <- diff(x,lag=1,difference=par3)
if (par4 > 0) x <- diff(x,lag=par5,difference=par4)
bitmap(file='picts.png')
op <- par(mfrow=c(2,1))
plot(ox,type='l',main='Original Time Series',xlab='time',ylab='value')
if (par8=='') {
mytitle <- paste('Working Time Series (lambda=',par2,', d=',par3,', D=',par4,')',sep='')
mysub <- paste('(lambda=',par2,', d=',par3,', D=',par4,', CI=', par7, ', CI type=',par6,')',sep='')
} else {
mytitle <- paste('Working Time Series (base=',par8,', d=',par3,', D=',par4,')',sep='')
mysub <- paste('(base=',par8,', d=',par3,', D=',par4,', CI=', par7, ', CI type=',par6,')',sep='')
}
plot(x,type='l', main=mytitle,xlab='time',ylab='value')
par(op)
dev.off()
bitmap(file='pic1.png')
racf <- acf(x, par1, main='Autocorrelation', xlab='time lag', ylab='ACF', ci.type=par6, ci=par7, sub=mysub)
dev.off()
bitmap(file='pic2.png')
rpacf <- pacf(x,par1,main='Partial Autocorrelation',xlab='lags',ylab='PACF',sub=mysub)
dev.off()
(myacf <- c(racf$acf))
(mypacf <- c(rpacf$acf))
lengthx <- length(x)
sqrtn <- sqrt(lengthx)
load(file='createtable')
a<-table.start()
a<-table.row.start(a)
a<-table.element(a,'Autocorrelation Function',4,TRUE)
a<-table.row.end(a)
a<-table.row.start(a)
a<-table.element(a,'Time lag k',header=TRUE)
a<-table.element(a,hyperlink('basics.htm','ACF(k)','click here for more information about the Autocorrelation Function'),header=TRUE)
a<-table.element(a,'T-STAT',header=TRUE)
a<-table.element(a,'P-value',header=TRUE)
a<-table.row.end(a)
for (i in 2:(par1+1)) {
a<-table.row.start(a)
a<-table.element(a,i-1,header=TRUE)
a<-table.element(a,round(myacf[i],6))
mytstat <- myacf[i]*sqrtn
a<-table.element(a,round(mytstat,4))
a<-table.element(a,round(1-pt(abs(mytstat),lengthx),6))
a<-table.row.end(a)
}
a<-table.end(a)
table.save(a,file='mytable.tab')
a<-table.start()
a<-table.row.start(a)
a<-table.element(a,'Partial Autocorrelation Function',4,TRUE)
a<-table.row.end(a)
a<-table.row.start(a)
a<-table.element(a,'Time lag k',header=TRUE)
a<-table.element(a,hyperlink('basics.htm','PACF(k)','click here for more information about the Partial Autocorrelation Function'),header=TRUE)
a<-table.element(a,'T-STAT',header=TRUE)
a<-table.element(a,'P-value',header=TRUE)
a<-table.row.end(a)
for (i in 1:par1) {
a<-table.row.start(a)
a<-table.element(a,i,header=TRUE)
a<-table.element(a,round(mypacf[i],6))
mytstat <- mypacf[i]*sqrtn
a<-table.element(a,round(mytstat,4))
a<-table.element(a,round(1-pt(abs(mytstat),lengthx),6))
a<-table.row.end(a)
}
a<-table.end(a)
table.save(a,file='mytable1.tab')