| Tabulation of Results | ||
| Carièremogelijkheden x Leermogelijkheden | ||
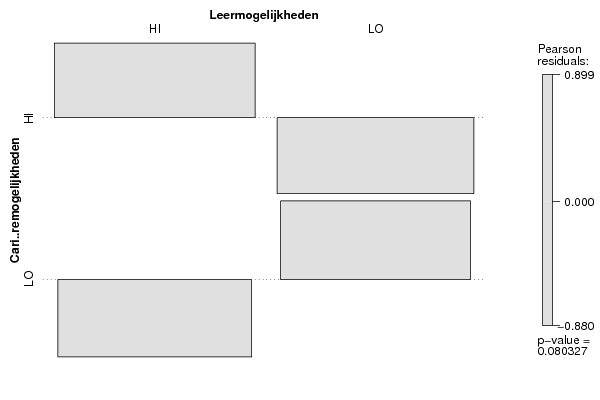
| HI | LO | HI | 43 | 31 | LO | 30 | 39 |
| Tabulation of Expected Results | ||
| Carièremogelijkheden x Leermogelijkheden | ||
| HI | LO | HI | 37.78 | 36.22 | LO | 35.22 | 33.78 |
| Statistical Results | |
| Pearson's Chi-squared test with simulated p-value (based on 2000 replicates) | |
| Exact Pearson Chi Square Statistic | 3.06 |
| P value | 0.09 |