Free Statistics

of Irreproducible Research!

Author's title

Author*The author of this computation has been verified*
R Software Modulerwasp_multipleregression.wasp
Title produced by softwareMultiple Regression
Date of computationSat, 18 Dec 2010 14:44:12 +0000
Cite this page as followsStatistical Computations at FreeStatistics.org, Office for Research Development and Education, URL https://freestatistics.org/blog/index.php?v=date/2010/Dec/18/t129268335499khwnyfwv2n42y.htm/, Retrieved Tue, 30 Apr 2024 01:57:51 +0000
Statistical Computations at FreeStatistics.org, Office for Research Development and Education, URL https://freestatistics.org/blog/index.php?pk=112013, Retrieved Tue, 30 Apr 2024 01:57:51 +0000
QR Codes:

Original text written by user:
IsPrivate?No (this computation is public)
User-defined keywords
Estimated Impact100
Family? (F = Feedback message, R = changed R code, M = changed R Module, P = changed Parameters, D = changed Data)
-     [Multiple Regression] [HPC Retail Sales] [2008-03-08 13:40:54] [1c0f2c85e8a48e42648374b3bcceca26]
-  MPD  [Multiple Regression] [WS8 Regression An...] [2010-11-29 11:19:54] [f4dc4aa51d65be851b8508203d9f6001]
-    D      [Multiple Regression] [Regressieanalyse ...] [2010-12-18 14:44:12] [7a87ed98a7b21a29d6a45388a9b7b229] [Current]
Feedback Forum

Post a new message
Dataseries X:
989236
1008380
1207763
1368839
1469798
1498721
1761769
1653214
1599104
1421179
1163995
1037735
1015407
1039210
1258049
1469445
1552346
1549144
1785895
1662335
1629440
1467430
1202209
1076982
1039367
1063449
1335135
1491602
1591972
1641248
1898849
1798580
1762444
1622044
1368955
1262973
1195650
1269530
1479279
1607819
1712466
1721766
1949843
1821326
1757802
1590367
1260647
1149235
1016367
1027885
1262159
1520854
1544144
1564709
1821776
1741365
1623386
1498658
1241822
1136029


Summary of computational transaction
Raw Inputview raw input (R code)
Raw Outputview raw output of R engine
Computing time6 seconds
R Server'RServer@AstonUniversity' @ vre.aston.ac.uk

\begin{tabular}{lllllllll}
\hline
Summary of computational transaction \tabularnewline
Raw Input & view raw input (R code)  \tabularnewline
Raw Output & view raw output of R engine  \tabularnewline
Computing time & 6 seconds \tabularnewline
R Server & 'RServer@AstonUniversity' @ vre.aston.ac.uk \tabularnewline
\hline
\end{tabular}
%Source: https://freestatistics.org/blog/index.php?pk=112013&T=0

[TABLE]
[ROW][C]Summary of computational transaction[/C][/ROW]
[ROW][C]Raw Input[/C][C]view raw input (R code) [/C][/ROW]
[ROW][C]Raw Output[/C][C]view raw output of R engine [/C][/ROW]
[ROW][C]Computing time[/C][C]6 seconds[/C][/ROW]
[ROW][C]R Server[/C][C]'RServer@AstonUniversity' @ vre.aston.ac.uk[/C][/ROW]
[/TABLE]
Source: https://freestatistics.org/blog/index.php?pk=112013&T=0

Globally Unique Identifier (entire table): ba.freestatistics.org/blog/index.php?pk=112013&T=0

As an alternative you can also use a QR Code:  

The GUIDs for individual cells are displayed in the table below:

Summary of computational transaction
Raw Inputview raw input (R code)
Raw Outputview raw output of R engine
Computing time6 seconds
R Server'RServer@AstonUniversity' @ vre.aston.ac.uk


Multiple Linear Regression - Estimated Regression Equation
PassengersBRU[t] = + 1046423.8 -55056.5944444449M1[t] -26964.7222222221M2[t] + 197427.95M3[t] + 378269.222222222M4[t] + 458309.094444444M5[t] + 476887.966666667M6[t] + 723003.238888889M7[t] + 612347.311111111M8[t] + 549024.983333333M9[t] + 392131.855555556M10[t] + 117328.327777778M11[t] + 2393.52777777778t + e[t]

\begin{tabular}{lllllllll}
\hline
Multiple Linear Regression - Estimated Regression Equation \tabularnewline
PassengersBRU[t] =  +  1046423.8 -55056.5944444449M1[t] -26964.7222222221M2[t] +  197427.95M3[t] +  378269.222222222M4[t] +  458309.094444444M5[t] +  476887.966666667M6[t] +  723003.238888889M7[t] +  612347.311111111M8[t] +  549024.983333333M9[t] +  392131.855555556M10[t] +  117328.327777778M11[t] +  2393.52777777778t  + e[t] \tabularnewline
\hline
\end{tabular}
%Source: https://freestatistics.org/blog/index.php?pk=112013&T=1

[TABLE]
[ROW][C]Multiple Linear Regression - Estimated Regression Equation[/C][/ROW]
[ROW][C]PassengersBRU[t] =  +  1046423.8 -55056.5944444449M1[t] -26964.7222222221M2[t] +  197427.95M3[t] +  378269.222222222M4[t] +  458309.094444444M5[t] +  476887.966666667M6[t] +  723003.238888889M7[t] +  612347.311111111M8[t] +  549024.983333333M9[t] +  392131.855555556M10[t] +  117328.327777778M11[t] +  2393.52777777778t  + e[t][/C][/ROW]
[/TABLE]
Source: https://freestatistics.org/blog/index.php?pk=112013&T=1

Globally Unique Identifier (entire table): ba.freestatistics.org/blog/index.php?pk=112013&T=1

As an alternative you can also use a QR Code:  

The GUIDs for individual cells are displayed in the table below:

Multiple Linear Regression - Estimated Regression Equation
PassengersBRU[t] = + 1046423.8 -55056.5944444449M1[t] -26964.7222222221M2[t] + 197427.95M3[t] + 378269.222222222M4[t] + 458309.094444444M5[t] + 476887.966666667M6[t] + 723003.238888889M7[t] + 612347.311111111M8[t] + 549024.983333333M9[t] + 392131.855555556M10[t] + 117328.327777778M11[t] + 2393.52777777778t + e[t]


Multiple Linear Regression - Ordinary Least Squares
VariableParameterS.D.T-STATH0: parameter = 02-tail p-value1-tail p-value
(Intercept)1046423.839446.61971426.527600
M1-55056.594444444947989.020536-1.14730.2570750.128537
M2-26964.722222222147917.321202-0.56270.576290.288145
M3197427.9547852.3578054.12580.000157.5e-05
M4378269.22222222247794.1578147.914500
M5458309.09444444447742.7459619.599600
M6476887.96666666747698.1441989.99800
M7723003.23888888947660.37164415.169900
M8612347.31111111147629.44454612.856500
M9549024.98333333347605.37624511.532800
M10392131.85555555647588.1771498.240100
M11117328.32777777847577.8547072.4660.0173670.008683
t2393.52777777778572.2312584.18280.0001256.2e-05

\begin{tabular}{lllllllll}
\hline
Multiple Linear Regression - Ordinary Least Squares \tabularnewline
Variable & Parameter & S.D. & T-STATH0: parameter = 0 & 2-tail p-value & 1-tail p-value \tabularnewline
(Intercept) & 1046423.8 & 39446.619714 & 26.5276 & 0 & 0 \tabularnewline
M1 & -55056.5944444449 & 47989.020536 & -1.1473 & 0.257075 & 0.128537 \tabularnewline
M2 & -26964.7222222221 & 47917.321202 & -0.5627 & 0.57629 & 0.288145 \tabularnewline
M3 & 197427.95 & 47852.357805 & 4.1258 & 0.00015 & 7.5e-05 \tabularnewline
M4 & 378269.222222222 & 47794.157814 & 7.9145 & 0 & 0 \tabularnewline
M5 & 458309.094444444 & 47742.745961 & 9.5996 & 0 & 0 \tabularnewline
M6 & 476887.966666667 & 47698.144198 & 9.998 & 0 & 0 \tabularnewline
M7 & 723003.238888889 & 47660.371644 & 15.1699 & 0 & 0 \tabularnewline
M8 & 612347.311111111 & 47629.444546 & 12.8565 & 0 & 0 \tabularnewline
M9 & 549024.983333333 & 47605.376245 & 11.5328 & 0 & 0 \tabularnewline
M10 & 392131.855555556 & 47588.177149 & 8.2401 & 0 & 0 \tabularnewline
M11 & 117328.327777778 & 47577.854707 & 2.466 & 0.017367 & 0.008683 \tabularnewline
t & 2393.52777777778 & 572.231258 & 4.1828 & 0.000125 & 6.2e-05 \tabularnewline
\hline
\end{tabular}
%Source: https://freestatistics.org/blog/index.php?pk=112013&T=2

[TABLE]
[ROW][C]Multiple Linear Regression - Ordinary Least Squares[/C][/ROW]
[ROW][C]Variable[/C][C]Parameter[/C][C]S.D.[/C][C]T-STATH0: parameter = 0[/C][C]2-tail p-value[/C][C]1-tail p-value[/C][/ROW]
[ROW][C](Intercept)[/C][C]1046423.8[/C][C]39446.619714[/C][C]26.5276[/C][C]0[/C][C]0[/C][/ROW]
[ROW][C]M1[/C][C]-55056.5944444449[/C][C]47989.020536[/C][C]-1.1473[/C][C]0.257075[/C][C]0.128537[/C][/ROW]
[ROW][C]M2[/C][C]-26964.7222222221[/C][C]47917.321202[/C][C]-0.5627[/C][C]0.57629[/C][C]0.288145[/C][/ROW]
[ROW][C]M3[/C][C]197427.95[/C][C]47852.357805[/C][C]4.1258[/C][C]0.00015[/C][C]7.5e-05[/C][/ROW]
[ROW][C]M4[/C][C]378269.222222222[/C][C]47794.157814[/C][C]7.9145[/C][C]0[/C][C]0[/C][/ROW]
[ROW][C]M5[/C][C]458309.094444444[/C][C]47742.745961[/C][C]9.5996[/C][C]0[/C][C]0[/C][/ROW]
[ROW][C]M6[/C][C]476887.966666667[/C][C]47698.144198[/C][C]9.998[/C][C]0[/C][C]0[/C][/ROW]
[ROW][C]M7[/C][C]723003.238888889[/C][C]47660.371644[/C][C]15.1699[/C][C]0[/C][C]0[/C][/ROW]
[ROW][C]M8[/C][C]612347.311111111[/C][C]47629.444546[/C][C]12.8565[/C][C]0[/C][C]0[/C][/ROW]
[ROW][C]M9[/C][C]549024.983333333[/C][C]47605.376245[/C][C]11.5328[/C][C]0[/C][C]0[/C][/ROW]
[ROW][C]M10[/C][C]392131.855555556[/C][C]47588.177149[/C][C]8.2401[/C][C]0[/C][C]0[/C][/ROW]
[ROW][C]M11[/C][C]117328.327777778[/C][C]47577.854707[/C][C]2.466[/C][C]0.017367[/C][C]0.008683[/C][/ROW]
[ROW][C]t[/C][C]2393.52777777778[/C][C]572.231258[/C][C]4.1828[/C][C]0.000125[/C][C]6.2e-05[/C][/ROW]
[/TABLE]
Source: https://freestatistics.org/blog/index.php?pk=112013&T=2

Globally Unique Identifier (entire table): ba.freestatistics.org/blog/index.php?pk=112013&T=2

As an alternative you can also use a QR Code:  

The GUIDs for individual cells are displayed in the table below:

Multiple Linear Regression - Ordinary Least Squares
VariableParameterS.D.T-STATH0: parameter = 02-tail p-value1-tail p-value
(Intercept)1046423.839446.61971426.527600
M1-55056.594444444947989.020536-1.14730.2570750.128537
M2-26964.722222222147917.321202-0.56270.576290.288145
M3197427.9547852.3578054.12580.000157.5e-05
M4378269.22222222247794.1578147.914500
M5458309.09444444447742.7459619.599600
M6476887.96666666747698.1441989.99800
M7723003.23888888947660.37164415.169900
M8612347.31111111147629.44454612.856500
M9549024.98333333347605.37624511.532800
M10392131.85555555647588.1771498.240100
M11117328.32777777847577.8547072.4660.0173670.008683
t2393.52777777778572.2312584.18280.0001256.2e-05


Multiple Linear Regression - Regression Statistics
Multiple R0.968492495041633
R-squared0.937977712951967
Adjusted R-squared0.922142235407788
F-TEST (value)59.2326761434978
F-TEST (DF numerator)12
F-TEST (DF denominator)47
p-value0
Multiple Linear Regression - Residual Statistics
Residual Standard Deviation75221.7523381548
Sum Squared Residuals265940665166.667

\begin{tabular}{lllllllll}
\hline
Multiple Linear Regression - Regression Statistics \tabularnewline
Multiple R & 0.968492495041633 \tabularnewline
R-squared & 0.937977712951967 \tabularnewline
Adjusted R-squared & 0.922142235407788 \tabularnewline
F-TEST (value) & 59.2326761434978 \tabularnewline
F-TEST (DF numerator) & 12 \tabularnewline
F-TEST (DF denominator) & 47 \tabularnewline
p-value & 0 \tabularnewline
Multiple Linear Regression - Residual Statistics \tabularnewline
Residual Standard Deviation & 75221.7523381548 \tabularnewline
Sum Squared Residuals & 265940665166.667 \tabularnewline
\hline
\end{tabular}
%Source: https://freestatistics.org/blog/index.php?pk=112013&T=3

[TABLE]
[ROW][C]Multiple Linear Regression - Regression Statistics[/C][/ROW]
[ROW][C]Multiple R[/C][C]0.968492495041633[/C][/ROW]
[ROW][C]R-squared[/C][C]0.937977712951967[/C][/ROW]
[ROW][C]Adjusted R-squared[/C][C]0.922142235407788[/C][/ROW]
[ROW][C]F-TEST (value)[/C][C]59.2326761434978[/C][/ROW]
[ROW][C]F-TEST (DF numerator)[/C][C]12[/C][/ROW]
[ROW][C]F-TEST (DF denominator)[/C][C]47[/C][/ROW]
[ROW][C]p-value[/C][C]0[/C][/ROW]
[ROW][C]Multiple Linear Regression - Residual Statistics[/C][/ROW]
[ROW][C]Residual Standard Deviation[/C][C]75221.7523381548[/C][/ROW]
[ROW][C]Sum Squared Residuals[/C][C]265940665166.667[/C][/ROW]
[/TABLE]
Source: https://freestatistics.org/blog/index.php?pk=112013&T=3

Globally Unique Identifier (entire table): ba.freestatistics.org/blog/index.php?pk=112013&T=3

As an alternative you can also use a QR Code:  

The GUIDs for individual cells are displayed in the table below:

Multiple Linear Regression - Regression Statistics
Multiple R0.968492495041633
R-squared0.937977712951967
Adjusted R-squared0.922142235407788
F-TEST (value)59.2326761434978
F-TEST (DF numerator)12
F-TEST (DF denominator)47
p-value0
Multiple Linear Regression - Residual Statistics
Residual Standard Deviation75221.7523381548
Sum Squared Residuals265940665166.667


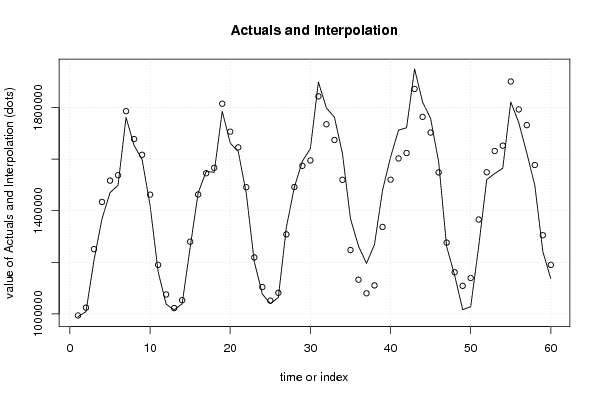
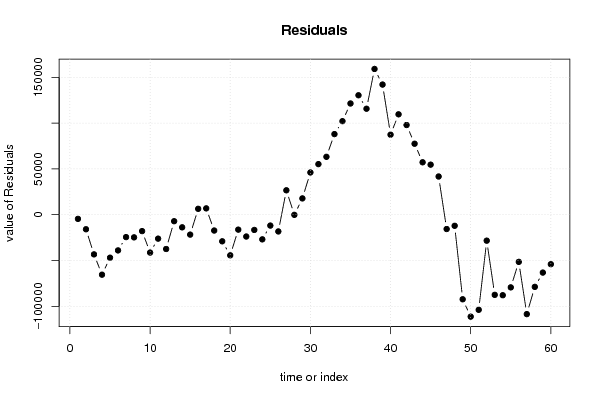
Multiple Linear Regression - Actuals, Interpolation, and Residuals
Time or IndexActualsInterpolationForecastResidualsPrediction Error
1989236993760.733333335-4524.7333333352
210083801024246.13333333-15866.1333333334
312077631251032.33333333-43269.3333333334
413688391434267.13333333-65428.1333333333
514697981516700.53333333-46902.5333333334
614987211537672.93333333-38951.9333333333
717617691786181.73333333-24412.7333333333
816532141677919.33333333-24705.3333333334
915991041616990.53333333-17886.5333333331
1014211791462490.93333333-41311.9333333332
1111639951190080.93333333-26085.9333333333
1210377351075146.13333333-37411.1333333332
1310154071022483.06666667-7076.06666666607
1410392101052968.46666667-13758.4666666666
1512580491279754.66666667-21705.6666666666
1614694451462989.466666676455.53333333338
1715523461545422.866666676923.13333333342
1815491441566395.26666667-17251.2666666666
1917858951814904.06666667-29009.0666666666
2016623351706641.66666667-44306.6666666666
2116294401645712.86666667-16272.8666666667
2214674301491213.26666667-23783.2666666666
2312022091218803.26666667-16594.2666666666
2410769821103868.46666667-26886.4666666666
2510393671051205.4-11838.3999999995
2610634491081690.8-18241.7999999999
271335135130847726658
2814916021491711.8-109.799999999995
2915919721574145.217826.8
3016412481595117.646130.4
3118988491843626.455222.6
321798580173536463216
3317624441674435.288008.8
3416220441519935.6102108.4
3513689551247525.6121429.4
3612629731132590.8130382.2
3711956501079927.73333333115722.266666667
3812695301110413.13333333159116.866666667
3914792791337199.33333333142079.666666667
4016078191520434.1333333387384.8666666667
4117124661602867.53333333109598.466666667
4217217661623839.9333333397926.0666666667
4319498431872348.7333333377494.2666666666
4418213261764086.3333333357239.6666666666
4517578021703157.5333333354644.4666666666
4615903671548657.9333333341709.0666666666
4712606471276247.93333333-15600.9333333333
4811492351161313.13333333-12078.1333333334
4910163671108650.06666667-92283.0666666663
5010278851139135.46666667-111250.466666667
5112621591365921.66666667-103762.666666667
5215208541549156.46666667-28302.4666666668
5315441441631589.86666667-87445.8666666667
5415647091652562.26666667-87853.2666666667
5518217761901071.06666667-79295.0666666667
5617413651792808.66666667-51443.6666666667
5716233861731879.86666667-108493.866666667
5814986581577380.26666667-78722.2666666668
5912418221304970.26666667-63148.2666666668
6011360291190035.46666667-54006.4666666668

\begin{tabular}{lllllllll}
\hline
Multiple Linear Regression - Actuals, Interpolation, and Residuals \tabularnewline
Time or Index & Actuals & InterpolationForecast & ResidualsPrediction Error \tabularnewline
1 & 989236 & 993760.733333335 & -4524.7333333352 \tabularnewline
2 & 1008380 & 1024246.13333333 & -15866.1333333334 \tabularnewline
3 & 1207763 & 1251032.33333333 & -43269.3333333334 \tabularnewline
4 & 1368839 & 1434267.13333333 & -65428.1333333333 \tabularnewline
5 & 1469798 & 1516700.53333333 & -46902.5333333334 \tabularnewline
6 & 1498721 & 1537672.93333333 & -38951.9333333333 \tabularnewline
7 & 1761769 & 1786181.73333333 & -24412.7333333333 \tabularnewline
8 & 1653214 & 1677919.33333333 & -24705.3333333334 \tabularnewline
9 & 1599104 & 1616990.53333333 & -17886.5333333331 \tabularnewline
10 & 1421179 & 1462490.93333333 & -41311.9333333332 \tabularnewline
11 & 1163995 & 1190080.93333333 & -26085.9333333333 \tabularnewline
12 & 1037735 & 1075146.13333333 & -37411.1333333332 \tabularnewline
13 & 1015407 & 1022483.06666667 & -7076.06666666607 \tabularnewline
14 & 1039210 & 1052968.46666667 & -13758.4666666666 \tabularnewline
15 & 1258049 & 1279754.66666667 & -21705.6666666666 \tabularnewline
16 & 1469445 & 1462989.46666667 & 6455.53333333338 \tabularnewline
17 & 1552346 & 1545422.86666667 & 6923.13333333342 \tabularnewline
18 & 1549144 & 1566395.26666667 & -17251.2666666666 \tabularnewline
19 & 1785895 & 1814904.06666667 & -29009.0666666666 \tabularnewline
20 & 1662335 & 1706641.66666667 & -44306.6666666666 \tabularnewline
21 & 1629440 & 1645712.86666667 & -16272.8666666667 \tabularnewline
22 & 1467430 & 1491213.26666667 & -23783.2666666666 \tabularnewline
23 & 1202209 & 1218803.26666667 & -16594.2666666666 \tabularnewline
24 & 1076982 & 1103868.46666667 & -26886.4666666666 \tabularnewline
25 & 1039367 & 1051205.4 & -11838.3999999995 \tabularnewline
26 & 1063449 & 1081690.8 & -18241.7999999999 \tabularnewline
27 & 1335135 & 1308477 & 26658 \tabularnewline
28 & 1491602 & 1491711.8 & -109.799999999995 \tabularnewline
29 & 1591972 & 1574145.2 & 17826.8 \tabularnewline
30 & 1641248 & 1595117.6 & 46130.4 \tabularnewline
31 & 1898849 & 1843626.4 & 55222.6 \tabularnewline
32 & 1798580 & 1735364 & 63216 \tabularnewline
33 & 1762444 & 1674435.2 & 88008.8 \tabularnewline
34 & 1622044 & 1519935.6 & 102108.4 \tabularnewline
35 & 1368955 & 1247525.6 & 121429.4 \tabularnewline
36 & 1262973 & 1132590.8 & 130382.2 \tabularnewline
37 & 1195650 & 1079927.73333333 & 115722.266666667 \tabularnewline
38 & 1269530 & 1110413.13333333 & 159116.866666667 \tabularnewline
39 & 1479279 & 1337199.33333333 & 142079.666666667 \tabularnewline
40 & 1607819 & 1520434.13333333 & 87384.8666666667 \tabularnewline
41 & 1712466 & 1602867.53333333 & 109598.466666667 \tabularnewline
42 & 1721766 & 1623839.93333333 & 97926.0666666667 \tabularnewline
43 & 1949843 & 1872348.73333333 & 77494.2666666666 \tabularnewline
44 & 1821326 & 1764086.33333333 & 57239.6666666666 \tabularnewline
45 & 1757802 & 1703157.53333333 & 54644.4666666666 \tabularnewline
46 & 1590367 & 1548657.93333333 & 41709.0666666666 \tabularnewline
47 & 1260647 & 1276247.93333333 & -15600.9333333333 \tabularnewline
48 & 1149235 & 1161313.13333333 & -12078.1333333334 \tabularnewline
49 & 1016367 & 1108650.06666667 & -92283.0666666663 \tabularnewline
50 & 1027885 & 1139135.46666667 & -111250.466666667 \tabularnewline
51 & 1262159 & 1365921.66666667 & -103762.666666667 \tabularnewline
52 & 1520854 & 1549156.46666667 & -28302.4666666668 \tabularnewline
53 & 1544144 & 1631589.86666667 & -87445.8666666667 \tabularnewline
54 & 1564709 & 1652562.26666667 & -87853.2666666667 \tabularnewline
55 & 1821776 & 1901071.06666667 & -79295.0666666667 \tabularnewline
56 & 1741365 & 1792808.66666667 & -51443.6666666667 \tabularnewline
57 & 1623386 & 1731879.86666667 & -108493.866666667 \tabularnewline
58 & 1498658 & 1577380.26666667 & -78722.2666666668 \tabularnewline
59 & 1241822 & 1304970.26666667 & -63148.2666666668 \tabularnewline
60 & 1136029 & 1190035.46666667 & -54006.4666666668 \tabularnewline
\hline
\end{tabular}
%Source: https://freestatistics.org/blog/index.php?pk=112013&T=4

[TABLE]
[ROW][C]Multiple Linear Regression - Actuals, Interpolation, and Residuals[/C][/ROW]
[ROW][C]Time or Index[/C][C]Actuals[/C][C]InterpolationForecast[/C][C]ResidualsPrediction Error[/C][/ROW]
[ROW][C]1[/C][C]989236[/C][C]993760.733333335[/C][C]-4524.7333333352[/C][/ROW]
[ROW][C]2[/C][C]1008380[/C][C]1024246.13333333[/C][C]-15866.1333333334[/C][/ROW]
[ROW][C]3[/C][C]1207763[/C][C]1251032.33333333[/C][C]-43269.3333333334[/C][/ROW]
[ROW][C]4[/C][C]1368839[/C][C]1434267.13333333[/C][C]-65428.1333333333[/C][/ROW]
[ROW][C]5[/C][C]1469798[/C][C]1516700.53333333[/C][C]-46902.5333333334[/C][/ROW]
[ROW][C]6[/C][C]1498721[/C][C]1537672.93333333[/C][C]-38951.9333333333[/C][/ROW]
[ROW][C]7[/C][C]1761769[/C][C]1786181.73333333[/C][C]-24412.7333333333[/C][/ROW]
[ROW][C]8[/C][C]1653214[/C][C]1677919.33333333[/C][C]-24705.3333333334[/C][/ROW]
[ROW][C]9[/C][C]1599104[/C][C]1616990.53333333[/C][C]-17886.5333333331[/C][/ROW]
[ROW][C]10[/C][C]1421179[/C][C]1462490.93333333[/C][C]-41311.9333333332[/C][/ROW]
[ROW][C]11[/C][C]1163995[/C][C]1190080.93333333[/C][C]-26085.9333333333[/C][/ROW]
[ROW][C]12[/C][C]1037735[/C][C]1075146.13333333[/C][C]-37411.1333333332[/C][/ROW]
[ROW][C]13[/C][C]1015407[/C][C]1022483.06666667[/C][C]-7076.06666666607[/C][/ROW]
[ROW][C]14[/C][C]1039210[/C][C]1052968.46666667[/C][C]-13758.4666666666[/C][/ROW]
[ROW][C]15[/C][C]1258049[/C][C]1279754.66666667[/C][C]-21705.6666666666[/C][/ROW]
[ROW][C]16[/C][C]1469445[/C][C]1462989.46666667[/C][C]6455.53333333338[/C][/ROW]
[ROW][C]17[/C][C]1552346[/C][C]1545422.86666667[/C][C]6923.13333333342[/C][/ROW]
[ROW][C]18[/C][C]1549144[/C][C]1566395.26666667[/C][C]-17251.2666666666[/C][/ROW]
[ROW][C]19[/C][C]1785895[/C][C]1814904.06666667[/C][C]-29009.0666666666[/C][/ROW]
[ROW][C]20[/C][C]1662335[/C][C]1706641.66666667[/C][C]-44306.6666666666[/C][/ROW]
[ROW][C]21[/C][C]1629440[/C][C]1645712.86666667[/C][C]-16272.8666666667[/C][/ROW]
[ROW][C]22[/C][C]1467430[/C][C]1491213.26666667[/C][C]-23783.2666666666[/C][/ROW]
[ROW][C]23[/C][C]1202209[/C][C]1218803.26666667[/C][C]-16594.2666666666[/C][/ROW]
[ROW][C]24[/C][C]1076982[/C][C]1103868.46666667[/C][C]-26886.4666666666[/C][/ROW]
[ROW][C]25[/C][C]1039367[/C][C]1051205.4[/C][C]-11838.3999999995[/C][/ROW]
[ROW][C]26[/C][C]1063449[/C][C]1081690.8[/C][C]-18241.7999999999[/C][/ROW]
[ROW][C]27[/C][C]1335135[/C][C]1308477[/C][C]26658[/C][/ROW]
[ROW][C]28[/C][C]1491602[/C][C]1491711.8[/C][C]-109.799999999995[/C][/ROW]
[ROW][C]29[/C][C]1591972[/C][C]1574145.2[/C][C]17826.8[/C][/ROW]
[ROW][C]30[/C][C]1641248[/C][C]1595117.6[/C][C]46130.4[/C][/ROW]
[ROW][C]31[/C][C]1898849[/C][C]1843626.4[/C][C]55222.6[/C][/ROW]
[ROW][C]32[/C][C]1798580[/C][C]1735364[/C][C]63216[/C][/ROW]
[ROW][C]33[/C][C]1762444[/C][C]1674435.2[/C][C]88008.8[/C][/ROW]
[ROW][C]34[/C][C]1622044[/C][C]1519935.6[/C][C]102108.4[/C][/ROW]
[ROW][C]35[/C][C]1368955[/C][C]1247525.6[/C][C]121429.4[/C][/ROW]
[ROW][C]36[/C][C]1262973[/C][C]1132590.8[/C][C]130382.2[/C][/ROW]
[ROW][C]37[/C][C]1195650[/C][C]1079927.73333333[/C][C]115722.266666667[/C][/ROW]
[ROW][C]38[/C][C]1269530[/C][C]1110413.13333333[/C][C]159116.866666667[/C][/ROW]
[ROW][C]39[/C][C]1479279[/C][C]1337199.33333333[/C][C]142079.666666667[/C][/ROW]
[ROW][C]40[/C][C]1607819[/C][C]1520434.13333333[/C][C]87384.8666666667[/C][/ROW]
[ROW][C]41[/C][C]1712466[/C][C]1602867.53333333[/C][C]109598.466666667[/C][/ROW]
[ROW][C]42[/C][C]1721766[/C][C]1623839.93333333[/C][C]97926.0666666667[/C][/ROW]
[ROW][C]43[/C][C]1949843[/C][C]1872348.73333333[/C][C]77494.2666666666[/C][/ROW]
[ROW][C]44[/C][C]1821326[/C][C]1764086.33333333[/C][C]57239.6666666666[/C][/ROW]
[ROW][C]45[/C][C]1757802[/C][C]1703157.53333333[/C][C]54644.4666666666[/C][/ROW]
[ROW][C]46[/C][C]1590367[/C][C]1548657.93333333[/C][C]41709.0666666666[/C][/ROW]
[ROW][C]47[/C][C]1260647[/C][C]1276247.93333333[/C][C]-15600.9333333333[/C][/ROW]
[ROW][C]48[/C][C]1149235[/C][C]1161313.13333333[/C][C]-12078.1333333334[/C][/ROW]
[ROW][C]49[/C][C]1016367[/C][C]1108650.06666667[/C][C]-92283.0666666663[/C][/ROW]
[ROW][C]50[/C][C]1027885[/C][C]1139135.46666667[/C][C]-111250.466666667[/C][/ROW]
[ROW][C]51[/C][C]1262159[/C][C]1365921.66666667[/C][C]-103762.666666667[/C][/ROW]
[ROW][C]52[/C][C]1520854[/C][C]1549156.46666667[/C][C]-28302.4666666668[/C][/ROW]
[ROW][C]53[/C][C]1544144[/C][C]1631589.86666667[/C][C]-87445.8666666667[/C][/ROW]
[ROW][C]54[/C][C]1564709[/C][C]1652562.26666667[/C][C]-87853.2666666667[/C][/ROW]
[ROW][C]55[/C][C]1821776[/C][C]1901071.06666667[/C][C]-79295.0666666667[/C][/ROW]
[ROW][C]56[/C][C]1741365[/C][C]1792808.66666667[/C][C]-51443.6666666667[/C][/ROW]
[ROW][C]57[/C][C]1623386[/C][C]1731879.86666667[/C][C]-108493.866666667[/C][/ROW]
[ROW][C]58[/C][C]1498658[/C][C]1577380.26666667[/C][C]-78722.2666666668[/C][/ROW]
[ROW][C]59[/C][C]1241822[/C][C]1304970.26666667[/C][C]-63148.2666666668[/C][/ROW]
[ROW][C]60[/C][C]1136029[/C][C]1190035.46666667[/C][C]-54006.4666666668[/C][/ROW]
[/TABLE]
Source: https://freestatistics.org/blog/index.php?pk=112013&T=4

Globally Unique Identifier (entire table): ba.freestatistics.org/blog/index.php?pk=112013&T=4

As an alternative you can also use a QR Code:  

The GUIDs for individual cells are displayed in the table below:

Multiple Linear Regression - Actuals, Interpolation, and Residuals
Time or IndexActualsInterpolationForecastResidualsPrediction Error
1989236993760.733333335-4524.7333333352
210083801024246.13333333-15866.1333333334
312077631251032.33333333-43269.3333333334
413688391434267.13333333-65428.1333333333
514697981516700.53333333-46902.5333333334
614987211537672.93333333-38951.9333333333
717617691786181.73333333-24412.7333333333
816532141677919.33333333-24705.3333333334
915991041616990.53333333-17886.5333333331
1014211791462490.93333333-41311.9333333332
1111639951190080.93333333-26085.9333333333
1210377351075146.13333333-37411.1333333332
1310154071022483.06666667-7076.06666666607
1410392101052968.46666667-13758.4666666666
1512580491279754.66666667-21705.6666666666
1614694451462989.466666676455.53333333338
1715523461545422.866666676923.13333333342
1815491441566395.26666667-17251.2666666666
1917858951814904.06666667-29009.0666666666
2016623351706641.66666667-44306.6666666666
2116294401645712.86666667-16272.8666666667
2214674301491213.26666667-23783.2666666666
2312022091218803.26666667-16594.2666666666
2410769821103868.46666667-26886.4666666666
2510393671051205.4-11838.3999999995
2610634491081690.8-18241.7999999999
271335135130847726658
2814916021491711.8-109.799999999995
2915919721574145.217826.8
3016412481595117.646130.4
3118988491843626.455222.6
321798580173536463216
3317624441674435.288008.8
3416220441519935.6102108.4
3513689551247525.6121429.4
3612629731132590.8130382.2
3711956501079927.73333333115722.266666667
3812695301110413.13333333159116.866666667
3914792791337199.33333333142079.666666667
4016078191520434.1333333387384.8666666667
4117124661602867.53333333109598.466666667
4217217661623839.9333333397926.0666666667
4319498431872348.7333333377494.2666666666
4418213261764086.3333333357239.6666666666
4517578021703157.5333333354644.4666666666
4615903671548657.9333333341709.0666666666
4712606471276247.93333333-15600.9333333333
4811492351161313.13333333-12078.1333333334
4910163671108650.06666667-92283.0666666663
5010278851139135.46666667-111250.466666667
5112621591365921.66666667-103762.666666667
5215208541549156.46666667-28302.4666666668
5315441441631589.86666667-87445.8666666667
5415647091652562.26666667-87853.2666666667
5518217761901071.06666667-79295.0666666667
5617413651792808.66666667-51443.6666666667
5716233861731879.86666667-108493.866666667
5814986581577380.26666667-78722.2666666668
5912418221304970.26666667-63148.2666666668
6011360291190035.46666667-54006.4666666668


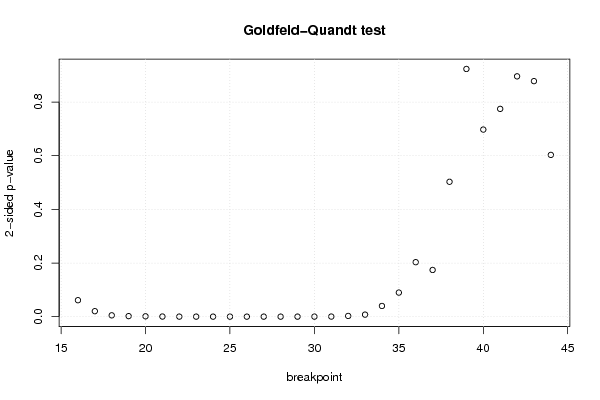
Goldfeld-Quandt test for Heteroskedasticity
p-valuesAlternative Hypothesis
breakpoint indexgreater2-sidedless
160.03069456723527560.06138913447055120.969305432764724
170.01021269589720820.02042539179441650.989787304102792
180.002492801086335910.004985602172671820.997507198913664
190.001002045981528350.00200409196305670.998997954018472
200.0006559263070422610.001311852614084520.999344073692958
210.0002050238957201140.0004100477914402270.99979497610428
226.40178952850278e-050.0001280357905700560.999935982104715
232.12106220977289e-054.24212441954578e-050.999978789377902
249.91500346851211e-061.98300069370242e-050.999990084996532
256.5457480787722e-061.30914961575444e-050.999993454251921
264.70389379977967e-069.40778759955933e-060.9999952961062
278.76409790421142e-061.75281958084228e-050.999991235902096
288.76767665632982e-061.75353533126596e-050.999991232323344
299.39211096578133e-061.87842219315627e-050.999990607889034
303.9817474157732e-057.9634948315464e-050.999960182525842
310.0001665183473649950.0003330366947299910.999833481652635
320.001286673687351340.002573347374702690.998713326312649
330.003797007130295990.007594014260591980.996202992869704
340.01992027424397810.03984054848795620.980079725756022
350.04484165593283920.08968331186567840.95515834406716
360.1015501937734490.2031003875468980.898449806226551
370.08705864315407110.1741172863081420.912941356845929
380.2513920685907920.5027841371815830.748607931409208
390.4617477701296520.9234955402593040.538252229870348
400.3487465555107810.6974931110215610.65125344448922
410.3873122815426390.7746245630852790.61268771845736
420.4479781102116870.8959562204233750.552021889788313
430.4390648359495060.8781296718990110.560935164050494
440.3015526934737660.6031053869475320.698447306526234

\begin{tabular}{lllllllll}
\hline
Goldfeld-Quandt test for Heteroskedasticity \tabularnewline
p-values & Alternative Hypothesis \tabularnewline
breakpoint index & greater & 2-sided & less \tabularnewline
16 & 0.0306945672352756 & 0.0613891344705512 & 0.969305432764724 \tabularnewline
17 & 0.0102126958972082 & 0.0204253917944165 & 0.989787304102792 \tabularnewline
18 & 0.00249280108633591 & 0.00498560217267182 & 0.997507198913664 \tabularnewline
19 & 0.00100204598152835 & 0.0020040919630567 & 0.998997954018472 \tabularnewline
20 & 0.000655926307042261 & 0.00131185261408452 & 0.999344073692958 \tabularnewline
21 & 0.000205023895720114 & 0.000410047791440227 & 0.99979497610428 \tabularnewline
22 & 6.40178952850278e-05 & 0.000128035790570056 & 0.999935982104715 \tabularnewline
23 & 2.12106220977289e-05 & 4.24212441954578e-05 & 0.999978789377902 \tabularnewline
24 & 9.91500346851211e-06 & 1.98300069370242e-05 & 0.999990084996532 \tabularnewline
25 & 6.5457480787722e-06 & 1.30914961575444e-05 & 0.999993454251921 \tabularnewline
26 & 4.70389379977967e-06 & 9.40778759955933e-06 & 0.9999952961062 \tabularnewline
27 & 8.76409790421142e-06 & 1.75281958084228e-05 & 0.999991235902096 \tabularnewline
28 & 8.76767665632982e-06 & 1.75353533126596e-05 & 0.999991232323344 \tabularnewline
29 & 9.39211096578133e-06 & 1.87842219315627e-05 & 0.999990607889034 \tabularnewline
30 & 3.9817474157732e-05 & 7.9634948315464e-05 & 0.999960182525842 \tabularnewline
31 & 0.000166518347364995 & 0.000333036694729991 & 0.999833481652635 \tabularnewline
32 & 0.00128667368735134 & 0.00257334737470269 & 0.998713326312649 \tabularnewline
33 & 0.00379700713029599 & 0.00759401426059198 & 0.996202992869704 \tabularnewline
34 & 0.0199202742439781 & 0.0398405484879562 & 0.980079725756022 \tabularnewline
35 & 0.0448416559328392 & 0.0896833118656784 & 0.95515834406716 \tabularnewline
36 & 0.101550193773449 & 0.203100387546898 & 0.898449806226551 \tabularnewline
37 & 0.0870586431540711 & 0.174117286308142 & 0.912941356845929 \tabularnewline
38 & 0.251392068590792 & 0.502784137181583 & 0.748607931409208 \tabularnewline
39 & 0.461747770129652 & 0.923495540259304 & 0.538252229870348 \tabularnewline
40 & 0.348746555510781 & 0.697493111021561 & 0.65125344448922 \tabularnewline
41 & 0.387312281542639 & 0.774624563085279 & 0.61268771845736 \tabularnewline
42 & 0.447978110211687 & 0.895956220423375 & 0.552021889788313 \tabularnewline
43 & 0.439064835949506 & 0.878129671899011 & 0.560935164050494 \tabularnewline
44 & 0.301552693473766 & 0.603105386947532 & 0.698447306526234 \tabularnewline
\hline
\end{tabular}
%Source: https://freestatistics.org/blog/index.php?pk=112013&T=5

[TABLE]
[ROW][C]Goldfeld-Quandt test for Heteroskedasticity[/C][/ROW]
[ROW][C]p-values[/C][C]Alternative Hypothesis[/C][/ROW]
[ROW][C]breakpoint index[/C][C]greater[/C][C]2-sided[/C][C]less[/C][/ROW]
[ROW][C]16[/C][C]0.0306945672352756[/C][C]0.0613891344705512[/C][C]0.969305432764724[/C][/ROW]
[ROW][C]17[/C][C]0.0102126958972082[/C][C]0.0204253917944165[/C][C]0.989787304102792[/C][/ROW]
[ROW][C]18[/C][C]0.00249280108633591[/C][C]0.00498560217267182[/C][C]0.997507198913664[/C][/ROW]
[ROW][C]19[/C][C]0.00100204598152835[/C][C]0.0020040919630567[/C][C]0.998997954018472[/C][/ROW]
[ROW][C]20[/C][C]0.000655926307042261[/C][C]0.00131185261408452[/C][C]0.999344073692958[/C][/ROW]
[ROW][C]21[/C][C]0.000205023895720114[/C][C]0.000410047791440227[/C][C]0.99979497610428[/C][/ROW]
[ROW][C]22[/C][C]6.40178952850278e-05[/C][C]0.000128035790570056[/C][C]0.999935982104715[/C][/ROW]
[ROW][C]23[/C][C]2.12106220977289e-05[/C][C]4.24212441954578e-05[/C][C]0.999978789377902[/C][/ROW]
[ROW][C]24[/C][C]9.91500346851211e-06[/C][C]1.98300069370242e-05[/C][C]0.999990084996532[/C][/ROW]
[ROW][C]25[/C][C]6.5457480787722e-06[/C][C]1.30914961575444e-05[/C][C]0.999993454251921[/C][/ROW]
[ROW][C]26[/C][C]4.70389379977967e-06[/C][C]9.40778759955933e-06[/C][C]0.9999952961062[/C][/ROW]
[ROW][C]27[/C][C]8.76409790421142e-06[/C][C]1.75281958084228e-05[/C][C]0.999991235902096[/C][/ROW]
[ROW][C]28[/C][C]8.76767665632982e-06[/C][C]1.75353533126596e-05[/C][C]0.999991232323344[/C][/ROW]
[ROW][C]29[/C][C]9.39211096578133e-06[/C][C]1.87842219315627e-05[/C][C]0.999990607889034[/C][/ROW]
[ROW][C]30[/C][C]3.9817474157732e-05[/C][C]7.9634948315464e-05[/C][C]0.999960182525842[/C][/ROW]
[ROW][C]31[/C][C]0.000166518347364995[/C][C]0.000333036694729991[/C][C]0.999833481652635[/C][/ROW]
[ROW][C]32[/C][C]0.00128667368735134[/C][C]0.00257334737470269[/C][C]0.998713326312649[/C][/ROW]
[ROW][C]33[/C][C]0.00379700713029599[/C][C]0.00759401426059198[/C][C]0.996202992869704[/C][/ROW]
[ROW][C]34[/C][C]0.0199202742439781[/C][C]0.0398405484879562[/C][C]0.980079725756022[/C][/ROW]
[ROW][C]35[/C][C]0.0448416559328392[/C][C]0.0896833118656784[/C][C]0.95515834406716[/C][/ROW]
[ROW][C]36[/C][C]0.101550193773449[/C][C]0.203100387546898[/C][C]0.898449806226551[/C][/ROW]
[ROW][C]37[/C][C]0.0870586431540711[/C][C]0.174117286308142[/C][C]0.912941356845929[/C][/ROW]
[ROW][C]38[/C][C]0.251392068590792[/C][C]0.502784137181583[/C][C]0.748607931409208[/C][/ROW]
[ROW][C]39[/C][C]0.461747770129652[/C][C]0.923495540259304[/C][C]0.538252229870348[/C][/ROW]
[ROW][C]40[/C][C]0.348746555510781[/C][C]0.697493111021561[/C][C]0.65125344448922[/C][/ROW]
[ROW][C]41[/C][C]0.387312281542639[/C][C]0.774624563085279[/C][C]0.61268771845736[/C][/ROW]
[ROW][C]42[/C][C]0.447978110211687[/C][C]0.895956220423375[/C][C]0.552021889788313[/C][/ROW]
[ROW][C]43[/C][C]0.439064835949506[/C][C]0.878129671899011[/C][C]0.560935164050494[/C][/ROW]
[ROW][C]44[/C][C]0.301552693473766[/C][C]0.603105386947532[/C][C]0.698447306526234[/C][/ROW]
[/TABLE]
Source: https://freestatistics.org/blog/index.php?pk=112013&T=5

Globally Unique Identifier (entire table): ba.freestatistics.org/blog/index.php?pk=112013&T=5

As an alternative you can also use a QR Code:  

The GUIDs for individual cells are displayed in the table below:

Goldfeld-Quandt test for Heteroskedasticity
p-valuesAlternative Hypothesis
breakpoint indexgreater2-sidedless
160.03069456723527560.06138913447055120.969305432764724
170.01021269589720820.02042539179441650.989787304102792
180.002492801086335910.004985602172671820.997507198913664
190.001002045981528350.00200409196305670.998997954018472
200.0006559263070422610.001311852614084520.999344073692958
210.0002050238957201140.0004100477914402270.99979497610428
226.40178952850278e-050.0001280357905700560.999935982104715
232.12106220977289e-054.24212441954578e-050.999978789377902
249.91500346851211e-061.98300069370242e-050.999990084996532
256.5457480787722e-061.30914961575444e-050.999993454251921
264.70389379977967e-069.40778759955933e-060.9999952961062
278.76409790421142e-061.75281958084228e-050.999991235902096
288.76767665632982e-061.75353533126596e-050.999991232323344
299.39211096578133e-061.87842219315627e-050.999990607889034
303.9817474157732e-057.9634948315464e-050.999960182525842
310.0001665183473649950.0003330366947299910.999833481652635
320.001286673687351340.002573347374702690.998713326312649
330.003797007130295990.007594014260591980.996202992869704
340.01992027424397810.03984054848795620.980079725756022
350.04484165593283920.08968331186567840.95515834406716
360.1015501937734490.2031003875468980.898449806226551
370.08705864315407110.1741172863081420.912941356845929
380.2513920685907920.5027841371815830.748607931409208
390.4617477701296520.9234955402593040.538252229870348
400.3487465555107810.6974931110215610.65125344448922
410.3873122815426390.7746245630852790.61268771845736
420.4479781102116870.8959562204233750.552021889788313
430.4390648359495060.8781296718990110.560935164050494
440.3015526934737660.6031053869475320.698447306526234


Meta Analysis of Goldfeld-Quandt test for Heteroskedasticity
Description# significant tests% significant testsOK/NOK
1% type I error level160.551724137931034NOK
5% type I error level180.620689655172414NOK
10% type I error level200.689655172413793NOK

\begin{tabular}{lllllllll}
\hline
Meta Analysis of Goldfeld-Quandt test for Heteroskedasticity \tabularnewline
Description & # significant tests & % significant tests & OK/NOK \tabularnewline
1% type I error level & 16 & 0.551724137931034 & NOK \tabularnewline
5% type I error level & 18 & 0.620689655172414 & NOK \tabularnewline
10% type I error level & 20 & 0.689655172413793 & NOK \tabularnewline
\hline
\end{tabular}
%Source: https://freestatistics.org/blog/index.php?pk=112013&T=6

[TABLE]
[ROW][C]Meta Analysis of Goldfeld-Quandt test for Heteroskedasticity[/C][/ROW]
[ROW][C]Description[/C][C]# significant tests[/C][C]% significant tests[/C][C]OK/NOK[/C][/ROW]
[ROW][C]1% type I error level[/C][C]16[/C][C]0.551724137931034[/C][C]NOK[/C][/ROW]
[ROW][C]5% type I error level[/C][C]18[/C][C]0.620689655172414[/C][C]NOK[/C][/ROW]
[ROW][C]10% type I error level[/C][C]20[/C][C]0.689655172413793[/C][C]NOK[/C][/ROW]
[/TABLE]
Source: https://freestatistics.org/blog/index.php?pk=112013&T=6

Globally Unique Identifier (entire table): ba.freestatistics.org/blog/index.php?pk=112013&T=6

As an alternative you can also use a QR Code:  

The GUIDs for individual cells are displayed in the table below:

Meta Analysis of Goldfeld-Quandt test for Heteroskedasticity
Description# significant tests% significant testsOK/NOK
1% type I error level160.551724137931034NOK
5% type I error level180.620689655172414NOK
10% type I error level200.689655172413793NOK


Parameters (Session):
par1 = 1 ; par2 = Include Monthly Dummies ; par3 = Linear Trend ;
Parameters (R input):
par1 = 1 ; par2 = Include Monthly Dummies ; par3 = Linear Trend ;
R code (references can be found in the software module):
library(lattice)
library(lmtest)
n25 <- 25 #minimum number of obs. for Goldfeld-Quandt test
par1 <- as.numeric(par1)
x <- t(y)
k <- length(x[1,])
n <- length(x[,1])
x1 <- cbind(x[,par1], x[,1:k!=par1])
mycolnames <- c(colnames(x)[par1], colnames(x)[1:k!=par1])
colnames(x1) <- mycolnames #colnames(x)[par1]
x <- x1
if (par3 == 'First Differences'){
x2 <- array(0, dim=c(n-1,k), dimnames=list(1:(n-1), paste('(1-B)',colnames(x),sep='')))
for (i in 1:n-1) {
for (j in 1:k) {
x2[i,j] <- x[i+1,j] - x[i,j]
}
}
x <- x2
}
if (par2 == 'Include Monthly Dummies'){
x2 <- array(0, dim=c(n,11), dimnames=list(1:n, paste('M', seq(1:11), sep ='')))
for (i in 1:11){
x2[seq(i,n,12),i] <- 1
}
x <- cbind(x, x2)
}
if (par2 == 'Include Quarterly Dummies'){
x2 <- array(0, dim=c(n,3), dimnames=list(1:n, paste('Q', seq(1:3), sep ='')))
for (i in 1:3){
x2[seq(i,n,4),i] <- 1
}
x <- cbind(x, x2)
}
k <- length(x[1,])
if (par3 == 'Linear Trend'){
x <- cbind(x, c(1:n))
colnames(x)[k+1] <- 't'
}
x
k <- length(x[1,])
df <- as.data.frame(x)
(mylm <- lm(df))
(mysum <- summary(mylm))
if (n > n25) {
kp3 <- k + 3
nmkm3 <- n - k - 3
gqarr <- array(NA, dim=c(nmkm3-kp3+1,3))
numgqtests <- 0
numsignificant1 <- 0
numsignificant5 <- 0
numsignificant10 <- 0
for (mypoint in kp3:nmkm3) {
j <- 0
numgqtests <- numgqtests + 1
for (myalt in c('greater', 'two.sided', 'less')) {
j <- j + 1
gqarr[mypoint-kp3+1,j] <- gqtest(mylm, point=mypoint, alternative=myalt)$p.value
}
if (gqarr[mypoint-kp3+1,2] < 0.01) numsignificant1 <- numsignificant1 + 1
if (gqarr[mypoint-kp3+1,2] < 0.05) numsignificant5 <- numsignificant5 + 1
if (gqarr[mypoint-kp3+1,2] < 0.10) numsignificant10 <- numsignificant10 + 1
}
gqarr
}
bitmap(file='test0.png')
plot(x[,1], type='l', main='Actuals and Interpolation', ylab='value of Actuals and Interpolation (dots)', xlab='time or index')
points(x[,1]-mysum$resid)
grid()
dev.off()
bitmap(file='test1.png')
plot(mysum$resid, type='b', pch=19, main='Residuals', ylab='value of Residuals', xlab='time or index')
grid()
dev.off()
bitmap(file='test2.png')
hist(mysum$resid, main='Residual Histogram', xlab='values of Residuals')
grid()
dev.off()
bitmap(file='test3.png')
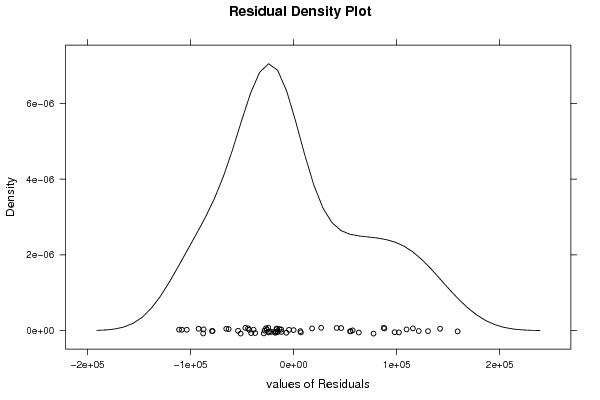
densityplot(~mysum$resid,col='black',main='Residual Density Plot', xlab='values of Residuals')
dev.off()
bitmap(file='test4.png')
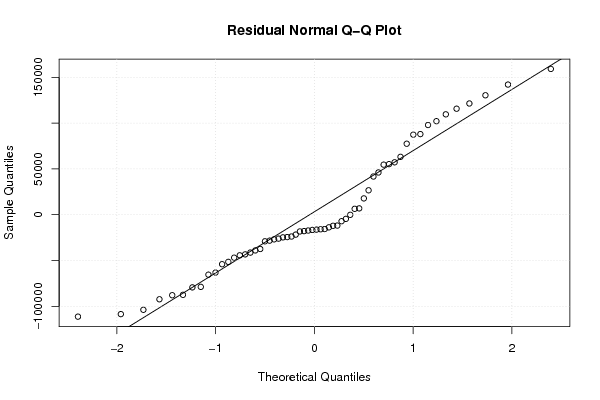
qqnorm(mysum$resid, main='Residual Normal Q-Q Plot')
qqline(mysum$resid)
grid()
dev.off()
(myerror <- as.ts(mysum$resid))
bitmap(file='test5.png')
dum <- cbind(lag(myerror,k=1),myerror)
dum
dum1 <- dum[2:length(myerror),]
dum1
z <- as.data.frame(dum1)
z
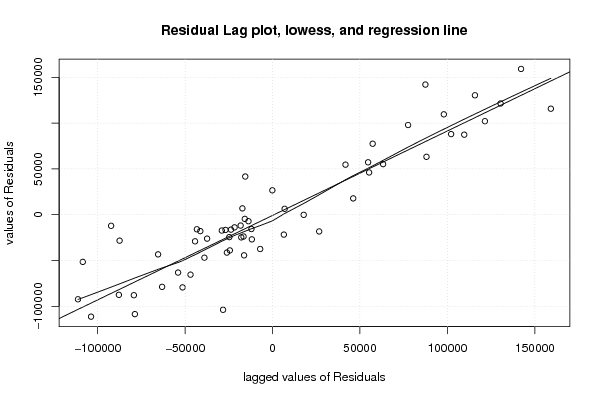
plot(z,main=paste('Residual Lag plot, lowess, and regression line'), ylab='values of Residuals', xlab='lagged values of Residuals')
lines(lowess(z))
abline(lm(z))
grid()
dev.off()
bitmap(file='test6.png')
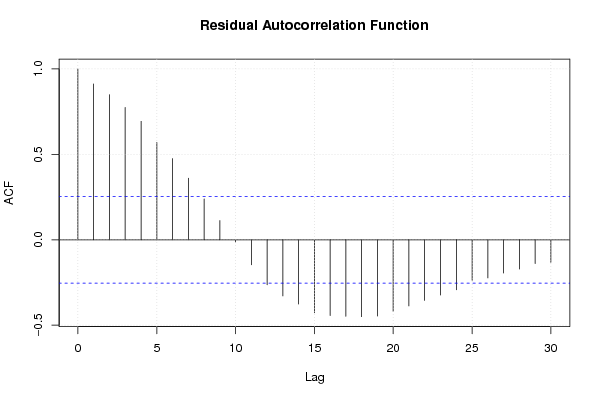
acf(mysum$resid, lag.max=length(mysum$resid)/2, main='Residual Autocorrelation Function')
grid()
dev.off()
bitmap(file='test7.png')
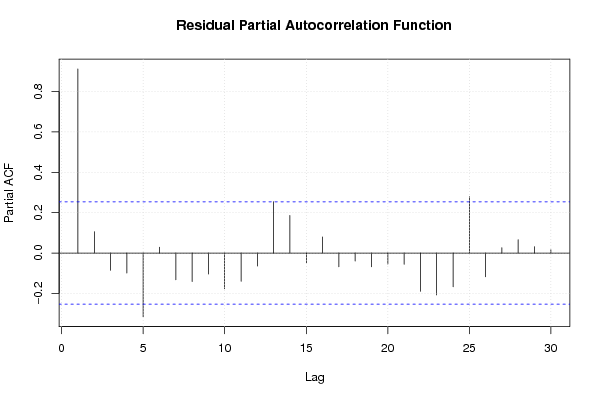
pacf(mysum$resid, lag.max=length(mysum$resid)/2, main='Residual Partial Autocorrelation Function')
grid()
dev.off()
bitmap(file='test8.png')
opar <- par(mfrow = c(2,2), oma = c(0, 0, 1.1, 0))
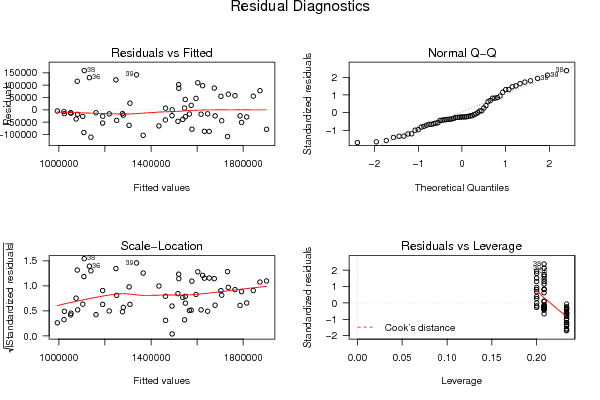
plot(mylm, las = 1, sub='Residual Diagnostics')
par(opar)
dev.off()
if (n > n25) {
bitmap(file='test9.png')
plot(kp3:nmkm3,gqarr[,2], main='Goldfeld-Quandt test',ylab='2-sided p-value',xlab='breakpoint')
grid()
dev.off()
}
load(file='createtable')
a<-table.start()
a<-table.row.start(a)
a<-table.element(a, 'Multiple Linear Regression - Estimated Regression Equation', 1, TRUE)
a<-table.row.end(a)
myeq <- colnames(x)[1]
myeq <- paste(myeq, '[t] = ', sep='')
for (i in 1:k){
if (mysum$coefficients[i,1] > 0) myeq <- paste(myeq, '+', '')
myeq <- paste(myeq, mysum$coefficients[i,1], sep=' ')
if (rownames(mysum$coefficients)[i] != '(Intercept)') {
myeq <- paste(myeq, rownames(mysum$coefficients)[i], sep='')
if (rownames(mysum$coefficients)[i] != 't') myeq <- paste(myeq, '[t]', sep='')
}
}
myeq <- paste(myeq, ' + e[t]')
a<-table.row.start(a)
a<-table.element(a, myeq)
a<-table.row.end(a)
a<-table.end(a)
table.save(a,file='mytable1.tab')
a<-table.start()
a<-table.row.start(a)
a<-table.element(a,hyperlink('ols1.htm','Multiple Linear Regression - Ordinary Least Squares',''), 6, TRUE)
a<-table.row.end(a)
a<-table.row.start(a)
a<-table.element(a,'Variable',header=TRUE)
a<-table.element(a,'Parameter',header=TRUE)
a<-table.element(a,'S.D.',header=TRUE)
a<-table.element(a,'T-STAT
H0: parameter = 0',header=TRUE)
a<-table.element(a,'2-tail p-value',header=TRUE)
a<-table.element(a,'1-tail p-value',header=TRUE)
a<-table.row.end(a)
for (i in 1:k){
a<-table.row.start(a)
a<-table.element(a,rownames(mysum$coefficients)[i],header=TRUE)
a<-table.element(a,mysum$coefficients[i,1])
a<-table.element(a, round(mysum$coefficients[i,2],6))
a<-table.element(a, round(mysum$coefficients[i,3],4))
a<-table.element(a, round(mysum$coefficients[i,4],6))
a<-table.element(a, round(mysum$coefficients[i,4]/2,6))
a<-table.row.end(a)
}
a<-table.end(a)
table.save(a,file='mytable2.tab')
a<-table.start()
a<-table.row.start(a)
a<-table.element(a, 'Multiple Linear Regression - Regression Statistics', 2, TRUE)
a<-table.row.end(a)
a<-table.row.start(a)
a<-table.element(a, 'Multiple R',1,TRUE)
a<-table.element(a, sqrt(mysum$r.squared))
a<-table.row.end(a)
a<-table.row.start(a)
a<-table.element(a, 'R-squared',1,TRUE)
a<-table.element(a, mysum$r.squared)
a<-table.row.end(a)
a<-table.row.start(a)
a<-table.element(a, 'Adjusted R-squared',1,TRUE)
a<-table.element(a, mysum$adj.r.squared)
a<-table.row.end(a)
a<-table.row.start(a)
a<-table.element(a, 'F-TEST (value)',1,TRUE)
a<-table.element(a, mysum$fstatistic[1])
a<-table.row.end(a)
a<-table.row.start(a)
a<-table.element(a, 'F-TEST (DF numerator)',1,TRUE)
a<-table.element(a, mysum$fstatistic[2])
a<-table.row.end(a)
a<-table.row.start(a)
a<-table.element(a, 'F-TEST (DF denominator)',1,TRUE)
a<-table.element(a, mysum$fstatistic[3])
a<-table.row.end(a)
a<-table.row.start(a)
a<-table.element(a, 'p-value',1,TRUE)
a<-table.element(a, 1-pf(mysum$fstatistic[1],mysum$fstatistic[2],mysum$fstatistic[3]))
a<-table.row.end(a)
a<-table.row.start(a)
a<-table.element(a, 'Multiple Linear Regression - Residual Statistics', 2, TRUE)
a<-table.row.end(a)
a<-table.row.start(a)
a<-table.element(a, 'Residual Standard Deviation',1,TRUE)
a<-table.element(a, mysum$sigma)
a<-table.row.end(a)
a<-table.row.start(a)
a<-table.element(a, 'Sum Squared Residuals',1,TRUE)
a<-table.element(a, sum(myerror*myerror))
a<-table.row.end(a)
a<-table.end(a)
table.save(a,file='mytable3.tab')
a<-table.start()
a<-table.row.start(a)
a<-table.element(a, 'Multiple Linear Regression - Actuals, Interpolation, and Residuals', 4, TRUE)
a<-table.row.end(a)
a<-table.row.start(a)
a<-table.element(a, 'Time or Index', 1, TRUE)
a<-table.element(a, 'Actuals', 1, TRUE)
a<-table.element(a, 'Interpolation
Forecast', 1, TRUE)
a<-table.element(a, 'Residuals
Prediction Error', 1, TRUE)
a<-table.row.end(a)
for (i in 1:n) {
a<-table.row.start(a)
a<-table.element(a,i, 1, TRUE)
a<-table.element(a,x[i])
a<-table.element(a,x[i]-mysum$resid[i])
a<-table.element(a,mysum$resid[i])
a<-table.row.end(a)
}
a<-table.end(a)
table.save(a,file='mytable4.tab')
if (n > n25) {
a<-table.start()
a<-table.row.start(a)
a<-table.element(a,'Goldfeld-Quandt test for Heteroskedasticity',4,TRUE)
a<-table.row.end(a)
a<-table.row.start(a)
a<-table.element(a,'p-values',header=TRUE)
a<-table.element(a,'Alternative Hypothesis',3,header=TRUE)
a<-table.row.end(a)
a<-table.row.start(a)
a<-table.element(a,'breakpoint index',header=TRUE)
a<-table.element(a,'greater',header=TRUE)
a<-table.element(a,'2-sided',header=TRUE)
a<-table.element(a,'less',header=TRUE)
a<-table.row.end(a)
for (mypoint in kp3:nmkm3) {
a<-table.row.start(a)
a<-table.element(a,mypoint,header=TRUE)
a<-table.element(a,gqarr[mypoint-kp3+1,1])
a<-table.element(a,gqarr[mypoint-kp3+1,2])
a<-table.element(a,gqarr[mypoint-kp3+1,3])
a<-table.row.end(a)
}
a<-table.end(a)
table.save(a,file='mytable5.tab')
a<-table.start()
a<-table.row.start(a)
a<-table.element(a,'Meta Analysis of Goldfeld-Quandt test for Heteroskedasticity',4,TRUE)
a<-table.row.end(a)
a<-table.row.start(a)
a<-table.element(a,'Description',header=TRUE)
a<-table.element(a,'# significant tests',header=TRUE)
a<-table.element(a,'% significant tests',header=TRUE)
a<-table.element(a,'OK/NOK',header=TRUE)
a<-table.row.end(a)
a<-table.row.start(a)
a<-table.element(a,'1% type I error level',header=TRUE)
a<-table.element(a,numsignificant1)
a<-table.element(a,numsignificant1/numgqtests)
if (numsignificant1/numgqtests < 0.01) dum <- 'OK' else dum <- 'NOK'
a<-table.element(a,dum)
a<-table.row.end(a)
a<-table.row.start(a)
a<-table.element(a,'5% type I error level',header=TRUE)
a<-table.element(a,numsignificant5)
a<-table.element(a,numsignificant5/numgqtests)
if (numsignificant5/numgqtests < 0.05) dum <- 'OK' else dum <- 'NOK'
a<-table.element(a,dum)
a<-table.row.end(a)
a<-table.row.start(a)
a<-table.element(a,'10% type I error level',header=TRUE)
a<-table.element(a,numsignificant10)
a<-table.element(a,numsignificant10/numgqtests)
if (numsignificant10/numgqtests < 0.1) dum <- 'OK' else dum <- 'NOK'
a<-table.element(a,dum)
a<-table.row.end(a)
a<-table.end(a)
table.save(a,file='mytable6.tab')
}