Free Statistics

of Irreproducible Research!

Author's title

Author*Unverified author*
R Software Modulerwasp_autocorrelation.wasp
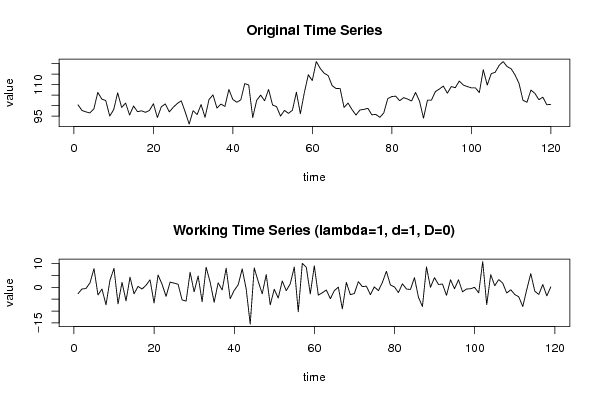
Title produced by software(Partial) Autocorrelation Function
Date of computationSat, 18 Dec 2010 13:56:19 +0000
Cite this page as followsStatistical Computations at FreeStatistics.org, Office for Research Development and Education, URL https://freestatistics.org/blog/index.php?v=date/2010/Dec/18/t1292680788c1c0mwc7bq1zsx3.htm/, Retrieved Tue, 30 Apr 2024 01:07:53 +0000
Statistical Computations at FreeStatistics.org, Office for Research Development and Education, URL https://freestatistics.org/blog/index.php?pk=111971, Retrieved Tue, 30 Apr 2024 01:07:53 +0000
QR Codes:

Original text written by user:
IsPrivate?No (this computation is public)
User-defined keywords
Estimated Impact148
Family? (F = Feedback message, R = changed R code, M = changed R Module, P = changed Parameters, D = changed Data)
-     [(Partial) Autocorrelation Function] [Opgave 6bis Time ...] [2010-11-17 10:46:59] [4c9a292db13b4ee392c67e5938709d2c]
- R PD    [(Partial) Autocorrelation Function] [opgave 6bis.2 sta...] [2010-12-18 13:56:19] [c6c4f641f0c0971fe864266cb6b6a9b0] [Current]
Feedback Forum

Post a new message
Dataseries X:
100.4
97.7
97
96.5
98.4
106.3
103.1
102.4
95
98.1
106.1
99.1
101.2
95.5
99.8
97.1
97.5
96.8
97.7
100.9
94.3
99.5
100.8
97
99.2
101
102.3
97
91.2
97.6
95.7
100.5
94.4
102.9
105.1
98.8
100.7
99.6
107.7
102.9
101.6
102.7
110.5
109.8
94.3
102.5
105
102.3
107.7
100.3
99.5
95
97.7
96.3
97.8
106.4
96.1
106.2
114.7
111.9
121
117.7
115.4
114.3
109.5
108.1
108.2
99.1
101.2
98.1
95.5
97.9
98.2
98.7
95.6
95.8
94.4
96.5
103.3
104.3
104.5
102.3
103.8
103.1
102.2
106.3
102.1
94
102.6
102.6
106.7
107.9
109.3
105.9
109.1
108.5
111.7
109.8
109.1
108.5
108.5
106.2
117.1
109.8
115.2
115.9
119.2
121
118.6
117.6
114.6
110.6
102.5
101.6
107.4
105.8
102.8
104
100.4
100.6


Summary of computational transaction
Raw Inputview raw input (R code)
Raw Outputview raw output of R engine
Computing time2 seconds
R Server'George Udny Yule' @ 72.249.76.132

\begin{tabular}{lllllllll}
\hline
Summary of computational transaction \tabularnewline
Raw Input & view raw input (R code)  \tabularnewline
Raw Output & view raw output of R engine  \tabularnewline
Computing time & 2 seconds \tabularnewline
R Server & 'George Udny Yule' @ 72.249.76.132 \tabularnewline
\hline
\end{tabular}
%Source: https://freestatistics.org/blog/index.php?pk=111971&T=0

[TABLE]
[ROW][C]Summary of computational transaction[/C][/ROW]
[ROW][C]Raw Input[/C][C]view raw input (R code) [/C][/ROW]
[ROW][C]Raw Output[/C][C]view raw output of R engine [/C][/ROW]
[ROW][C]Computing time[/C][C]2 seconds[/C][/ROW]
[ROW][C]R Server[/C][C]'George Udny Yule' @ 72.249.76.132[/C][/ROW]
[/TABLE]
Source: https://freestatistics.org/blog/index.php?pk=111971&T=0

Globally Unique Identifier (entire table): ba.freestatistics.org/blog/index.php?pk=111971&T=0

As an alternative you can also use a QR Code:  

The GUIDs for individual cells are displayed in the table below:

Summary of computational transaction
Raw Inputview raw input (R code)
Raw Outputview raw output of R engine
Computing time2 seconds
R Server'George Udny Yule' @ 72.249.76.132


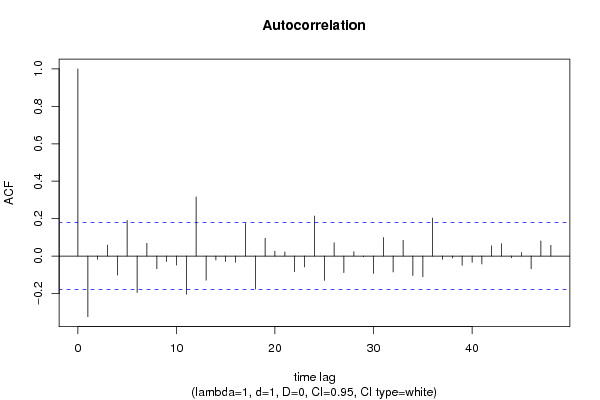
Autocorrelation Function
Time lag kACF(k)T-STATP-value
1-0.323623-3.53030.000296
2-0.017327-0.1890.4252
30.0590990.64470.260183
4-0.101128-1.10320.136089
50.1908332.08170.019755
6-0.194064-2.1170.018172
70.0683420.74550.228714
8-0.06741-0.73540.231785
9-0.029379-0.32050.374581
10-0.04783-0.52180.301404
11-0.203783-2.2230.014052
120.3162343.44970.000389
13-0.129062-1.40790.080883
14-0.020321-0.22170.412471
15-0.028697-0.3130.377398
16-0.03238-0.35320.362274
170.1745551.90420.029651
18-0.175605-1.91560.028906
190.0954391.04110.149967
200.0264130.28810.386873
210.0220460.24050.405181
22-0.083091-0.90640.183272
23-0.058244-0.63540.263204
240.214032.33480.010615
25-0.129801-1.4160.079699
260.0711890.77660.219475
27-0.088109-0.96120.169212
280.0234810.25620.399138
29-0.003029-0.0330.486849
30-0.092379-1.00770.157813
310.099871.08950.139077
32-0.084367-0.92030.179629
330.0842870.91950.179857
34-0.103807-1.13240.129872
35-0.110796-1.20860.114598
360.2031432.2160.014296
37-0.017337-0.18910.425158
38-0.010513-0.11470.454445
39-0.049151-0.53620.296418
40-0.033146-0.36160.359155
41-0.041896-0.4570.324239
420.0552440.60260.273948
430.0661240.72130.236061
44-0.009425-0.10280.459142
450.0193350.21090.416656
46-0.068318-0.74530.22879
470.0808140.88160.189891
480.0578280.63080.264682

\begin{tabular}{lllllllll}
\hline
Autocorrelation Function \tabularnewline
Time lag k & ACF(k) & T-STAT & P-value \tabularnewline
1 & -0.323623 & -3.5303 & 0.000296 \tabularnewline
2 & -0.017327 & -0.189 & 0.4252 \tabularnewline
3 & 0.059099 & 0.6447 & 0.260183 \tabularnewline
4 & -0.101128 & -1.1032 & 0.136089 \tabularnewline
5 & 0.190833 & 2.0817 & 0.019755 \tabularnewline
6 & -0.194064 & -2.117 & 0.018172 \tabularnewline
7 & 0.068342 & 0.7455 & 0.228714 \tabularnewline
8 & -0.06741 & -0.7354 & 0.231785 \tabularnewline
9 & -0.029379 & -0.3205 & 0.374581 \tabularnewline
10 & -0.04783 & -0.5218 & 0.301404 \tabularnewline
11 & -0.203783 & -2.223 & 0.014052 \tabularnewline
12 & 0.316234 & 3.4497 & 0.000389 \tabularnewline
13 & -0.129062 & -1.4079 & 0.080883 \tabularnewline
14 & -0.020321 & -0.2217 & 0.412471 \tabularnewline
15 & -0.028697 & -0.313 & 0.377398 \tabularnewline
16 & -0.03238 & -0.3532 & 0.362274 \tabularnewline
17 & 0.174555 & 1.9042 & 0.029651 \tabularnewline
18 & -0.175605 & -1.9156 & 0.028906 \tabularnewline
19 & 0.095439 & 1.0411 & 0.149967 \tabularnewline
20 & 0.026413 & 0.2881 & 0.386873 \tabularnewline
21 & 0.022046 & 0.2405 & 0.405181 \tabularnewline
22 & -0.083091 & -0.9064 & 0.183272 \tabularnewline
23 & -0.058244 & -0.6354 & 0.263204 \tabularnewline
24 & 0.21403 & 2.3348 & 0.010615 \tabularnewline
25 & -0.129801 & -1.416 & 0.079699 \tabularnewline
26 & 0.071189 & 0.7766 & 0.219475 \tabularnewline
27 & -0.088109 & -0.9612 & 0.169212 \tabularnewline
28 & 0.023481 & 0.2562 & 0.399138 \tabularnewline
29 & -0.003029 & -0.033 & 0.486849 \tabularnewline
30 & -0.092379 & -1.0077 & 0.157813 \tabularnewline
31 & 0.09987 & 1.0895 & 0.139077 \tabularnewline
32 & -0.084367 & -0.9203 & 0.179629 \tabularnewline
33 & 0.084287 & 0.9195 & 0.179857 \tabularnewline
34 & -0.103807 & -1.1324 & 0.129872 \tabularnewline
35 & -0.110796 & -1.2086 & 0.114598 \tabularnewline
36 & 0.203143 & 2.216 & 0.014296 \tabularnewline
37 & -0.017337 & -0.1891 & 0.425158 \tabularnewline
38 & -0.010513 & -0.1147 & 0.454445 \tabularnewline
39 & -0.049151 & -0.5362 & 0.296418 \tabularnewline
40 & -0.033146 & -0.3616 & 0.359155 \tabularnewline
41 & -0.041896 & -0.457 & 0.324239 \tabularnewline
42 & 0.055244 & 0.6026 & 0.273948 \tabularnewline
43 & 0.066124 & 0.7213 & 0.236061 \tabularnewline
44 & -0.009425 & -0.1028 & 0.459142 \tabularnewline
45 & 0.019335 & 0.2109 & 0.416656 \tabularnewline
46 & -0.068318 & -0.7453 & 0.22879 \tabularnewline
47 & 0.080814 & 0.8816 & 0.189891 \tabularnewline
48 & 0.057828 & 0.6308 & 0.264682 \tabularnewline
\hline
\end{tabular}
%Source: https://freestatistics.org/blog/index.php?pk=111971&T=1

[TABLE]
[ROW][C]Autocorrelation Function[/C][/ROW]
[ROW][C]Time lag k[/C][C]ACF(k)[/C][C]T-STAT[/C][C]P-value[/C][/ROW]
[ROW][C]1[/C][C]-0.323623[/C][C]-3.5303[/C][C]0.000296[/C][/ROW]
[ROW][C]2[/C][C]-0.017327[/C][C]-0.189[/C][C]0.4252[/C][/ROW]
[ROW][C]3[/C][C]0.059099[/C][C]0.6447[/C][C]0.260183[/C][/ROW]
[ROW][C]4[/C][C]-0.101128[/C][C]-1.1032[/C][C]0.136089[/C][/ROW]
[ROW][C]5[/C][C]0.190833[/C][C]2.0817[/C][C]0.019755[/C][/ROW]
[ROW][C]6[/C][C]-0.194064[/C][C]-2.117[/C][C]0.018172[/C][/ROW]
[ROW][C]7[/C][C]0.068342[/C][C]0.7455[/C][C]0.228714[/C][/ROW]
[ROW][C]8[/C][C]-0.06741[/C][C]-0.7354[/C][C]0.231785[/C][/ROW]
[ROW][C]9[/C][C]-0.029379[/C][C]-0.3205[/C][C]0.374581[/C][/ROW]
[ROW][C]10[/C][C]-0.04783[/C][C]-0.5218[/C][C]0.301404[/C][/ROW]
[ROW][C]11[/C][C]-0.203783[/C][C]-2.223[/C][C]0.014052[/C][/ROW]
[ROW][C]12[/C][C]0.316234[/C][C]3.4497[/C][C]0.000389[/C][/ROW]
[ROW][C]13[/C][C]-0.129062[/C][C]-1.4079[/C][C]0.080883[/C][/ROW]
[ROW][C]14[/C][C]-0.020321[/C][C]-0.2217[/C][C]0.412471[/C][/ROW]
[ROW][C]15[/C][C]-0.028697[/C][C]-0.313[/C][C]0.377398[/C][/ROW]
[ROW][C]16[/C][C]-0.03238[/C][C]-0.3532[/C][C]0.362274[/C][/ROW]
[ROW][C]17[/C][C]0.174555[/C][C]1.9042[/C][C]0.029651[/C][/ROW]
[ROW][C]18[/C][C]-0.175605[/C][C]-1.9156[/C][C]0.028906[/C][/ROW]
[ROW][C]19[/C][C]0.095439[/C][C]1.0411[/C][C]0.149967[/C][/ROW]
[ROW][C]20[/C][C]0.026413[/C][C]0.2881[/C][C]0.386873[/C][/ROW]
[ROW][C]21[/C][C]0.022046[/C][C]0.2405[/C][C]0.405181[/C][/ROW]
[ROW][C]22[/C][C]-0.083091[/C][C]-0.9064[/C][C]0.183272[/C][/ROW]
[ROW][C]23[/C][C]-0.058244[/C][C]-0.6354[/C][C]0.263204[/C][/ROW]
[ROW][C]24[/C][C]0.21403[/C][C]2.3348[/C][C]0.010615[/C][/ROW]
[ROW][C]25[/C][C]-0.129801[/C][C]-1.416[/C][C]0.079699[/C][/ROW]
[ROW][C]26[/C][C]0.071189[/C][C]0.7766[/C][C]0.219475[/C][/ROW]
[ROW][C]27[/C][C]-0.088109[/C][C]-0.9612[/C][C]0.169212[/C][/ROW]
[ROW][C]28[/C][C]0.023481[/C][C]0.2562[/C][C]0.399138[/C][/ROW]
[ROW][C]29[/C][C]-0.003029[/C][C]-0.033[/C][C]0.486849[/C][/ROW]
[ROW][C]30[/C][C]-0.092379[/C][C]-1.0077[/C][C]0.157813[/C][/ROW]
[ROW][C]31[/C][C]0.09987[/C][C]1.0895[/C][C]0.139077[/C][/ROW]
[ROW][C]32[/C][C]-0.084367[/C][C]-0.9203[/C][C]0.179629[/C][/ROW]
[ROW][C]33[/C][C]0.084287[/C][C]0.9195[/C][C]0.179857[/C][/ROW]
[ROW][C]34[/C][C]-0.103807[/C][C]-1.1324[/C][C]0.129872[/C][/ROW]
[ROW][C]35[/C][C]-0.110796[/C][C]-1.2086[/C][C]0.114598[/C][/ROW]
[ROW][C]36[/C][C]0.203143[/C][C]2.216[/C][C]0.014296[/C][/ROW]
[ROW][C]37[/C][C]-0.017337[/C][C]-0.1891[/C][C]0.425158[/C][/ROW]
[ROW][C]38[/C][C]-0.010513[/C][C]-0.1147[/C][C]0.454445[/C][/ROW]
[ROW][C]39[/C][C]-0.049151[/C][C]-0.5362[/C][C]0.296418[/C][/ROW]
[ROW][C]40[/C][C]-0.033146[/C][C]-0.3616[/C][C]0.359155[/C][/ROW]
[ROW][C]41[/C][C]-0.041896[/C][C]-0.457[/C][C]0.324239[/C][/ROW]
[ROW][C]42[/C][C]0.055244[/C][C]0.6026[/C][C]0.273948[/C][/ROW]
[ROW][C]43[/C][C]0.066124[/C][C]0.7213[/C][C]0.236061[/C][/ROW]
[ROW][C]44[/C][C]-0.009425[/C][C]-0.1028[/C][C]0.459142[/C][/ROW]
[ROW][C]45[/C][C]0.019335[/C][C]0.2109[/C][C]0.416656[/C][/ROW]
[ROW][C]46[/C][C]-0.068318[/C][C]-0.7453[/C][C]0.22879[/C][/ROW]
[ROW][C]47[/C][C]0.080814[/C][C]0.8816[/C][C]0.189891[/C][/ROW]
[ROW][C]48[/C][C]0.057828[/C][C]0.6308[/C][C]0.264682[/C][/ROW]
[/TABLE]
Source: https://freestatistics.org/blog/index.php?pk=111971&T=1

Globally Unique Identifier (entire table): ba.freestatistics.org/blog/index.php?pk=111971&T=1

As an alternative you can also use a QR Code:  

The GUIDs for individual cells are displayed in the table below:

Autocorrelation Function
Time lag kACF(k)T-STATP-value
1-0.323623-3.53030.000296
2-0.017327-0.1890.4252
30.0590990.64470.260183
4-0.101128-1.10320.136089
50.1908332.08170.019755
6-0.194064-2.1170.018172
70.0683420.74550.228714
8-0.06741-0.73540.231785
9-0.029379-0.32050.374581
10-0.04783-0.52180.301404
11-0.203783-2.2230.014052
120.3162343.44970.000389
13-0.129062-1.40790.080883
14-0.020321-0.22170.412471
15-0.028697-0.3130.377398
16-0.03238-0.35320.362274
170.1745551.90420.029651
18-0.175605-1.91560.028906
190.0954391.04110.149967
200.0264130.28810.386873
210.0220460.24050.405181
22-0.083091-0.90640.183272
23-0.058244-0.63540.263204
240.214032.33480.010615
25-0.129801-1.4160.079699
260.0711890.77660.219475
27-0.088109-0.96120.169212
280.0234810.25620.399138
29-0.003029-0.0330.486849
30-0.092379-1.00770.157813
310.099871.08950.139077
32-0.084367-0.92030.179629
330.0842870.91950.179857
34-0.103807-1.13240.129872
35-0.110796-1.20860.114598
360.2031432.2160.014296
37-0.017337-0.18910.425158
38-0.010513-0.11470.454445
39-0.049151-0.53620.296418
40-0.033146-0.36160.359155
41-0.041896-0.4570.324239
420.0552440.60260.273948
430.0661240.72130.236061
44-0.009425-0.10280.459142
450.0193350.21090.416656
46-0.068318-0.74530.22879
470.0808140.88160.189891
480.0578280.63080.264682


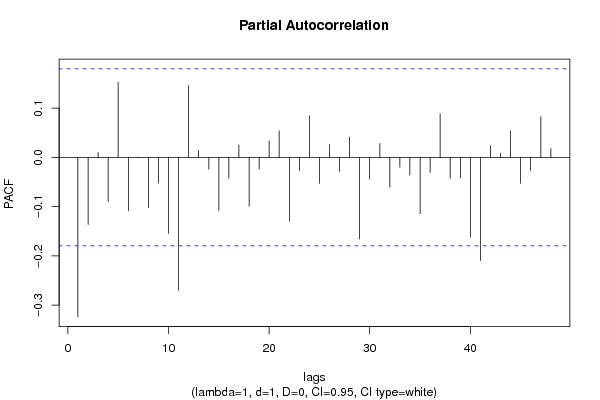
Partial Autocorrelation Function
Time lag kPACF(k)T-STATP-value
1-0.323623-3.53030.000296
2-0.136338-1.48730.069794
30.0097930.10680.45755
4-0.08947-0.9760.16552
50.1526781.66550.04922
6-0.10844-1.18290.119595
70.0006830.00750.497033
8-0.101997-1.11270.134049
9-0.052478-0.57250.284043
10-0.154601-1.68650.04716
11-0.270151-2.9470.001931
120.1458121.59060.057174
130.0141830.15470.438652
14-0.023999-0.26180.396965
15-0.107777-1.17570.12103
16-0.042546-0.46410.321705
170.0252850.27580.39158
18-0.099364-1.08390.140293
19-0.023408-0.25540.399446
200.0332440.36270.358754
210.0542930.59230.277396
22-0.129782-1.41580.079729
23-0.027136-0.2960.383864
240.0845050.92180.179237
25-0.052774-0.57570.282955
260.0260420.28410.38842
27-0.028219-0.30780.379375
280.0411790.44920.32705
29-0.165713-1.80770.036589
30-0.044121-0.48130.315592
310.0281680.30730.379586
32-0.060275-0.65750.256058
33-0.019945-0.21760.414067
34-0.035924-0.39190.347922
35-0.114404-1.2480.10724
36-0.030484-0.33250.370032
370.088540.96590.168037
38-0.042514-0.46380.321827
39-0.041417-0.45180.326116
40-0.161912-1.76620.039959
41-0.209708-2.28760.011962
420.0237350.25890.398073
430.0085270.0930.463022
440.0543120.59250.27733
45-0.052748-0.57540.283048
46-0.026933-0.29380.384709
470.082580.90080.184747
480.0182790.19940.421145

\begin{tabular}{lllllllll}
\hline
Partial Autocorrelation Function \tabularnewline
Time lag k & PACF(k) & T-STAT & P-value \tabularnewline
1 & -0.323623 & -3.5303 & 0.000296 \tabularnewline
2 & -0.136338 & -1.4873 & 0.069794 \tabularnewline
3 & 0.009793 & 0.1068 & 0.45755 \tabularnewline
4 & -0.08947 & -0.976 & 0.16552 \tabularnewline
5 & 0.152678 & 1.6655 & 0.04922 \tabularnewline
6 & -0.10844 & -1.1829 & 0.119595 \tabularnewline
7 & 0.000683 & 0.0075 & 0.497033 \tabularnewline
8 & -0.101997 & -1.1127 & 0.134049 \tabularnewline
9 & -0.052478 & -0.5725 & 0.284043 \tabularnewline
10 & -0.154601 & -1.6865 & 0.04716 \tabularnewline
11 & -0.270151 & -2.947 & 0.001931 \tabularnewline
12 & 0.145812 & 1.5906 & 0.057174 \tabularnewline
13 & 0.014183 & 0.1547 & 0.438652 \tabularnewline
14 & -0.023999 & -0.2618 & 0.396965 \tabularnewline
15 & -0.107777 & -1.1757 & 0.12103 \tabularnewline
16 & -0.042546 & -0.4641 & 0.321705 \tabularnewline
17 & 0.025285 & 0.2758 & 0.39158 \tabularnewline
18 & -0.099364 & -1.0839 & 0.140293 \tabularnewline
19 & -0.023408 & -0.2554 & 0.399446 \tabularnewline
20 & 0.033244 & 0.3627 & 0.358754 \tabularnewline
21 & 0.054293 & 0.5923 & 0.277396 \tabularnewline
22 & -0.129782 & -1.4158 & 0.079729 \tabularnewline
23 & -0.027136 & -0.296 & 0.383864 \tabularnewline
24 & 0.084505 & 0.9218 & 0.179237 \tabularnewline
25 & -0.052774 & -0.5757 & 0.282955 \tabularnewline
26 & 0.026042 & 0.2841 & 0.38842 \tabularnewline
27 & -0.028219 & -0.3078 & 0.379375 \tabularnewline
28 & 0.041179 & 0.4492 & 0.32705 \tabularnewline
29 & -0.165713 & -1.8077 & 0.036589 \tabularnewline
30 & -0.044121 & -0.4813 & 0.315592 \tabularnewline
31 & 0.028168 & 0.3073 & 0.379586 \tabularnewline
32 & -0.060275 & -0.6575 & 0.256058 \tabularnewline
33 & -0.019945 & -0.2176 & 0.414067 \tabularnewline
34 & -0.035924 & -0.3919 & 0.347922 \tabularnewline
35 & -0.114404 & -1.248 & 0.10724 \tabularnewline
36 & -0.030484 & -0.3325 & 0.370032 \tabularnewline
37 & 0.08854 & 0.9659 & 0.168037 \tabularnewline
38 & -0.042514 & -0.4638 & 0.321827 \tabularnewline
39 & -0.041417 & -0.4518 & 0.326116 \tabularnewline
40 & -0.161912 & -1.7662 & 0.039959 \tabularnewline
41 & -0.209708 & -2.2876 & 0.011962 \tabularnewline
42 & 0.023735 & 0.2589 & 0.398073 \tabularnewline
43 & 0.008527 & 0.093 & 0.463022 \tabularnewline
44 & 0.054312 & 0.5925 & 0.27733 \tabularnewline
45 & -0.052748 & -0.5754 & 0.283048 \tabularnewline
46 & -0.026933 & -0.2938 & 0.384709 \tabularnewline
47 & 0.08258 & 0.9008 & 0.184747 \tabularnewline
48 & 0.018279 & 0.1994 & 0.421145 \tabularnewline
\hline
\end{tabular}
%Source: https://freestatistics.org/blog/index.php?pk=111971&T=2

[TABLE]
[ROW][C]Partial Autocorrelation Function[/C][/ROW]
[ROW][C]Time lag k[/C][C]PACF(k)[/C][C]T-STAT[/C][C]P-value[/C][/ROW]
[ROW][C]1[/C][C]-0.323623[/C][C]-3.5303[/C][C]0.000296[/C][/ROW]
[ROW][C]2[/C][C]-0.136338[/C][C]-1.4873[/C][C]0.069794[/C][/ROW]
[ROW][C]3[/C][C]0.009793[/C][C]0.1068[/C][C]0.45755[/C][/ROW]
[ROW][C]4[/C][C]-0.08947[/C][C]-0.976[/C][C]0.16552[/C][/ROW]
[ROW][C]5[/C][C]0.152678[/C][C]1.6655[/C][C]0.04922[/C][/ROW]
[ROW][C]6[/C][C]-0.10844[/C][C]-1.1829[/C][C]0.119595[/C][/ROW]
[ROW][C]7[/C][C]0.000683[/C][C]0.0075[/C][C]0.497033[/C][/ROW]
[ROW][C]8[/C][C]-0.101997[/C][C]-1.1127[/C][C]0.134049[/C][/ROW]
[ROW][C]9[/C][C]-0.052478[/C][C]-0.5725[/C][C]0.284043[/C][/ROW]
[ROW][C]10[/C][C]-0.154601[/C][C]-1.6865[/C][C]0.04716[/C][/ROW]
[ROW][C]11[/C][C]-0.270151[/C][C]-2.947[/C][C]0.001931[/C][/ROW]
[ROW][C]12[/C][C]0.145812[/C][C]1.5906[/C][C]0.057174[/C][/ROW]
[ROW][C]13[/C][C]0.014183[/C][C]0.1547[/C][C]0.438652[/C][/ROW]
[ROW][C]14[/C][C]-0.023999[/C][C]-0.2618[/C][C]0.396965[/C][/ROW]
[ROW][C]15[/C][C]-0.107777[/C][C]-1.1757[/C][C]0.12103[/C][/ROW]
[ROW][C]16[/C][C]-0.042546[/C][C]-0.4641[/C][C]0.321705[/C][/ROW]
[ROW][C]17[/C][C]0.025285[/C][C]0.2758[/C][C]0.39158[/C][/ROW]
[ROW][C]18[/C][C]-0.099364[/C][C]-1.0839[/C][C]0.140293[/C][/ROW]
[ROW][C]19[/C][C]-0.023408[/C][C]-0.2554[/C][C]0.399446[/C][/ROW]
[ROW][C]20[/C][C]0.033244[/C][C]0.3627[/C][C]0.358754[/C][/ROW]
[ROW][C]21[/C][C]0.054293[/C][C]0.5923[/C][C]0.277396[/C][/ROW]
[ROW][C]22[/C][C]-0.129782[/C][C]-1.4158[/C][C]0.079729[/C][/ROW]
[ROW][C]23[/C][C]-0.027136[/C][C]-0.296[/C][C]0.383864[/C][/ROW]
[ROW][C]24[/C][C]0.084505[/C][C]0.9218[/C][C]0.179237[/C][/ROW]
[ROW][C]25[/C][C]-0.052774[/C][C]-0.5757[/C][C]0.282955[/C][/ROW]
[ROW][C]26[/C][C]0.026042[/C][C]0.2841[/C][C]0.38842[/C][/ROW]
[ROW][C]27[/C][C]-0.028219[/C][C]-0.3078[/C][C]0.379375[/C][/ROW]
[ROW][C]28[/C][C]0.041179[/C][C]0.4492[/C][C]0.32705[/C][/ROW]
[ROW][C]29[/C][C]-0.165713[/C][C]-1.8077[/C][C]0.036589[/C][/ROW]
[ROW][C]30[/C][C]-0.044121[/C][C]-0.4813[/C][C]0.315592[/C][/ROW]
[ROW][C]31[/C][C]0.028168[/C][C]0.3073[/C][C]0.379586[/C][/ROW]
[ROW][C]32[/C][C]-0.060275[/C][C]-0.6575[/C][C]0.256058[/C][/ROW]
[ROW][C]33[/C][C]-0.019945[/C][C]-0.2176[/C][C]0.414067[/C][/ROW]
[ROW][C]34[/C][C]-0.035924[/C][C]-0.3919[/C][C]0.347922[/C][/ROW]
[ROW][C]35[/C][C]-0.114404[/C][C]-1.248[/C][C]0.10724[/C][/ROW]
[ROW][C]36[/C][C]-0.030484[/C][C]-0.3325[/C][C]0.370032[/C][/ROW]
[ROW][C]37[/C][C]0.08854[/C][C]0.9659[/C][C]0.168037[/C][/ROW]
[ROW][C]38[/C][C]-0.042514[/C][C]-0.4638[/C][C]0.321827[/C][/ROW]
[ROW][C]39[/C][C]-0.041417[/C][C]-0.4518[/C][C]0.326116[/C][/ROW]
[ROW][C]40[/C][C]-0.161912[/C][C]-1.7662[/C][C]0.039959[/C][/ROW]
[ROW][C]41[/C][C]-0.209708[/C][C]-2.2876[/C][C]0.011962[/C][/ROW]
[ROW][C]42[/C][C]0.023735[/C][C]0.2589[/C][C]0.398073[/C][/ROW]
[ROW][C]43[/C][C]0.008527[/C][C]0.093[/C][C]0.463022[/C][/ROW]
[ROW][C]44[/C][C]0.054312[/C][C]0.5925[/C][C]0.27733[/C][/ROW]
[ROW][C]45[/C][C]-0.052748[/C][C]-0.5754[/C][C]0.283048[/C][/ROW]
[ROW][C]46[/C][C]-0.026933[/C][C]-0.2938[/C][C]0.384709[/C][/ROW]
[ROW][C]47[/C][C]0.08258[/C][C]0.9008[/C][C]0.184747[/C][/ROW]
[ROW][C]48[/C][C]0.018279[/C][C]0.1994[/C][C]0.421145[/C][/ROW]
[/TABLE]
Source: https://freestatistics.org/blog/index.php?pk=111971&T=2

Globally Unique Identifier (entire table): ba.freestatistics.org/blog/index.php?pk=111971&T=2

As an alternative you can also use a QR Code:  

The GUIDs for individual cells are displayed in the table below:

Partial Autocorrelation Function
Time lag kPACF(k)T-STATP-value
1-0.323623-3.53030.000296
2-0.136338-1.48730.069794
30.0097930.10680.45755
4-0.08947-0.9760.16552
50.1526781.66550.04922
6-0.10844-1.18290.119595
70.0006830.00750.497033
8-0.101997-1.11270.134049
9-0.052478-0.57250.284043
10-0.154601-1.68650.04716
11-0.270151-2.9470.001931
120.1458121.59060.057174
130.0141830.15470.438652
14-0.023999-0.26180.396965
15-0.107777-1.17570.12103
16-0.042546-0.46410.321705
170.0252850.27580.39158
18-0.099364-1.08390.140293
19-0.023408-0.25540.399446
200.0332440.36270.358754
210.0542930.59230.277396
22-0.129782-1.41580.079729
23-0.027136-0.2960.383864
240.0845050.92180.179237
25-0.052774-0.57570.282955
260.0260420.28410.38842
27-0.028219-0.30780.379375
280.0411790.44920.32705
29-0.165713-1.80770.036589
30-0.044121-0.48130.315592
310.0281680.30730.379586
32-0.060275-0.65750.256058
33-0.019945-0.21760.414067
34-0.035924-0.39190.347922
35-0.114404-1.2480.10724
36-0.030484-0.33250.370032
370.088540.96590.168037
38-0.042514-0.46380.321827
39-0.041417-0.45180.326116
40-0.161912-1.76620.039959
41-0.209708-2.28760.011962
420.0237350.25890.398073
430.0085270.0930.463022
440.0543120.59250.27733
45-0.052748-0.57540.283048
46-0.026933-0.29380.384709
470.082580.90080.184747
480.0182790.19940.421145


Parameters (Session):
par1 = 48 ; par2 = 1 ; par3 = 1 ; par4 = 0 ; par5 = 12 ; par6 = White Noise ; par7 = 0.95 ;
Parameters (R input):
par1 = 48 ; par2 = 1 ; par3 = 1 ; par4 = 0 ; par5 = 12 ; par6 = White Noise ; par7 = 0.95 ; par8 = ;
R code (references can be found in the software module):
if (par1 == 'Default') {
par1 = 10*log10(length(x))
} else {
par1 <- as.numeric(par1)
}
par2 <- as.numeric(par2)
par3 <- as.numeric(par3)
par4 <- as.numeric(par4)
par5 <- as.numeric(par5)
if (par6 == 'White Noise') par6 <- 'white' else par6 <- 'ma'
par7 <- as.numeric(par7)
if (par8 != '') par8 <- as.numeric(par8)
ox <- x
if (par8 == '') {
if (par2 == 0) {
x <- log(x)
} else {
x <- (x ^ par2 - 1) / par2
}
} else {
x <- log(x,base=par8)
}
if (par3 > 0) x <- diff(x,lag=1,difference=par3)
if (par4 > 0) x <- diff(x,lag=par5,difference=par4)
bitmap(file='picts.png')
op <- par(mfrow=c(2,1))
plot(ox,type='l',main='Original Time Series',xlab='time',ylab='value')
if (par8=='') {
mytitle <- paste('Working Time Series (lambda=',par2,', d=',par3,', D=',par4,')',sep='')
mysub <- paste('(lambda=',par2,', d=',par3,', D=',par4,', CI=', par7, ', CI type=',par6,')',sep='')
} else {
mytitle <- paste('Working Time Series (base=',par8,', d=',par3,', D=',par4,')',sep='')
mysub <- paste('(base=',par8,', d=',par3,', D=',par4,', CI=', par7, ', CI type=',par6,')',sep='')
}
plot(x,type='l', main=mytitle,xlab='time',ylab='value')
par(op)
dev.off()
bitmap(file='pic1.png')
racf <- acf(x, par1, main='Autocorrelation', xlab='time lag', ylab='ACF', ci.type=par6, ci=par7, sub=mysub)
dev.off()
bitmap(file='pic2.png')
rpacf <- pacf(x,par1,main='Partial Autocorrelation',xlab='lags',ylab='PACF',sub=mysub)
dev.off()
(myacf <- c(racf$acf))
(mypacf <- c(rpacf$acf))
lengthx <- length(x)
sqrtn <- sqrt(lengthx)
load(file='createtable')
a<-table.start()
a<-table.row.start(a)
a<-table.element(a,'Autocorrelation Function',4,TRUE)
a<-table.row.end(a)
a<-table.row.start(a)
a<-table.element(a,'Time lag k',header=TRUE)
a<-table.element(a,hyperlink('basics.htm','ACF(k)','click here for more information about the Autocorrelation Function'),header=TRUE)
a<-table.element(a,'T-STAT',header=TRUE)
a<-table.element(a,'P-value',header=TRUE)
a<-table.row.end(a)
for (i in 2:(par1+1)) {
a<-table.row.start(a)
a<-table.element(a,i-1,header=TRUE)
a<-table.element(a,round(myacf[i],6))
mytstat <- myacf[i]*sqrtn
a<-table.element(a,round(mytstat,4))
a<-table.element(a,round(1-pt(abs(mytstat),lengthx),6))
a<-table.row.end(a)
}
a<-table.end(a)
table.save(a,file='mytable.tab')
a<-table.start()
a<-table.row.start(a)
a<-table.element(a,'Partial Autocorrelation Function',4,TRUE)
a<-table.row.end(a)
a<-table.row.start(a)
a<-table.element(a,'Time lag k',header=TRUE)
a<-table.element(a,hyperlink('basics.htm','PACF(k)','click here for more information about the Partial Autocorrelation Function'),header=TRUE)
a<-table.element(a,'T-STAT',header=TRUE)
a<-table.element(a,'P-value',header=TRUE)
a<-table.row.end(a)
for (i in 1:par1) {
a<-table.row.start(a)
a<-table.element(a,i,header=TRUE)
a<-table.element(a,round(mypacf[i],6))
mytstat <- mypacf[i]*sqrtn
a<-table.element(a,round(mytstat,4))
a<-table.element(a,round(1-pt(abs(mytstat),lengthx),6))
a<-table.row.end(a)
}
a<-table.end(a)
table.save(a,file='mytable1.tab')