Free Statistics

of Irreproducible Research!

Author's title

Author*The author of this computation has been verified*
R Software Modulerwasp_autocorrelation.wasp
Title produced by software(Partial) Autocorrelation Function
Date of computationSat, 18 Dec 2010 13:57:00 +0000
Cite this page as followsStatistical Computations at FreeStatistics.org, Office for Research Development and Education, URL https://freestatistics.org/blog/index.php?v=date/2010/Dec/18/t1292680515szgsrpjews5b8n8.htm/, Retrieved Tue, 30 Apr 2024 04:01:18 +0000
Statistical Computations at FreeStatistics.org, Office for Research Development and Education, URL https://freestatistics.org/blog/index.php?pk=111968, Retrieved Tue, 30 Apr 2024 04:01:18 +0000
QR Codes:

Original text written by user:
IsPrivate?No (this computation is public)
User-defined keywords
Estimated Impact156
Family? (F = Feedback message, R = changed R code, M = changed R Module, P = changed Parameters, D = changed Data)
-     [(Partial) Autocorrelation Function] [(partial) autocor...] [2009-12-09 13:20:29] [f7fc9270f813d017f9fa5b506fdc7682]
-   P   [(Partial) Autocorrelation Function] [autocorrelation] [2009-12-09 13:36:40] [f7fc9270f813d017f9fa5b506fdc7682]
-   PD      [(Partial) Autocorrelation Function] [autocorrelation o...] [2010-12-18 13:57:00] [8f110cf3e3846d42560df9b5835185a6] [Current]
-   P         [(Partial) Autocorrelation Function] [differentiatie va...] [2010-12-21 11:31:01] [a8a0ff0853b70f438be515083758c362]
Feedback Forum

Post a new message
Dataseries X:
31806
34571
37121
40438
43635
48064
50846
53668
58465
58618
55826
60412
62714
63332
66050
62948
59535
57298
56599
57686
57472
60463
60784
63154
64042
65460
65268
65774
66028
67104
68102
69897
72185
73538
72325
74820
74813
74533
76916
80371
81261
81557
81446
81995
79948


Summary of computational transaction
Raw Inputview raw input (R code)
Raw Outputview raw output of R engine
Computing time2 seconds
R Server'George Udny Yule' @ 72.249.76.132

\begin{tabular}{lllllllll}
\hline
Summary of computational transaction \tabularnewline
Raw Input & view raw input (R code)  \tabularnewline
Raw Output & view raw output of R engine  \tabularnewline
Computing time & 2 seconds \tabularnewline
R Server & 'George Udny Yule' @ 72.249.76.132 \tabularnewline
\hline
\end{tabular}
%Source: https://freestatistics.org/blog/index.php?pk=111968&T=0

[TABLE]
[ROW][C]Summary of computational transaction[/C][/ROW]
[ROW][C]Raw Input[/C][C]view raw input (R code) [/C][/ROW]
[ROW][C]Raw Output[/C][C]view raw output of R engine [/C][/ROW]
[ROW][C]Computing time[/C][C]2 seconds[/C][/ROW]
[ROW][C]R Server[/C][C]'George Udny Yule' @ 72.249.76.132[/C][/ROW]
[/TABLE]
Source: https://freestatistics.org/blog/index.php?pk=111968&T=0

Globally Unique Identifier (entire table): ba.freestatistics.org/blog/index.php?pk=111968&T=0

As an alternative you can also use a QR Code:  

The GUIDs for individual cells are displayed in the table below:

Summary of computational transaction
Raw Inputview raw input (R code)
Raw Outputview raw output of R engine
Computing time2 seconds
R Server'George Udny Yule' @ 72.249.76.132


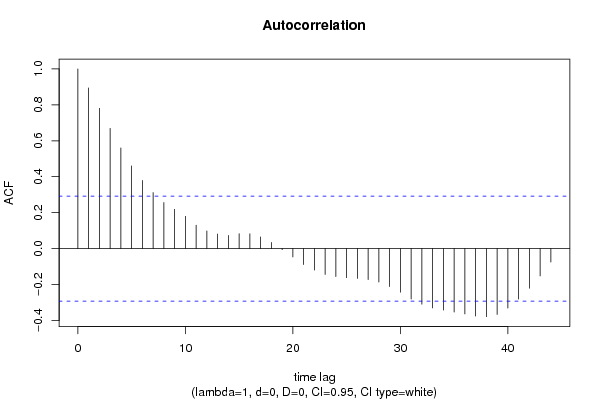
Autocorrelation Function
Time lag kACF(k)T-STATP-value
10.894235.99870
20.7809125.23852e-06
30.6692714.48962.5e-05
40.5601183.75740.000246
50.4603353.0880.001723
60.3794812.54560.007202
70.3121592.0940.020961
80.2566361.72160.046008
90.2185931.46640.074751
100.1799581.20720.116832
110.1303720.87460.193229
120.0985020.66080.256064
130.0810320.54360.294707
140.0735070.49310.31217
150.0832470.55840.289658
160.0821830.55130.292078
170.0651970.43740.331974
180.0341280.22890.409977
19-0.005852-0.03930.48443
20-0.046244-0.31020.378914
21-0.088702-0.5950.277401
22-0.119246-0.79990.213978
23-0.143846-0.96490.169864
24-0.155831-1.04530.150723
25-0.16203-1.08690.141428
26-0.16589-1.11280.135846
27-0.172257-1.15550.126986
28-0.18644-1.25070.108759
29-0.211225-1.41690.081693
30-0.242638-1.62770.055289
31-0.28089-1.88430.032999
32-0.309619-2.0770.02177
33-0.330452-2.21670.015869
34-0.341915-2.29360.013267
35-0.353103-2.36870.011102
36-0.363441-2.4380.00939
37-0.375197-2.51690.007736
38-0.378767-2.54080.007288
39-0.366274-2.4570.008964
40-0.331106-2.22110.015709
41-0.280761-1.88340.033059
42-0.220623-1.480.072922
43-0.152498-1.0230.15589
44-0.075011-0.50320.308642
45NANANA
46NANANA
47NANANA
48NANANA

\begin{tabular}{lllllllll}
\hline
Autocorrelation Function \tabularnewline
Time lag k & ACF(k) & T-STAT & P-value \tabularnewline
1 & 0.89423 & 5.9987 & 0 \tabularnewline
2 & 0.780912 & 5.2385 & 2e-06 \tabularnewline
3 & 0.669271 & 4.4896 & 2.5e-05 \tabularnewline
4 & 0.560118 & 3.7574 & 0.000246 \tabularnewline
5 & 0.460335 & 3.088 & 0.001723 \tabularnewline
6 & 0.379481 & 2.5456 & 0.007202 \tabularnewline
7 & 0.312159 & 2.094 & 0.020961 \tabularnewline
8 & 0.256636 & 1.7216 & 0.046008 \tabularnewline
9 & 0.218593 & 1.4664 & 0.074751 \tabularnewline
10 & 0.179958 & 1.2072 & 0.116832 \tabularnewline
11 & 0.130372 & 0.8746 & 0.193229 \tabularnewline
12 & 0.098502 & 0.6608 & 0.256064 \tabularnewline
13 & 0.081032 & 0.5436 & 0.294707 \tabularnewline
14 & 0.073507 & 0.4931 & 0.31217 \tabularnewline
15 & 0.083247 & 0.5584 & 0.289658 \tabularnewline
16 & 0.082183 & 0.5513 & 0.292078 \tabularnewline
17 & 0.065197 & 0.4374 & 0.331974 \tabularnewline
18 & 0.034128 & 0.2289 & 0.409977 \tabularnewline
19 & -0.005852 & -0.0393 & 0.48443 \tabularnewline
20 & -0.046244 & -0.3102 & 0.378914 \tabularnewline
21 & -0.088702 & -0.595 & 0.277401 \tabularnewline
22 & -0.119246 & -0.7999 & 0.213978 \tabularnewline
23 & -0.143846 & -0.9649 & 0.169864 \tabularnewline
24 & -0.155831 & -1.0453 & 0.150723 \tabularnewline
25 & -0.16203 & -1.0869 & 0.141428 \tabularnewline
26 & -0.16589 & -1.1128 & 0.135846 \tabularnewline
27 & -0.172257 & -1.1555 & 0.126986 \tabularnewline
28 & -0.18644 & -1.2507 & 0.108759 \tabularnewline
29 & -0.211225 & -1.4169 & 0.081693 \tabularnewline
30 & -0.242638 & -1.6277 & 0.055289 \tabularnewline
31 & -0.28089 & -1.8843 & 0.032999 \tabularnewline
32 & -0.309619 & -2.077 & 0.02177 \tabularnewline
33 & -0.330452 & -2.2167 & 0.015869 \tabularnewline
34 & -0.341915 & -2.2936 & 0.013267 \tabularnewline
35 & -0.353103 & -2.3687 & 0.011102 \tabularnewline
36 & -0.363441 & -2.438 & 0.00939 \tabularnewline
37 & -0.375197 & -2.5169 & 0.007736 \tabularnewline
38 & -0.378767 & -2.5408 & 0.007288 \tabularnewline
39 & -0.366274 & -2.457 & 0.008964 \tabularnewline
40 & -0.331106 & -2.2211 & 0.015709 \tabularnewline
41 & -0.280761 & -1.8834 & 0.033059 \tabularnewline
42 & -0.220623 & -1.48 & 0.072922 \tabularnewline
43 & -0.152498 & -1.023 & 0.15589 \tabularnewline
44 & -0.075011 & -0.5032 & 0.308642 \tabularnewline
45 & NA & NA & NA \tabularnewline
46 & NA & NA & NA \tabularnewline
47 & NA & NA & NA \tabularnewline
48 & NA & NA & NA \tabularnewline
\hline
\end{tabular}
%Source: https://freestatistics.org/blog/index.php?pk=111968&T=1

[TABLE]
[ROW][C]Autocorrelation Function[/C][/ROW]
[ROW][C]Time lag k[/C][C]ACF(k)[/C][C]T-STAT[/C][C]P-value[/C][/ROW]
[ROW][C]1[/C][C]0.89423[/C][C]5.9987[/C][C]0[/C][/ROW]
[ROW][C]2[/C][C]0.780912[/C][C]5.2385[/C][C]2e-06[/C][/ROW]
[ROW][C]3[/C][C]0.669271[/C][C]4.4896[/C][C]2.5e-05[/C][/ROW]
[ROW][C]4[/C][C]0.560118[/C][C]3.7574[/C][C]0.000246[/C][/ROW]
[ROW][C]5[/C][C]0.460335[/C][C]3.088[/C][C]0.001723[/C][/ROW]
[ROW][C]6[/C][C]0.379481[/C][C]2.5456[/C][C]0.007202[/C][/ROW]
[ROW][C]7[/C][C]0.312159[/C][C]2.094[/C][C]0.020961[/C][/ROW]
[ROW][C]8[/C][C]0.256636[/C][C]1.7216[/C][C]0.046008[/C][/ROW]
[ROW][C]9[/C][C]0.218593[/C][C]1.4664[/C][C]0.074751[/C][/ROW]
[ROW][C]10[/C][C]0.179958[/C][C]1.2072[/C][C]0.116832[/C][/ROW]
[ROW][C]11[/C][C]0.130372[/C][C]0.8746[/C][C]0.193229[/C][/ROW]
[ROW][C]12[/C][C]0.098502[/C][C]0.6608[/C][C]0.256064[/C][/ROW]
[ROW][C]13[/C][C]0.081032[/C][C]0.5436[/C][C]0.294707[/C][/ROW]
[ROW][C]14[/C][C]0.073507[/C][C]0.4931[/C][C]0.31217[/C][/ROW]
[ROW][C]15[/C][C]0.083247[/C][C]0.5584[/C][C]0.289658[/C][/ROW]
[ROW][C]16[/C][C]0.082183[/C][C]0.5513[/C][C]0.292078[/C][/ROW]
[ROW][C]17[/C][C]0.065197[/C][C]0.4374[/C][C]0.331974[/C][/ROW]
[ROW][C]18[/C][C]0.034128[/C][C]0.2289[/C][C]0.409977[/C][/ROW]
[ROW][C]19[/C][C]-0.005852[/C][C]-0.0393[/C][C]0.48443[/C][/ROW]
[ROW][C]20[/C][C]-0.046244[/C][C]-0.3102[/C][C]0.378914[/C][/ROW]
[ROW][C]21[/C][C]-0.088702[/C][C]-0.595[/C][C]0.277401[/C][/ROW]
[ROW][C]22[/C][C]-0.119246[/C][C]-0.7999[/C][C]0.213978[/C][/ROW]
[ROW][C]23[/C][C]-0.143846[/C][C]-0.9649[/C][C]0.169864[/C][/ROW]
[ROW][C]24[/C][C]-0.155831[/C][C]-1.0453[/C][C]0.150723[/C][/ROW]
[ROW][C]25[/C][C]-0.16203[/C][C]-1.0869[/C][C]0.141428[/C][/ROW]
[ROW][C]26[/C][C]-0.16589[/C][C]-1.1128[/C][C]0.135846[/C][/ROW]
[ROW][C]27[/C][C]-0.172257[/C][C]-1.1555[/C][C]0.126986[/C][/ROW]
[ROW][C]28[/C][C]-0.18644[/C][C]-1.2507[/C][C]0.108759[/C][/ROW]
[ROW][C]29[/C][C]-0.211225[/C][C]-1.4169[/C][C]0.081693[/C][/ROW]
[ROW][C]30[/C][C]-0.242638[/C][C]-1.6277[/C][C]0.055289[/C][/ROW]
[ROW][C]31[/C][C]-0.28089[/C][C]-1.8843[/C][C]0.032999[/C][/ROW]
[ROW][C]32[/C][C]-0.309619[/C][C]-2.077[/C][C]0.02177[/C][/ROW]
[ROW][C]33[/C][C]-0.330452[/C][C]-2.2167[/C][C]0.015869[/C][/ROW]
[ROW][C]34[/C][C]-0.341915[/C][C]-2.2936[/C][C]0.013267[/C][/ROW]
[ROW][C]35[/C][C]-0.353103[/C][C]-2.3687[/C][C]0.011102[/C][/ROW]
[ROW][C]36[/C][C]-0.363441[/C][C]-2.438[/C][C]0.00939[/C][/ROW]
[ROW][C]37[/C][C]-0.375197[/C][C]-2.5169[/C][C]0.007736[/C][/ROW]
[ROW][C]38[/C][C]-0.378767[/C][C]-2.5408[/C][C]0.007288[/C][/ROW]
[ROW][C]39[/C][C]-0.366274[/C][C]-2.457[/C][C]0.008964[/C][/ROW]
[ROW][C]40[/C][C]-0.331106[/C][C]-2.2211[/C][C]0.015709[/C][/ROW]
[ROW][C]41[/C][C]-0.280761[/C][C]-1.8834[/C][C]0.033059[/C][/ROW]
[ROW][C]42[/C][C]-0.220623[/C][C]-1.48[/C][C]0.072922[/C][/ROW]
[ROW][C]43[/C][C]-0.152498[/C][C]-1.023[/C][C]0.15589[/C][/ROW]
[ROW][C]44[/C][C]-0.075011[/C][C]-0.5032[/C][C]0.308642[/C][/ROW]
[ROW][C]45[/C][C]NA[/C][C]NA[/C][C]NA[/C][/ROW]
[ROW][C]46[/C][C]NA[/C][C]NA[/C][C]NA[/C][/ROW]
[ROW][C]47[/C][C]NA[/C][C]NA[/C][C]NA[/C][/ROW]
[ROW][C]48[/C][C]NA[/C][C]NA[/C][C]NA[/C][/ROW]
[/TABLE]
Source: https://freestatistics.org/blog/index.php?pk=111968&T=1

Globally Unique Identifier (entire table): ba.freestatistics.org/blog/index.php?pk=111968&T=1

As an alternative you can also use a QR Code:  

The GUIDs for individual cells are displayed in the table below:

Autocorrelation Function
Time lag kACF(k)T-STATP-value
10.894235.99870
20.7809125.23852e-06
30.6692714.48962.5e-05
40.5601183.75740.000246
50.4603353.0880.001723
60.3794812.54560.007202
70.3121592.0940.020961
80.2566361.72160.046008
90.2185931.46640.074751
100.1799581.20720.116832
110.1303720.87460.193229
120.0985020.66080.256064
130.0810320.54360.294707
140.0735070.49310.31217
150.0832470.55840.289658
160.0821830.55130.292078
170.0651970.43740.331974
180.0341280.22890.409977
19-0.005852-0.03930.48443
20-0.046244-0.31020.378914
21-0.088702-0.5950.277401
22-0.119246-0.79990.213978
23-0.143846-0.96490.169864
24-0.155831-1.04530.150723
25-0.16203-1.08690.141428
26-0.16589-1.11280.135846
27-0.172257-1.15550.126986
28-0.18644-1.25070.108759
29-0.211225-1.41690.081693
30-0.242638-1.62770.055289
31-0.28089-1.88430.032999
32-0.309619-2.0770.02177
33-0.330452-2.21670.015869
34-0.341915-2.29360.013267
35-0.353103-2.36870.011102
36-0.363441-2.4380.00939
37-0.375197-2.51690.007736
38-0.378767-2.54080.007288
39-0.366274-2.4570.008964
40-0.331106-2.22110.015709
41-0.280761-1.88340.033059
42-0.220623-1.480.072922
43-0.152498-1.0230.15589
44-0.075011-0.50320.308642
45NANANA
46NANANA
47NANANA
48NANANA


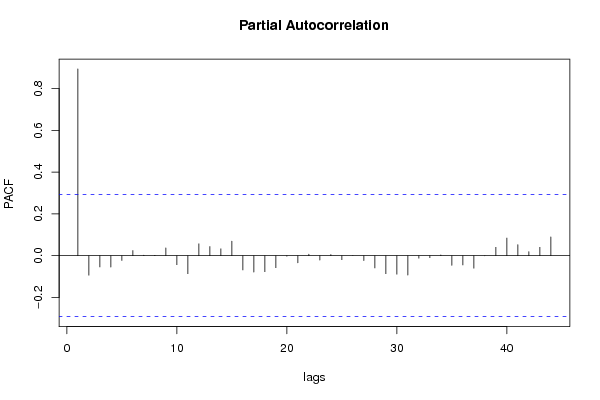
Partial Autocorrelation Function
Time lag kPACF(k)T-STATP-value
10.894235.99870
2-0.093516-0.62730.266807
3-0.053991-0.36220.359456
4-0.054911-0.36840.357169
5-0.023252-0.1560.438374
60.0243260.16320.435552
70.0021950.01470.49416
80.0014270.00960.496202
90.0371410.24910.402191
10-0.043075-0.2890.386972
11-0.086283-0.57880.282804
120.0565340.37920.353147
130.0434460.29140.386024
140.0325760.21850.414003
150.0692220.46440.322316
16-0.068334-0.45840.324436
17-0.07838-0.52580.300809
18-0.076953-0.51620.304115
19-0.057725-0.38720.350205
20-0.002822-0.01890.492491
21-0.034574-0.23190.408822
220.0068680.04610.481729
23-0.020943-0.14050.444449
240.0054060.03630.485615
25-0.019544-0.13110.448139
26-0.000103-7e-040.499727
27-0.023478-0.15750.437778
28-0.058646-0.39340.347937
29-0.086568-0.58070.282164
30-0.089072-0.59750.276579
31-0.092749-0.62220.268482
32-0.012128-0.08140.467759
33-0.00946-0.06350.474842
340.0031790.02130.491541
35-0.046469-0.31170.378346
36-0.044778-0.30040.382634
37-0.060338-0.40480.343787
38-0.000804-0.00540.497861
390.0398370.26720.395254
400.0845350.56710.28674
410.052640.35310.362823
420.0192360.1290.448952
430.039920.26780.395042
440.0898960.6030.274753
45NANANA
46NANANA
47NANANA
48NANANA

\begin{tabular}{lllllllll}
\hline
Partial Autocorrelation Function \tabularnewline
Time lag k & PACF(k) & T-STAT & P-value \tabularnewline
1 & 0.89423 & 5.9987 & 0 \tabularnewline
2 & -0.093516 & -0.6273 & 0.266807 \tabularnewline
3 & -0.053991 & -0.3622 & 0.359456 \tabularnewline
4 & -0.054911 & -0.3684 & 0.357169 \tabularnewline
5 & -0.023252 & -0.156 & 0.438374 \tabularnewline
6 & 0.024326 & 0.1632 & 0.435552 \tabularnewline
7 & 0.002195 & 0.0147 & 0.49416 \tabularnewline
8 & 0.001427 & 0.0096 & 0.496202 \tabularnewline
9 & 0.037141 & 0.2491 & 0.402191 \tabularnewline
10 & -0.043075 & -0.289 & 0.386972 \tabularnewline
11 & -0.086283 & -0.5788 & 0.282804 \tabularnewline
12 & 0.056534 & 0.3792 & 0.353147 \tabularnewline
13 & 0.043446 & 0.2914 & 0.386024 \tabularnewline
14 & 0.032576 & 0.2185 & 0.414003 \tabularnewline
15 & 0.069222 & 0.4644 & 0.322316 \tabularnewline
16 & -0.068334 & -0.4584 & 0.324436 \tabularnewline
17 & -0.07838 & -0.5258 & 0.300809 \tabularnewline
18 & -0.076953 & -0.5162 & 0.304115 \tabularnewline
19 & -0.057725 & -0.3872 & 0.350205 \tabularnewline
20 & -0.002822 & -0.0189 & 0.492491 \tabularnewline
21 & -0.034574 & -0.2319 & 0.408822 \tabularnewline
22 & 0.006868 & 0.0461 & 0.481729 \tabularnewline
23 & -0.020943 & -0.1405 & 0.444449 \tabularnewline
24 & 0.005406 & 0.0363 & 0.485615 \tabularnewline
25 & -0.019544 & -0.1311 & 0.448139 \tabularnewline
26 & -0.000103 & -7e-04 & 0.499727 \tabularnewline
27 & -0.023478 & -0.1575 & 0.437778 \tabularnewline
28 & -0.058646 & -0.3934 & 0.347937 \tabularnewline
29 & -0.086568 & -0.5807 & 0.282164 \tabularnewline
30 & -0.089072 & -0.5975 & 0.276579 \tabularnewline
31 & -0.092749 & -0.6222 & 0.268482 \tabularnewline
32 & -0.012128 & -0.0814 & 0.467759 \tabularnewline
33 & -0.00946 & -0.0635 & 0.474842 \tabularnewline
34 & 0.003179 & 0.0213 & 0.491541 \tabularnewline
35 & -0.046469 & -0.3117 & 0.378346 \tabularnewline
36 & -0.044778 & -0.3004 & 0.382634 \tabularnewline
37 & -0.060338 & -0.4048 & 0.343787 \tabularnewline
38 & -0.000804 & -0.0054 & 0.497861 \tabularnewline
39 & 0.039837 & 0.2672 & 0.395254 \tabularnewline
40 & 0.084535 & 0.5671 & 0.28674 \tabularnewline
41 & 0.05264 & 0.3531 & 0.362823 \tabularnewline
42 & 0.019236 & 0.129 & 0.448952 \tabularnewline
43 & 0.03992 & 0.2678 & 0.395042 \tabularnewline
44 & 0.089896 & 0.603 & 0.274753 \tabularnewline
45 & NA & NA & NA \tabularnewline
46 & NA & NA & NA \tabularnewline
47 & NA & NA & NA \tabularnewline
48 & NA & NA & NA \tabularnewline
\hline
\end{tabular}
%Source: https://freestatistics.org/blog/index.php?pk=111968&T=2

[TABLE]
[ROW][C]Partial Autocorrelation Function[/C][/ROW]
[ROW][C]Time lag k[/C][C]PACF(k)[/C][C]T-STAT[/C][C]P-value[/C][/ROW]
[ROW][C]1[/C][C]0.89423[/C][C]5.9987[/C][C]0[/C][/ROW]
[ROW][C]2[/C][C]-0.093516[/C][C]-0.6273[/C][C]0.266807[/C][/ROW]
[ROW][C]3[/C][C]-0.053991[/C][C]-0.3622[/C][C]0.359456[/C][/ROW]
[ROW][C]4[/C][C]-0.054911[/C][C]-0.3684[/C][C]0.357169[/C][/ROW]
[ROW][C]5[/C][C]-0.023252[/C][C]-0.156[/C][C]0.438374[/C][/ROW]
[ROW][C]6[/C][C]0.024326[/C][C]0.1632[/C][C]0.435552[/C][/ROW]
[ROW][C]7[/C][C]0.002195[/C][C]0.0147[/C][C]0.49416[/C][/ROW]
[ROW][C]8[/C][C]0.001427[/C][C]0.0096[/C][C]0.496202[/C][/ROW]
[ROW][C]9[/C][C]0.037141[/C][C]0.2491[/C][C]0.402191[/C][/ROW]
[ROW][C]10[/C][C]-0.043075[/C][C]-0.289[/C][C]0.386972[/C][/ROW]
[ROW][C]11[/C][C]-0.086283[/C][C]-0.5788[/C][C]0.282804[/C][/ROW]
[ROW][C]12[/C][C]0.056534[/C][C]0.3792[/C][C]0.353147[/C][/ROW]
[ROW][C]13[/C][C]0.043446[/C][C]0.2914[/C][C]0.386024[/C][/ROW]
[ROW][C]14[/C][C]0.032576[/C][C]0.2185[/C][C]0.414003[/C][/ROW]
[ROW][C]15[/C][C]0.069222[/C][C]0.4644[/C][C]0.322316[/C][/ROW]
[ROW][C]16[/C][C]-0.068334[/C][C]-0.4584[/C][C]0.324436[/C][/ROW]
[ROW][C]17[/C][C]-0.07838[/C][C]-0.5258[/C][C]0.300809[/C][/ROW]
[ROW][C]18[/C][C]-0.076953[/C][C]-0.5162[/C][C]0.304115[/C][/ROW]
[ROW][C]19[/C][C]-0.057725[/C][C]-0.3872[/C][C]0.350205[/C][/ROW]
[ROW][C]20[/C][C]-0.002822[/C][C]-0.0189[/C][C]0.492491[/C][/ROW]
[ROW][C]21[/C][C]-0.034574[/C][C]-0.2319[/C][C]0.408822[/C][/ROW]
[ROW][C]22[/C][C]0.006868[/C][C]0.0461[/C][C]0.481729[/C][/ROW]
[ROW][C]23[/C][C]-0.020943[/C][C]-0.1405[/C][C]0.444449[/C][/ROW]
[ROW][C]24[/C][C]0.005406[/C][C]0.0363[/C][C]0.485615[/C][/ROW]
[ROW][C]25[/C][C]-0.019544[/C][C]-0.1311[/C][C]0.448139[/C][/ROW]
[ROW][C]26[/C][C]-0.000103[/C][C]-7e-04[/C][C]0.499727[/C][/ROW]
[ROW][C]27[/C][C]-0.023478[/C][C]-0.1575[/C][C]0.437778[/C][/ROW]
[ROW][C]28[/C][C]-0.058646[/C][C]-0.3934[/C][C]0.347937[/C][/ROW]
[ROW][C]29[/C][C]-0.086568[/C][C]-0.5807[/C][C]0.282164[/C][/ROW]
[ROW][C]30[/C][C]-0.089072[/C][C]-0.5975[/C][C]0.276579[/C][/ROW]
[ROW][C]31[/C][C]-0.092749[/C][C]-0.6222[/C][C]0.268482[/C][/ROW]
[ROW][C]32[/C][C]-0.012128[/C][C]-0.0814[/C][C]0.467759[/C][/ROW]
[ROW][C]33[/C][C]-0.00946[/C][C]-0.0635[/C][C]0.474842[/C][/ROW]
[ROW][C]34[/C][C]0.003179[/C][C]0.0213[/C][C]0.491541[/C][/ROW]
[ROW][C]35[/C][C]-0.046469[/C][C]-0.3117[/C][C]0.378346[/C][/ROW]
[ROW][C]36[/C][C]-0.044778[/C][C]-0.3004[/C][C]0.382634[/C][/ROW]
[ROW][C]37[/C][C]-0.060338[/C][C]-0.4048[/C][C]0.343787[/C][/ROW]
[ROW][C]38[/C][C]-0.000804[/C][C]-0.0054[/C][C]0.497861[/C][/ROW]
[ROW][C]39[/C][C]0.039837[/C][C]0.2672[/C][C]0.395254[/C][/ROW]
[ROW][C]40[/C][C]0.084535[/C][C]0.5671[/C][C]0.28674[/C][/ROW]
[ROW][C]41[/C][C]0.05264[/C][C]0.3531[/C][C]0.362823[/C][/ROW]
[ROW][C]42[/C][C]0.019236[/C][C]0.129[/C][C]0.448952[/C][/ROW]
[ROW][C]43[/C][C]0.03992[/C][C]0.2678[/C][C]0.395042[/C][/ROW]
[ROW][C]44[/C][C]0.089896[/C][C]0.603[/C][C]0.274753[/C][/ROW]
[ROW][C]45[/C][C]NA[/C][C]NA[/C][C]NA[/C][/ROW]
[ROW][C]46[/C][C]NA[/C][C]NA[/C][C]NA[/C][/ROW]
[ROW][C]47[/C][C]NA[/C][C]NA[/C][C]NA[/C][/ROW]
[ROW][C]48[/C][C]NA[/C][C]NA[/C][C]NA[/C][/ROW]
[/TABLE]
Source: https://freestatistics.org/blog/index.php?pk=111968&T=2

Globally Unique Identifier (entire table): ba.freestatistics.org/blog/index.php?pk=111968&T=2

As an alternative you can also use a QR Code:  

The GUIDs for individual cells are displayed in the table below:

Partial Autocorrelation Function
Time lag kPACF(k)T-STATP-value
10.894235.99870
2-0.093516-0.62730.266807
3-0.053991-0.36220.359456
4-0.054911-0.36840.357169
5-0.023252-0.1560.438374
60.0243260.16320.435552
70.0021950.01470.49416
80.0014270.00960.496202
90.0371410.24910.402191
10-0.043075-0.2890.386972
11-0.086283-0.57880.282804
120.0565340.37920.353147
130.0434460.29140.386024
140.0325760.21850.414003
150.0692220.46440.322316
16-0.068334-0.45840.324436
17-0.07838-0.52580.300809
18-0.076953-0.51620.304115
19-0.057725-0.38720.350205
20-0.002822-0.01890.492491
21-0.034574-0.23190.408822
220.0068680.04610.481729
23-0.020943-0.14050.444449
240.0054060.03630.485615
25-0.019544-0.13110.448139
26-0.000103-7e-040.499727
27-0.023478-0.15750.437778
28-0.058646-0.39340.347937
29-0.086568-0.58070.282164
30-0.089072-0.59750.276579
31-0.092749-0.62220.268482
32-0.012128-0.08140.467759
33-0.00946-0.06350.474842
340.0031790.02130.491541
35-0.046469-0.31170.378346
36-0.044778-0.30040.382634
37-0.060338-0.40480.343787
38-0.000804-0.00540.497861
390.0398370.26720.395254
400.0845350.56710.28674
410.052640.35310.362823
420.0192360.1290.448952
430.039920.26780.395042
440.0898960.6030.274753
45NANANA
46NANANA
47NANANA
48NANANA


Parameters (Session):
par1 = 48 ; par2 = 1 ; par3 = 0 ; par4 = 0 ; par5 = 1 ; par6 = White Noise ; par7 = 0.95 ;
Parameters (R input):
par1 = 48 ; par2 = 1 ; par3 = 0 ; par4 = 0 ; par5 = 1 ; par6 = White Noise ; par7 = 0.95 ; par8 = ;
R code (references can be found in the software module):
if (par1 == 'Default') {
par1 = 10*log10(length(x))
} else {
par1 <- as.numeric(par1)
}
par2 <- as.numeric(par2)
par3 <- as.numeric(par3)
par4 <- as.numeric(par4)
par5 <- as.numeric(par5)
if (par6 == 'White Noise') par6 <- 'white' else par6 <- 'ma'
par7 <- as.numeric(par7)
if (par2 == 0) {
x <- log(x)
} else {
x <- (x ^ par2 - 1) / par2
}
if (par3 > 0) x <- diff(x,lag=1,difference=par3)
if (par4 > 0) x <- diff(x,lag=par5,difference=par4)
bitmap(file='pic1.png')
racf <- acf(x, par1, main='Autocorrelation', xlab='time lag', ylab='ACF', ci.type=par6, ci=par7, sub=paste('(lambda=',par2,', d=',par3,', D=',par4,', CI=', par7, ', CI type=',par6,')',sep=''))
dev.off()
bitmap(file='pic2.png')
rpacf <- pacf(x,par1,main='Partial Autocorrelation',xlab='lags',ylab='PACF')
dev.off()
(myacf <- c(racf$acf))
(mypacf <- c(rpacf$acf))
lengthx <- length(x)
sqrtn <- sqrt(lengthx)
load(file='createtable')
a<-table.start()
a<-table.row.start(a)
a<-table.element(a,'Autocorrelation Function',4,TRUE)
a<-table.row.end(a)
a<-table.row.start(a)
a<-table.element(a,'Time lag k',header=TRUE)
a<-table.element(a,hyperlink('basics.htm','ACF(k)','click here for more information about the Autocorrelation Function'),header=TRUE)
a<-table.element(a,'T-STAT',header=TRUE)
a<-table.element(a,'P-value',header=TRUE)
a<-table.row.end(a)
for (i in 2:(par1+1)) {
a<-table.row.start(a)
a<-table.element(a,i-1,header=TRUE)
a<-table.element(a,round(myacf[i],6))
mytstat <- myacf[i]*sqrtn
a<-table.element(a,round(mytstat,4))
a<-table.element(a,round(1-pt(abs(mytstat),lengthx),6))
a<-table.row.end(a)
}
a<-table.end(a)
table.save(a,file='mytable.tab')
a<-table.start()
a<-table.row.start(a)
a<-table.element(a,'Partial Autocorrelation Function',4,TRUE)
a<-table.row.end(a)
a<-table.row.start(a)
a<-table.element(a,'Time lag k',header=TRUE)
a<-table.element(a,hyperlink('basics.htm','PACF(k)','click here for more information about the Partial Autocorrelation Function'),header=TRUE)
a<-table.element(a,'T-STAT',header=TRUE)
a<-table.element(a,'P-value',header=TRUE)
a<-table.row.end(a)
for (i in 1:par1) {
a<-table.row.start(a)
a<-table.element(a,i,header=TRUE)
a<-table.element(a,round(mypacf[i],6))
mytstat <- mypacf[i]*sqrtn
a<-table.element(a,round(mytstat,4))
a<-table.element(a,round(1-pt(abs(mytstat),lengthx),6))
a<-table.row.end(a)
}
a<-table.end(a)
table.save(a,file='mytable1.tab')