| Multiple Linear Regression - Estimated Regression Equation |
| faillissementen[t] = + 44.9943140478135 + 0.119676240683047`Y-1`[t] + 0.118023330461420`Y-2`[t] -0.114070297649060`Y-3`[t] -0.0825692584978275`Y-4`[t] + 0.889367993868057M1[t] + 14.1736152636581M2[t] -8.39507896223981M3[t] -16.831064932218M4[t] + 15.0692743531417M5[t] + 17.4087369750493M6[t] -3.7535077827975M7[t] + 7.3282567821366M8[t] + 5.64905477660003M9[t] + 2.49342334199798M10[t] + 17.1748580182210M11[t] + 0.00847982563409131t + e[t] |
| Multiple Linear Regression - Ordinary Least Squares | |||||
| Variable | Parameter | S.D. | T-STAT H0: parameter = 0 | 2-tail p-value | 1-tail p-value |
| (Intercept) | 44.9943140478135 | 15.291612 | 2.9424 | 0.00489 | 0.002445 |
| `Y-1` | 0.119676240683047 | 0.140334 | 0.8528 | 0.397759 | 0.198879 |
| `Y-2` | 0.118023330461420 | 0.139463 | 0.8463 | 0.401354 | 0.200677 |
| `Y-3` | -0.114070297649060 | 0.138079 | -0.8261 | 0.412581 | 0.20629 |
| `Y-4` | -0.0825692584978275 | 0.144016 | -0.5733 | 0.568938 | 0.284469 |
| M1 | 0.889367993868057 | 5.962993 | 0.1491 | 0.882025 | 0.441013 |
| M2 | 14.1736152636581 | 5.836522 | 2.4284 | 0.01873 | 0.009365 |
| M3 | -8.39507896223981 | 5.188471 | -1.618 | 0.111826 | 0.055913 |
| M4 | -16.831064932218 | 6.524153 | -2.5798 | 0.01281 | 0.006405 |
| M5 | 15.0692743531417 | 7.271138 | 2.0725 | 0.043294 | 0.021647 |
| M6 | 17.4087369750493 | 5.930643 | 2.9354 | 0.004985 | 0.002493 |
| M7 | -3.7535077827975 | 6.381471 | -0.5882 | 0.559002 | 0.279501 |
| M8 | 7.3282567821366 | 7.257272 | 1.0098 | 0.317367 | 0.158684 |
| M9 | 5.64905477660003 | 5.630819 | 1.0032 | 0.320482 | 0.160241 |
| M10 | 2.49342334199798 | 5.641326 | 0.442 | 0.660363 | 0.330182 |
| M11 | 17.1748580182210 | 5.830963 | 2.9455 | 0.004849 | 0.002424 |
| t | 0.00847982563409131 | 0.052189 | 0.1625 | 0.871567 | 0.435784 |
| Multiple Linear Regression - Regression Statistics | |
| Multiple R | 0.80610013552331 |
| R-squared | 0.649797428490698 |
| Adjusted R-squared | 0.539929955076015 |
| F-TEST (value) | 5.91437491274698 |
| F-TEST (DF numerator) | 16 |
| F-TEST (DF denominator) | 51 |
| p-value | 5.17198614380376e-07 |
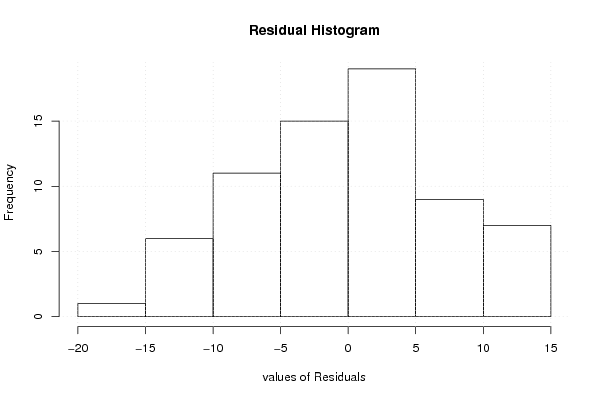
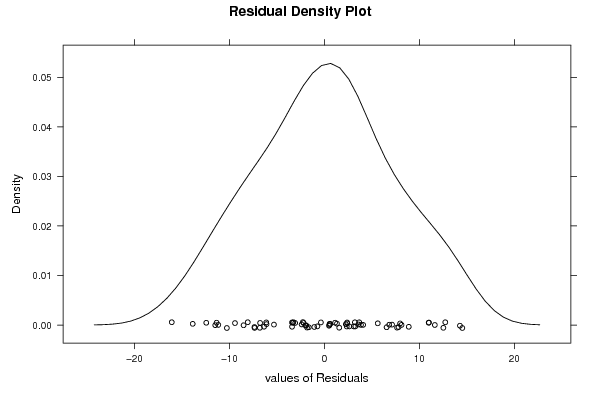
| Multiple Linear Regression - Residual Statistics | |
| Residual Standard Deviation | 8.26768004305843 |
| Sum Squared Residuals | 3486.08119801372 |
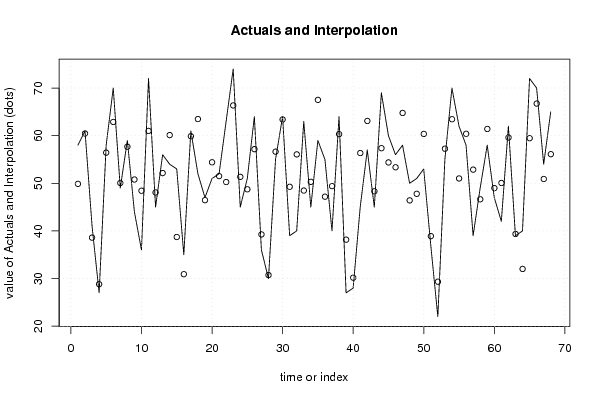
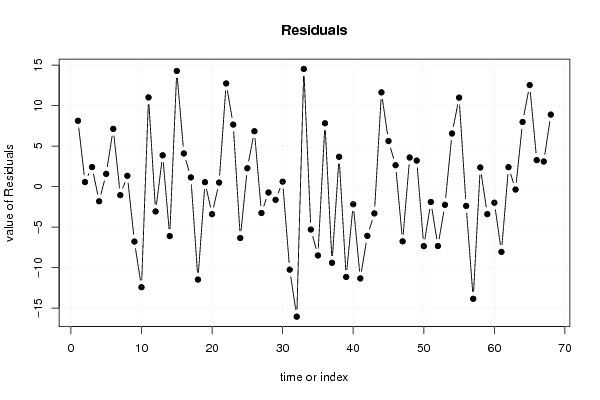
| Multiple Linear Regression - Actuals, Interpolation, and Residuals | |||
| Time or Index | Actuals | Interpolation Forecast | Residuals Prediction Error |
| 1 | 58 | 49.8720555329274 | 8.12794446707255 |
| 2 | 61 | 60.441553747877 | 0.558446252122982 |
| 3 | 41 | 38.5905597887531 | 2.40944021124695 |
| 4 | 27 | 28.8156539292661 | -1.81565392926611 |
| 5 | 58 | 56.4288974270195 | 1.57110257298047 |
| 6 | 70 | 62.8681748867635 | 7.13182511323652 |
| 7 | 49 | 50.0576174240948 | -1.05761742409475 |
| 8 | 59 | 57.6707311177047 | 1.32926888229526 |
| 9 | 44 | 50.7897908197215 | -6.78979081972154 |
| 10 | 36 | 48.4323740537784 | -12.4323740537784 |
| 11 | 72 | 60.9877801252136 | 11.0122198747864 |
| 12 | 45 | 48.0709218332826 | -3.07092183328265 |
| 13 | 56 | 52.1374523096136 | 3.86254769038645 |
| 14 | 54 | 60.1140114827093 | -6.11401148270931 |
| 15 | 53 | 38.7201059667579 | 14.2798940332421 |
| 16 | 35 | 30.9114736261095 | 4.08852637389046 |
| 17 | 61 | 59.8679758261691 | 1.13202417383088 |
| 18 | 52 | 63.4822893978091 | -11.4822893978091 |
| 19 | 47 | 46.4558795076269 | 0.544120492373131 |
| 20 | 51 | 54.4059516347124 | -3.40595163471238 |
| 21 | 52 | 51.503649723133 | 0.496350276866989 |
| 22 | 63 | 50.2617424914195 | 12.7382575085805 |
| 23 | 74 | 66.3426840731445 | 7.65731592685548 |
| 24 | 45 | 51.3466538315063 | -6.34665383150633 |
| 25 | 51 | 48.7348047736383 | 2.26519522636174 |
| 26 | 64 | 57.1598776121637 | 6.8401223878363 |
| 27 | 36 | 39.2633711118947 | -3.26337111189466 |
| 28 | 30 | 30.7293202349663 | -0.729320234966344 |
| 29 | 55 | 56.6370992285174 | -1.63709922851738 |
| 30 | 64 | 63.3893756840686 | 0.610624315931397 |
| 31 | 39 | 49.2596412033724 | -10.2596412033724 |
| 32 | 40 | 56.0638476607776 | -16.0638476607776 |
| 33 | 63 | 48.4713543187355 | 14.5286456812645 |
| 34 | 45 | 50.3034136906851 | -5.30341369068506 |
| 35 | 59 | 67.5038536256567 | -8.50385362565667 |
| 36 | 55 | 47.1823367499006 | 7.81766325009939 |
| 37 | 40 | 49.4079786453635 | -9.40797864536349 |
| 38 | 64 | 60.3227312945703 | 3.67726870542972 |
| 39 | 27 | 38.1647082854049 | -11.1647082854049 |
| 40 | 28 | 30.1830726655894 | -2.18307266558940 |
| 41 | 45 | 56.3455565240837 | -11.3455565240837 |
| 42 | 57 | 63.084957202766 | -6.08495720276593 |
| 43 | 45 | 48.3146960433645 | -3.31469604336451 |
| 44 | 69 | 57.3633411927413 | 11.6366588072587 |
| 45 | 60 | 54.3760478574431 | 5.62395214255686 |
| 46 | 56 | 53.3623824832166 | 2.63761751678336 |
| 47 | 58 | 64.7645260065853 | -6.76452600658531 |
| 48 | 50 | 46.4103774484125 | 3.58962255158754 |
| 49 | 51 | 47.7862665204498 | 3.21373347955025 |
| 50 | 53 | 60.3566196515587 | -7.35661965155874 |
| 51 | 37 | 38.9012049273193 | -1.90120492731928 |
| 52 | 22 | 29.3414093633028 | -7.34140936330281 |
| 53 | 55 | 57.2560017228723 | -2.25600172287228 |
| 54 | 70 | 63.4428964014225 | 6.55710359857752 |
| 55 | 62 | 51.0112075853835 | 10.9887924146165 |
| 56 | 58 | 60.388611062457 | -2.38861106245705 |
| 57 | 39 | 52.8591572809668 | -13.8591572809668 |
| 58 | 49 | 46.6400872809004 | 2.35991271909964 |
| 59 | 58 | 61.4011561693998 | -3.40115616939985 |
| 60 | 47 | 48.989710136898 | -1.98971013689797 |
| 61 | 42 | 50.0614422180075 | -8.0614422180075 |
| 62 | 62 | 59.605206211121 | 2.39479378887905 |
| 63 | 39 | 39.3600499198702 | -0.360049919870194 |
| 64 | 40 | 32.0190701807658 | 7.9809298192342 |
| 65 | 72 | 59.464469271338 | 12.5355307286620 |
| 66 | 70 | 66.7323064271704 | 3.26769357282964 |
| 67 | 54 | 50.900958236158 | 3.09904176384200 |
| 68 | 65 | 56.1075173316069 | 8.89248266839315 |
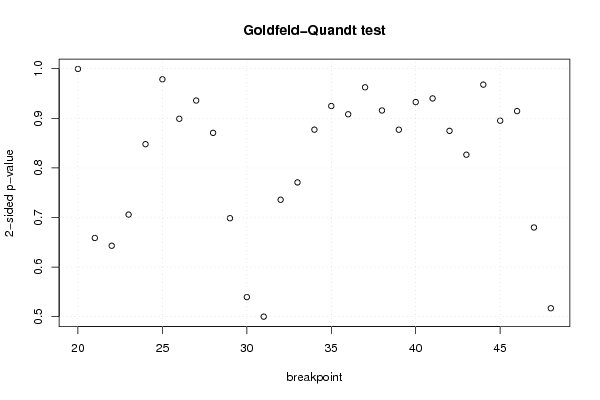
| Goldfeld-Quandt test for Heteroskedasticity | |||
| p-values | Alternative Hypothesis | ||
| breakpoint index | greater | 2-sided | less |
| 20 | 0.499775094575356 | 0.999550189150712 | 0.500224905424644 |
| 21 | 0.329358084977960 | 0.658716169955921 | 0.67064191502204 |
| 22 | 0.678483764558413 | 0.643032470883175 | 0.321516235441587 |
| 23 | 0.647087399647295 | 0.70582520070541 | 0.352912600352705 |
| 24 | 0.576068197602718 | 0.847863604794563 | 0.423931802397282 |
| 25 | 0.48934015967609 | 0.97868031935218 | 0.51065984032391 |
| 26 | 0.449535992807091 | 0.899071985614182 | 0.550464007192909 |
| 27 | 0.532078332542743 | 0.935843334914513 | 0.467921667457257 |
| 28 | 0.43533910013304 | 0.87067820026608 | 0.56466089986696 |
| 29 | 0.349282770173304 | 0.698565540346607 | 0.650717229826696 |
| 30 | 0.2697338047305 | 0.539467609461 | 0.7302661952695 |
| 31 | 0.250029620382113 | 0.500059240764226 | 0.749970379617887 |
| 32 | 0.367891504095873 | 0.735783008191746 | 0.632108495904127 |
| 33 | 0.614607349882864 | 0.770785300234272 | 0.385392650117136 |
| 34 | 0.561448165581717 | 0.877103668836566 | 0.438551834418283 |
| 35 | 0.537619591289099 | 0.924760817421802 | 0.462380408710901 |
| 36 | 0.545942934279772 | 0.908114131440456 | 0.454057065720228 |
| 37 | 0.518731104688556 | 0.962537790622888 | 0.481268895311444 |
| 38 | 0.54210055479825 | 0.9157988904035 | 0.45789944520175 |
| 39 | 0.561473762930726 | 0.877052474138549 | 0.438526237069274 |
| 40 | 0.466363688841631 | 0.932727377683262 | 0.533636311158369 |
| 41 | 0.529912147077173 | 0.940175705845653 | 0.470087852922826 |
| 42 | 0.437363828339427 | 0.874727656678855 | 0.562636171660573 |
| 43 | 0.41329455719516 | 0.82658911439032 | 0.58670544280484 |
| 44 | 0.516032344182979 | 0.967935311634042 | 0.483967655817021 |
| 45 | 0.552415202377455 | 0.89516959524509 | 0.447584797622545 |
| 46 | 0.457292846751372 | 0.914585693502744 | 0.542707153248628 |
| 47 | 0.339954065172612 | 0.679908130345224 | 0.660045934827388 |
| 48 | 0.258525613650123 | 0.517051227300246 | 0.741474386349877 |
| Meta Analysis of Goldfeld-Quandt test for Heteroskedasticity | |||
| Description | # significant tests | % significant tests | OK/NOK |
| 1% type I error level | 0 | 0 | OK |
| 5% type I error level | 0 | 0 | OK |
| 10% type I error level | 0 | 0 | OK |