Free Statistics

of Irreproducible Research!

Author's title

Author*The author of this computation has been verified*
R Software Modulerwasp_autocorrelation.wasp
Title produced by software(Partial) Autocorrelation Function
Date of computationSat, 18 Dec 2010 13:12:07 +0000
Cite this page as followsStatistical Computations at FreeStatistics.org, Office for Research Development and Education, URL https://freestatistics.org/blog/index.php?v=date/2010/Dec/18/t1292677835n9xq9khsfttndsa.htm/, Retrieved Tue, 30 Apr 2024 02:55:41 +0000
Statistical Computations at FreeStatistics.org, Office for Research Development and Education, URL https://freestatistics.org/blog/index.php?pk=111943, Retrieved Tue, 30 Apr 2024 02:55:41 +0000
QR Codes:

Original text written by user:
IsPrivate?No (this computation is public)
User-defined keywords
Estimated Impact109
Family? (F = Feedback message, R = changed R code, M = changed R Module, P = changed Parameters, D = changed Data)
-       [(Partial) Autocorrelation Function] [autocorrelatiefun...] [2010-12-18 13:12:07] [efffa7146cfe4c2b113f6c7f36d84ca0] [Current]
-   P     [(Partial) Autocorrelation Function] [Gedifferentieerde...] [2010-12-18 15:14:54] [b659239b537e56f17142ee5c56ad6265]
Feedback Forum

Post a new message
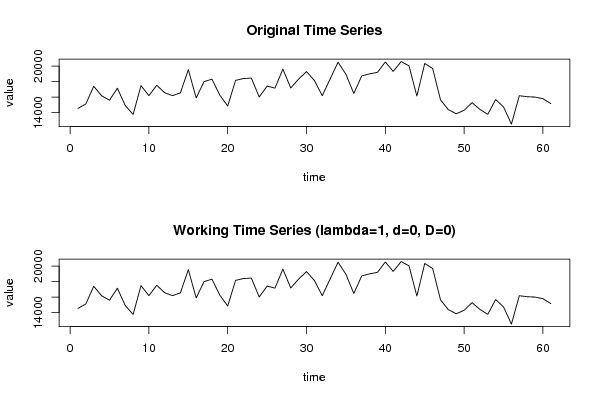
Dataseries X:
14544
15116
17413
16181
15607
17160
14915
13768
17487
16198
17535
16571
16198
16554
19554
15903
18003
18329
16260
14851
18174
18406
18466
16016
17428
17167
19630
17183
18344
19301
18147
16192
18374
20515
18957
16471
18746
19009
19211
20547
19325
20605
20056
16141
20359
19711
15638
14384
13855
14308
15290
14423
13779
15686
14733
12522
16189
16059
16007
15806
15160


Summary of computational transaction
Raw Inputview raw input (R code)
Raw Outputview raw output of R engine
Computing time2 seconds
R Server'Sir Ronald Aylmer Fisher' @ 193.190.124.24

\begin{tabular}{lllllllll}
\hline
Summary of computational transaction \tabularnewline
Raw Input & view raw input (R code)  \tabularnewline
Raw Output & view raw output of R engine  \tabularnewline
Computing time & 2 seconds \tabularnewline
R Server & 'Sir Ronald Aylmer Fisher' @ 193.190.124.24 \tabularnewline
\hline
\end{tabular}
%Source: https://freestatistics.org/blog/index.php?pk=111943&T=0

[TABLE]
[ROW][C]Summary of computational transaction[/C][/ROW]
[ROW][C]Raw Input[/C][C]view raw input (R code) [/C][/ROW]
[ROW][C]Raw Output[/C][C]view raw output of R engine [/C][/ROW]
[ROW][C]Computing time[/C][C]2 seconds[/C][/ROW]
[ROW][C]R Server[/C][C]'Sir Ronald Aylmer Fisher' @ 193.190.124.24[/C][/ROW]
[/TABLE]
Source: https://freestatistics.org/blog/index.php?pk=111943&T=0

Globally Unique Identifier (entire table): ba.freestatistics.org/blog/index.php?pk=111943&T=0

As an alternative you can also use a QR Code:  

The GUIDs for individual cells are displayed in the table below:

Summary of computational transaction
Raw Inputview raw input (R code)
Raw Outputview raw output of R engine
Computing time2 seconds
R Server'Sir Ronald Aylmer Fisher' @ 193.190.124.24


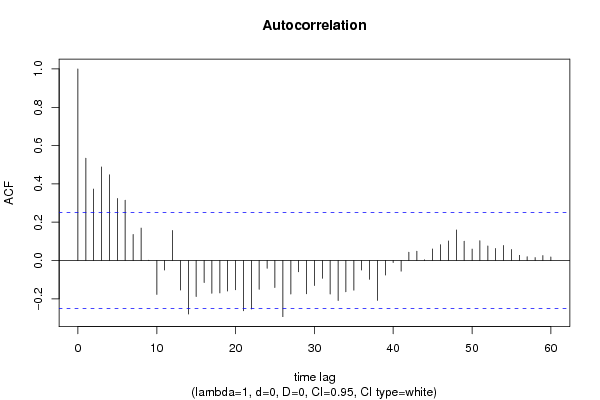
Autocorrelation Function
Time lag kACF(k)T-STATP-value
10.5337734.16894.9e-05
20.3729342.91270.0025
30.4887553.81730.000159
40.4471413.49230.000449
50.3235772.52720.007053
60.3151242.46120.008346
70.1355541.05870.146953
80.1693241.32250.095476
90.0015580.01220.495166
10-0.176926-1.38180.086031
11-0.050195-0.3920.3482
120.1568981.22540.112565
13-0.154233-1.20460.116506
14-0.278992-2.1790.016602
15-0.187949-1.46790.07363
16-0.115343-0.90090.185604
17-0.171571-1.340.092605
18-0.169083-1.32060.095787
19-0.159653-1.24690.108594
20-0.15249-1.1910.119137
21-0.262218-2.0480.022436
22-0.25291-1.97530.026382
23-0.150304-1.17390.122497
24-0.040114-0.31330.37756
25-0.14065-1.09850.138149
26-0.293112-2.28930.012769
27-0.174693-1.36440.088728
28-0.059141-0.46190.322896
29-0.173465-1.35480.090238
30-0.130816-1.02170.155477
31-0.092638-0.72350.236061
32-0.175245-1.36870.088055
33-0.209021-1.63250.053863
34-0.163262-1.27510.103552
35-0.154724-1.20840.115772
36-0.05014-0.39160.348356
37-0.098119-0.76630.223218
38-0.208324-1.62710.054439
39-0.076058-0.5940.277344
40-0.010149-0.07930.46854
41-0.055516-0.43360.333056
420.0434390.33930.367786
430.0482650.3770.353756
440.0034450.02690.48931
450.0603180.47110.319626
460.0820690.6410.26197
470.1018440.79540.214724
480.1593471.24450.10903
490.1004070.78420.217977
500.0594750.46450.321966
510.1035160.80850.210976
520.075680.59110.278326
530.0625660.48870.313418
540.0783620.6120.271398
550.0574510.44870.327617
560.0269650.21060.41695
570.0201910.15770.437607
580.015160.11840.45307
590.0256480.20030.42095
600.0182690.14270.443504

\begin{tabular}{lllllllll}
\hline
Autocorrelation Function \tabularnewline
Time lag k & ACF(k) & T-STAT & P-value \tabularnewline
1 & 0.533773 & 4.1689 & 4.9e-05 \tabularnewline
2 & 0.372934 & 2.9127 & 0.0025 \tabularnewline
3 & 0.488755 & 3.8173 & 0.000159 \tabularnewline
4 & 0.447141 & 3.4923 & 0.000449 \tabularnewline
5 & 0.323577 & 2.5272 & 0.007053 \tabularnewline
6 & 0.315124 & 2.4612 & 0.008346 \tabularnewline
7 & 0.135554 & 1.0587 & 0.146953 \tabularnewline
8 & 0.169324 & 1.3225 & 0.095476 \tabularnewline
9 & 0.001558 & 0.0122 & 0.495166 \tabularnewline
10 & -0.176926 & -1.3818 & 0.086031 \tabularnewline
11 & -0.050195 & -0.392 & 0.3482 \tabularnewline
12 & 0.156898 & 1.2254 & 0.112565 \tabularnewline
13 & -0.154233 & -1.2046 & 0.116506 \tabularnewline
14 & -0.278992 & -2.179 & 0.016602 \tabularnewline
15 & -0.187949 & -1.4679 & 0.07363 \tabularnewline
16 & -0.115343 & -0.9009 & 0.185604 \tabularnewline
17 & -0.171571 & -1.34 & 0.092605 \tabularnewline
18 & -0.169083 & -1.3206 & 0.095787 \tabularnewline
19 & -0.159653 & -1.2469 & 0.108594 \tabularnewline
20 & -0.15249 & -1.191 & 0.119137 \tabularnewline
21 & -0.262218 & -2.048 & 0.022436 \tabularnewline
22 & -0.25291 & -1.9753 & 0.026382 \tabularnewline
23 & -0.150304 & -1.1739 & 0.122497 \tabularnewline
24 & -0.040114 & -0.3133 & 0.37756 \tabularnewline
25 & -0.14065 & -1.0985 & 0.138149 \tabularnewline
26 & -0.293112 & -2.2893 & 0.012769 \tabularnewline
27 & -0.174693 & -1.3644 & 0.088728 \tabularnewline
28 & -0.059141 & -0.4619 & 0.322896 \tabularnewline
29 & -0.173465 & -1.3548 & 0.090238 \tabularnewline
30 & -0.130816 & -1.0217 & 0.155477 \tabularnewline
31 & -0.092638 & -0.7235 & 0.236061 \tabularnewline
32 & -0.175245 & -1.3687 & 0.088055 \tabularnewline
33 & -0.209021 & -1.6325 & 0.053863 \tabularnewline
34 & -0.163262 & -1.2751 & 0.103552 \tabularnewline
35 & -0.154724 & -1.2084 & 0.115772 \tabularnewline
36 & -0.05014 & -0.3916 & 0.348356 \tabularnewline
37 & -0.098119 & -0.7663 & 0.223218 \tabularnewline
38 & -0.208324 & -1.6271 & 0.054439 \tabularnewline
39 & -0.076058 & -0.594 & 0.277344 \tabularnewline
40 & -0.010149 & -0.0793 & 0.46854 \tabularnewline
41 & -0.055516 & -0.4336 & 0.333056 \tabularnewline
42 & 0.043439 & 0.3393 & 0.367786 \tabularnewline
43 & 0.048265 & 0.377 & 0.353756 \tabularnewline
44 & 0.003445 & 0.0269 & 0.48931 \tabularnewline
45 & 0.060318 & 0.4711 & 0.319626 \tabularnewline
46 & 0.082069 & 0.641 & 0.26197 \tabularnewline
47 & 0.101844 & 0.7954 & 0.214724 \tabularnewline
48 & 0.159347 & 1.2445 & 0.10903 \tabularnewline
49 & 0.100407 & 0.7842 & 0.217977 \tabularnewline
50 & 0.059475 & 0.4645 & 0.321966 \tabularnewline
51 & 0.103516 & 0.8085 & 0.210976 \tabularnewline
52 & 0.07568 & 0.5911 & 0.278326 \tabularnewline
53 & 0.062566 & 0.4887 & 0.313418 \tabularnewline
54 & 0.078362 & 0.612 & 0.271398 \tabularnewline
55 & 0.057451 & 0.4487 & 0.327617 \tabularnewline
56 & 0.026965 & 0.2106 & 0.41695 \tabularnewline
57 & 0.020191 & 0.1577 & 0.437607 \tabularnewline
58 & 0.01516 & 0.1184 & 0.45307 \tabularnewline
59 & 0.025648 & 0.2003 & 0.42095 \tabularnewline
60 & 0.018269 & 0.1427 & 0.443504 \tabularnewline
\hline
\end{tabular}
%Source: https://freestatistics.org/blog/index.php?pk=111943&T=1

[TABLE]
[ROW][C]Autocorrelation Function[/C][/ROW]
[ROW][C]Time lag k[/C][C]ACF(k)[/C][C]T-STAT[/C][C]P-value[/C][/ROW]
[ROW][C]1[/C][C]0.533773[/C][C]4.1689[/C][C]4.9e-05[/C][/ROW]
[ROW][C]2[/C][C]0.372934[/C][C]2.9127[/C][C]0.0025[/C][/ROW]
[ROW][C]3[/C][C]0.488755[/C][C]3.8173[/C][C]0.000159[/C][/ROW]
[ROW][C]4[/C][C]0.447141[/C][C]3.4923[/C][C]0.000449[/C][/ROW]
[ROW][C]5[/C][C]0.323577[/C][C]2.5272[/C][C]0.007053[/C][/ROW]
[ROW][C]6[/C][C]0.315124[/C][C]2.4612[/C][C]0.008346[/C][/ROW]
[ROW][C]7[/C][C]0.135554[/C][C]1.0587[/C][C]0.146953[/C][/ROW]
[ROW][C]8[/C][C]0.169324[/C][C]1.3225[/C][C]0.095476[/C][/ROW]
[ROW][C]9[/C][C]0.001558[/C][C]0.0122[/C][C]0.495166[/C][/ROW]
[ROW][C]10[/C][C]-0.176926[/C][C]-1.3818[/C][C]0.086031[/C][/ROW]
[ROW][C]11[/C][C]-0.050195[/C][C]-0.392[/C][C]0.3482[/C][/ROW]
[ROW][C]12[/C][C]0.156898[/C][C]1.2254[/C][C]0.112565[/C][/ROW]
[ROW][C]13[/C][C]-0.154233[/C][C]-1.2046[/C][C]0.116506[/C][/ROW]
[ROW][C]14[/C][C]-0.278992[/C][C]-2.179[/C][C]0.016602[/C][/ROW]
[ROW][C]15[/C][C]-0.187949[/C][C]-1.4679[/C][C]0.07363[/C][/ROW]
[ROW][C]16[/C][C]-0.115343[/C][C]-0.9009[/C][C]0.185604[/C][/ROW]
[ROW][C]17[/C][C]-0.171571[/C][C]-1.34[/C][C]0.092605[/C][/ROW]
[ROW][C]18[/C][C]-0.169083[/C][C]-1.3206[/C][C]0.095787[/C][/ROW]
[ROW][C]19[/C][C]-0.159653[/C][C]-1.2469[/C][C]0.108594[/C][/ROW]
[ROW][C]20[/C][C]-0.15249[/C][C]-1.191[/C][C]0.119137[/C][/ROW]
[ROW][C]21[/C][C]-0.262218[/C][C]-2.048[/C][C]0.022436[/C][/ROW]
[ROW][C]22[/C][C]-0.25291[/C][C]-1.9753[/C][C]0.026382[/C][/ROW]
[ROW][C]23[/C][C]-0.150304[/C][C]-1.1739[/C][C]0.122497[/C][/ROW]
[ROW][C]24[/C][C]-0.040114[/C][C]-0.3133[/C][C]0.37756[/C][/ROW]
[ROW][C]25[/C][C]-0.14065[/C][C]-1.0985[/C][C]0.138149[/C][/ROW]
[ROW][C]26[/C][C]-0.293112[/C][C]-2.2893[/C][C]0.012769[/C][/ROW]
[ROW][C]27[/C][C]-0.174693[/C][C]-1.3644[/C][C]0.088728[/C][/ROW]
[ROW][C]28[/C][C]-0.059141[/C][C]-0.4619[/C][C]0.322896[/C][/ROW]
[ROW][C]29[/C][C]-0.173465[/C][C]-1.3548[/C][C]0.090238[/C][/ROW]
[ROW][C]30[/C][C]-0.130816[/C][C]-1.0217[/C][C]0.155477[/C][/ROW]
[ROW][C]31[/C][C]-0.092638[/C][C]-0.7235[/C][C]0.236061[/C][/ROW]
[ROW][C]32[/C][C]-0.175245[/C][C]-1.3687[/C][C]0.088055[/C][/ROW]
[ROW][C]33[/C][C]-0.209021[/C][C]-1.6325[/C][C]0.053863[/C][/ROW]
[ROW][C]34[/C][C]-0.163262[/C][C]-1.2751[/C][C]0.103552[/C][/ROW]
[ROW][C]35[/C][C]-0.154724[/C][C]-1.2084[/C][C]0.115772[/C][/ROW]
[ROW][C]36[/C][C]-0.05014[/C][C]-0.3916[/C][C]0.348356[/C][/ROW]
[ROW][C]37[/C][C]-0.098119[/C][C]-0.7663[/C][C]0.223218[/C][/ROW]
[ROW][C]38[/C][C]-0.208324[/C][C]-1.6271[/C][C]0.054439[/C][/ROW]
[ROW][C]39[/C][C]-0.076058[/C][C]-0.594[/C][C]0.277344[/C][/ROW]
[ROW][C]40[/C][C]-0.010149[/C][C]-0.0793[/C][C]0.46854[/C][/ROW]
[ROW][C]41[/C][C]-0.055516[/C][C]-0.4336[/C][C]0.333056[/C][/ROW]
[ROW][C]42[/C][C]0.043439[/C][C]0.3393[/C][C]0.367786[/C][/ROW]
[ROW][C]43[/C][C]0.048265[/C][C]0.377[/C][C]0.353756[/C][/ROW]
[ROW][C]44[/C][C]0.003445[/C][C]0.0269[/C][C]0.48931[/C][/ROW]
[ROW][C]45[/C][C]0.060318[/C][C]0.4711[/C][C]0.319626[/C][/ROW]
[ROW][C]46[/C][C]0.082069[/C][C]0.641[/C][C]0.26197[/C][/ROW]
[ROW][C]47[/C][C]0.101844[/C][C]0.7954[/C][C]0.214724[/C][/ROW]
[ROW][C]48[/C][C]0.159347[/C][C]1.2445[/C][C]0.10903[/C][/ROW]
[ROW][C]49[/C][C]0.100407[/C][C]0.7842[/C][C]0.217977[/C][/ROW]
[ROW][C]50[/C][C]0.059475[/C][C]0.4645[/C][C]0.321966[/C][/ROW]
[ROW][C]51[/C][C]0.103516[/C][C]0.8085[/C][C]0.210976[/C][/ROW]
[ROW][C]52[/C][C]0.07568[/C][C]0.5911[/C][C]0.278326[/C][/ROW]
[ROW][C]53[/C][C]0.062566[/C][C]0.4887[/C][C]0.313418[/C][/ROW]
[ROW][C]54[/C][C]0.078362[/C][C]0.612[/C][C]0.271398[/C][/ROW]
[ROW][C]55[/C][C]0.057451[/C][C]0.4487[/C][C]0.327617[/C][/ROW]
[ROW][C]56[/C][C]0.026965[/C][C]0.2106[/C][C]0.41695[/C][/ROW]
[ROW][C]57[/C][C]0.020191[/C][C]0.1577[/C][C]0.437607[/C][/ROW]
[ROW][C]58[/C][C]0.01516[/C][C]0.1184[/C][C]0.45307[/C][/ROW]
[ROW][C]59[/C][C]0.025648[/C][C]0.2003[/C][C]0.42095[/C][/ROW]
[ROW][C]60[/C][C]0.018269[/C][C]0.1427[/C][C]0.443504[/C][/ROW]
[/TABLE]
Source: https://freestatistics.org/blog/index.php?pk=111943&T=1

Globally Unique Identifier (entire table): ba.freestatistics.org/blog/index.php?pk=111943&T=1

As an alternative you can also use a QR Code:  

The GUIDs for individual cells are displayed in the table below:

Autocorrelation Function
Time lag kACF(k)T-STATP-value
10.5337734.16894.9e-05
20.3729342.91270.0025
30.4887553.81730.000159
40.4471413.49230.000449
50.3235772.52720.007053
60.3151242.46120.008346
70.1355541.05870.146953
80.1693241.32250.095476
90.0015580.01220.495166
10-0.176926-1.38180.086031
11-0.050195-0.3920.3482
120.1568981.22540.112565
13-0.154233-1.20460.116506
14-0.278992-2.1790.016602
15-0.187949-1.46790.07363
16-0.115343-0.90090.185604
17-0.171571-1.340.092605
18-0.169083-1.32060.095787
19-0.159653-1.24690.108594
20-0.15249-1.1910.119137
21-0.262218-2.0480.022436
22-0.25291-1.97530.026382
23-0.150304-1.17390.122497
24-0.040114-0.31330.37756
25-0.14065-1.09850.138149
26-0.293112-2.28930.012769
27-0.174693-1.36440.088728
28-0.059141-0.46190.322896
29-0.173465-1.35480.090238
30-0.130816-1.02170.155477
31-0.092638-0.72350.236061
32-0.175245-1.36870.088055
33-0.209021-1.63250.053863
34-0.163262-1.27510.103552
35-0.154724-1.20840.115772
36-0.05014-0.39160.348356
37-0.098119-0.76630.223218
38-0.208324-1.62710.054439
39-0.076058-0.5940.277344
40-0.010149-0.07930.46854
41-0.055516-0.43360.333056
420.0434390.33930.367786
430.0482650.3770.353756
440.0034450.02690.48931
450.0603180.47110.319626
460.0820690.6410.26197
470.1018440.79540.214724
480.1593471.24450.10903
490.1004070.78420.217977
500.0594750.46450.321966
510.1035160.80850.210976
520.075680.59110.278326
530.0625660.48870.313418
540.0783620.6120.271398
550.0574510.44870.327617
560.0269650.21060.41695
570.0201910.15770.437607
580.015160.11840.45307
590.0256480.20030.42095
600.0182690.14270.443504


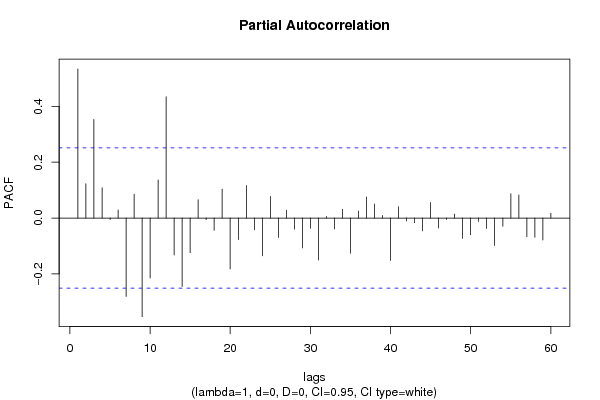
Partial Autocorrelation Function
Time lag kPACF(k)T-STATP-value
10.5337734.16894.9e-05
20.123090.96140.170082
30.3528482.75580.003854
40.1085750.8480.199877
5-0.00523-0.04090.483774
60.0290580.2270.41061
7-0.280527-2.1910.016141
80.0849770.66370.254694
9-0.353056-2.75750.003837
10-0.214478-1.67510.049514
110.1365051.06610.145281
120.434113.39050.000614
13-0.132738-1.03670.151979
14-0.245381-1.91650.029996
15-0.123848-0.96730.168611
160.0656220.51250.305068
17-0.005908-0.04610.481673
18-0.04382-0.34220.366672
190.1030210.80460.212082
20-0.182097-1.42220.080027
21-0.076786-0.59970.275459
220.116490.90980.183251
23-0.041956-0.32770.372135
24-0.134935-1.05390.148049
250.0774240.60470.27381
26-0.069755-0.54480.293937
270.0277010.21640.414717
28-0.03976-0.31050.378606
29-0.10697-0.83550.203359
30-0.036662-0.28630.387794
31-0.150054-1.1720.122885
320.0057130.04460.482278
33-0.039138-0.30570.380445
340.0312730.24430.403928
35-0.126096-0.98480.164296
360.0252350.19710.422207
370.0752390.58760.279473
380.0498220.38910.34927
390.0088980.06950.472411
40-0.151704-1.18480.120337
410.0405610.31680.376243
42-0.010248-0.080.468235
43-0.016963-0.13250.447518
44-0.046037-0.35960.360209
450.0557990.43580.332259
46-0.035985-0.28110.38981
47-0.005266-0.04110.483664
480.0141610.11060.456147
49-0.072858-0.5690.285708
50-0.060275-0.47080.319746
51-0.012273-0.09590.461973
52-0.037042-0.28930.386665
53-0.098112-0.76630.223233
54-0.029811-0.23280.408336
550.086860.67840.250042
560.0822530.64240.261506
57-0.066788-0.52160.301909
58-0.069038-0.53920.295855
59-0.07863-0.61410.27071
600.0169410.13230.447585

\begin{tabular}{lllllllll}
\hline
Partial Autocorrelation Function \tabularnewline
Time lag k & PACF(k) & T-STAT & P-value \tabularnewline
1 & 0.533773 & 4.1689 & 4.9e-05 \tabularnewline
2 & 0.12309 & 0.9614 & 0.170082 \tabularnewline
3 & 0.352848 & 2.7558 & 0.003854 \tabularnewline
4 & 0.108575 & 0.848 & 0.199877 \tabularnewline
5 & -0.00523 & -0.0409 & 0.483774 \tabularnewline
6 & 0.029058 & 0.227 & 0.41061 \tabularnewline
7 & -0.280527 & -2.191 & 0.016141 \tabularnewline
8 & 0.084977 & 0.6637 & 0.254694 \tabularnewline
9 & -0.353056 & -2.7575 & 0.003837 \tabularnewline
10 & -0.214478 & -1.6751 & 0.049514 \tabularnewline
11 & 0.136505 & 1.0661 & 0.145281 \tabularnewline
12 & 0.43411 & 3.3905 & 0.000614 \tabularnewline
13 & -0.132738 & -1.0367 & 0.151979 \tabularnewline
14 & -0.245381 & -1.9165 & 0.029996 \tabularnewline
15 & -0.123848 & -0.9673 & 0.168611 \tabularnewline
16 & 0.065622 & 0.5125 & 0.305068 \tabularnewline
17 & -0.005908 & -0.0461 & 0.481673 \tabularnewline
18 & -0.04382 & -0.3422 & 0.366672 \tabularnewline
19 & 0.103021 & 0.8046 & 0.212082 \tabularnewline
20 & -0.182097 & -1.4222 & 0.080027 \tabularnewline
21 & -0.076786 & -0.5997 & 0.275459 \tabularnewline
22 & 0.11649 & 0.9098 & 0.183251 \tabularnewline
23 & -0.041956 & -0.3277 & 0.372135 \tabularnewline
24 & -0.134935 & -1.0539 & 0.148049 \tabularnewline
25 & 0.077424 & 0.6047 & 0.27381 \tabularnewline
26 & -0.069755 & -0.5448 & 0.293937 \tabularnewline
27 & 0.027701 & 0.2164 & 0.414717 \tabularnewline
28 & -0.03976 & -0.3105 & 0.378606 \tabularnewline
29 & -0.10697 & -0.8355 & 0.203359 \tabularnewline
30 & -0.036662 & -0.2863 & 0.387794 \tabularnewline
31 & -0.150054 & -1.172 & 0.122885 \tabularnewline
32 & 0.005713 & 0.0446 & 0.482278 \tabularnewline
33 & -0.039138 & -0.3057 & 0.380445 \tabularnewline
34 & 0.031273 & 0.2443 & 0.403928 \tabularnewline
35 & -0.126096 & -0.9848 & 0.164296 \tabularnewline
36 & 0.025235 & 0.1971 & 0.422207 \tabularnewline
37 & 0.075239 & 0.5876 & 0.279473 \tabularnewline
38 & 0.049822 & 0.3891 & 0.34927 \tabularnewline
39 & 0.008898 & 0.0695 & 0.472411 \tabularnewline
40 & -0.151704 & -1.1848 & 0.120337 \tabularnewline
41 & 0.040561 & 0.3168 & 0.376243 \tabularnewline
42 & -0.010248 & -0.08 & 0.468235 \tabularnewline
43 & -0.016963 & -0.1325 & 0.447518 \tabularnewline
44 & -0.046037 & -0.3596 & 0.360209 \tabularnewline
45 & 0.055799 & 0.4358 & 0.332259 \tabularnewline
46 & -0.035985 & -0.2811 & 0.38981 \tabularnewline
47 & -0.005266 & -0.0411 & 0.483664 \tabularnewline
48 & 0.014161 & 0.1106 & 0.456147 \tabularnewline
49 & -0.072858 & -0.569 & 0.285708 \tabularnewline
50 & -0.060275 & -0.4708 & 0.319746 \tabularnewline
51 & -0.012273 & -0.0959 & 0.461973 \tabularnewline
52 & -0.037042 & -0.2893 & 0.386665 \tabularnewline
53 & -0.098112 & -0.7663 & 0.223233 \tabularnewline
54 & -0.029811 & -0.2328 & 0.408336 \tabularnewline
55 & 0.08686 & 0.6784 & 0.250042 \tabularnewline
56 & 0.082253 & 0.6424 & 0.261506 \tabularnewline
57 & -0.066788 & -0.5216 & 0.301909 \tabularnewline
58 & -0.069038 & -0.5392 & 0.295855 \tabularnewline
59 & -0.07863 & -0.6141 & 0.27071 \tabularnewline
60 & 0.016941 & 0.1323 & 0.447585 \tabularnewline
\hline
\end{tabular}
%Source: https://freestatistics.org/blog/index.php?pk=111943&T=2

[TABLE]
[ROW][C]Partial Autocorrelation Function[/C][/ROW]
[ROW][C]Time lag k[/C][C]PACF(k)[/C][C]T-STAT[/C][C]P-value[/C][/ROW]
[ROW][C]1[/C][C]0.533773[/C][C]4.1689[/C][C]4.9e-05[/C][/ROW]
[ROW][C]2[/C][C]0.12309[/C][C]0.9614[/C][C]0.170082[/C][/ROW]
[ROW][C]3[/C][C]0.352848[/C][C]2.7558[/C][C]0.003854[/C][/ROW]
[ROW][C]4[/C][C]0.108575[/C][C]0.848[/C][C]0.199877[/C][/ROW]
[ROW][C]5[/C][C]-0.00523[/C][C]-0.0409[/C][C]0.483774[/C][/ROW]
[ROW][C]6[/C][C]0.029058[/C][C]0.227[/C][C]0.41061[/C][/ROW]
[ROW][C]7[/C][C]-0.280527[/C][C]-2.191[/C][C]0.016141[/C][/ROW]
[ROW][C]8[/C][C]0.084977[/C][C]0.6637[/C][C]0.254694[/C][/ROW]
[ROW][C]9[/C][C]-0.353056[/C][C]-2.7575[/C][C]0.003837[/C][/ROW]
[ROW][C]10[/C][C]-0.214478[/C][C]-1.6751[/C][C]0.049514[/C][/ROW]
[ROW][C]11[/C][C]0.136505[/C][C]1.0661[/C][C]0.145281[/C][/ROW]
[ROW][C]12[/C][C]0.43411[/C][C]3.3905[/C][C]0.000614[/C][/ROW]
[ROW][C]13[/C][C]-0.132738[/C][C]-1.0367[/C][C]0.151979[/C][/ROW]
[ROW][C]14[/C][C]-0.245381[/C][C]-1.9165[/C][C]0.029996[/C][/ROW]
[ROW][C]15[/C][C]-0.123848[/C][C]-0.9673[/C][C]0.168611[/C][/ROW]
[ROW][C]16[/C][C]0.065622[/C][C]0.5125[/C][C]0.305068[/C][/ROW]
[ROW][C]17[/C][C]-0.005908[/C][C]-0.0461[/C][C]0.481673[/C][/ROW]
[ROW][C]18[/C][C]-0.04382[/C][C]-0.3422[/C][C]0.366672[/C][/ROW]
[ROW][C]19[/C][C]0.103021[/C][C]0.8046[/C][C]0.212082[/C][/ROW]
[ROW][C]20[/C][C]-0.182097[/C][C]-1.4222[/C][C]0.080027[/C][/ROW]
[ROW][C]21[/C][C]-0.076786[/C][C]-0.5997[/C][C]0.275459[/C][/ROW]
[ROW][C]22[/C][C]0.11649[/C][C]0.9098[/C][C]0.183251[/C][/ROW]
[ROW][C]23[/C][C]-0.041956[/C][C]-0.3277[/C][C]0.372135[/C][/ROW]
[ROW][C]24[/C][C]-0.134935[/C][C]-1.0539[/C][C]0.148049[/C][/ROW]
[ROW][C]25[/C][C]0.077424[/C][C]0.6047[/C][C]0.27381[/C][/ROW]
[ROW][C]26[/C][C]-0.069755[/C][C]-0.5448[/C][C]0.293937[/C][/ROW]
[ROW][C]27[/C][C]0.027701[/C][C]0.2164[/C][C]0.414717[/C][/ROW]
[ROW][C]28[/C][C]-0.03976[/C][C]-0.3105[/C][C]0.378606[/C][/ROW]
[ROW][C]29[/C][C]-0.10697[/C][C]-0.8355[/C][C]0.203359[/C][/ROW]
[ROW][C]30[/C][C]-0.036662[/C][C]-0.2863[/C][C]0.387794[/C][/ROW]
[ROW][C]31[/C][C]-0.150054[/C][C]-1.172[/C][C]0.122885[/C][/ROW]
[ROW][C]32[/C][C]0.005713[/C][C]0.0446[/C][C]0.482278[/C][/ROW]
[ROW][C]33[/C][C]-0.039138[/C][C]-0.3057[/C][C]0.380445[/C][/ROW]
[ROW][C]34[/C][C]0.031273[/C][C]0.2443[/C][C]0.403928[/C][/ROW]
[ROW][C]35[/C][C]-0.126096[/C][C]-0.9848[/C][C]0.164296[/C][/ROW]
[ROW][C]36[/C][C]0.025235[/C][C]0.1971[/C][C]0.422207[/C][/ROW]
[ROW][C]37[/C][C]0.075239[/C][C]0.5876[/C][C]0.279473[/C][/ROW]
[ROW][C]38[/C][C]0.049822[/C][C]0.3891[/C][C]0.34927[/C][/ROW]
[ROW][C]39[/C][C]0.008898[/C][C]0.0695[/C][C]0.472411[/C][/ROW]
[ROW][C]40[/C][C]-0.151704[/C][C]-1.1848[/C][C]0.120337[/C][/ROW]
[ROW][C]41[/C][C]0.040561[/C][C]0.3168[/C][C]0.376243[/C][/ROW]
[ROW][C]42[/C][C]-0.010248[/C][C]-0.08[/C][C]0.468235[/C][/ROW]
[ROW][C]43[/C][C]-0.016963[/C][C]-0.1325[/C][C]0.447518[/C][/ROW]
[ROW][C]44[/C][C]-0.046037[/C][C]-0.3596[/C][C]0.360209[/C][/ROW]
[ROW][C]45[/C][C]0.055799[/C][C]0.4358[/C][C]0.332259[/C][/ROW]
[ROW][C]46[/C][C]-0.035985[/C][C]-0.2811[/C][C]0.38981[/C][/ROW]
[ROW][C]47[/C][C]-0.005266[/C][C]-0.0411[/C][C]0.483664[/C][/ROW]
[ROW][C]48[/C][C]0.014161[/C][C]0.1106[/C][C]0.456147[/C][/ROW]
[ROW][C]49[/C][C]-0.072858[/C][C]-0.569[/C][C]0.285708[/C][/ROW]
[ROW][C]50[/C][C]-0.060275[/C][C]-0.4708[/C][C]0.319746[/C][/ROW]
[ROW][C]51[/C][C]-0.012273[/C][C]-0.0959[/C][C]0.461973[/C][/ROW]
[ROW][C]52[/C][C]-0.037042[/C][C]-0.2893[/C][C]0.386665[/C][/ROW]
[ROW][C]53[/C][C]-0.098112[/C][C]-0.7663[/C][C]0.223233[/C][/ROW]
[ROW][C]54[/C][C]-0.029811[/C][C]-0.2328[/C][C]0.408336[/C][/ROW]
[ROW][C]55[/C][C]0.08686[/C][C]0.6784[/C][C]0.250042[/C][/ROW]
[ROW][C]56[/C][C]0.082253[/C][C]0.6424[/C][C]0.261506[/C][/ROW]
[ROW][C]57[/C][C]-0.066788[/C][C]-0.5216[/C][C]0.301909[/C][/ROW]
[ROW][C]58[/C][C]-0.069038[/C][C]-0.5392[/C][C]0.295855[/C][/ROW]
[ROW][C]59[/C][C]-0.07863[/C][C]-0.6141[/C][C]0.27071[/C][/ROW]
[ROW][C]60[/C][C]0.016941[/C][C]0.1323[/C][C]0.447585[/C][/ROW]
[/TABLE]
Source: https://freestatistics.org/blog/index.php?pk=111943&T=2

Globally Unique Identifier (entire table): ba.freestatistics.org/blog/index.php?pk=111943&T=2

As an alternative you can also use a QR Code:  

The GUIDs for individual cells are displayed in the table below:

Partial Autocorrelation Function
Time lag kPACF(k)T-STATP-value
10.5337734.16894.9e-05
20.123090.96140.170082
30.3528482.75580.003854
40.1085750.8480.199877
5-0.00523-0.04090.483774
60.0290580.2270.41061
7-0.280527-2.1910.016141
80.0849770.66370.254694
9-0.353056-2.75750.003837
10-0.214478-1.67510.049514
110.1365051.06610.145281
120.434113.39050.000614
13-0.132738-1.03670.151979
14-0.245381-1.91650.029996
15-0.123848-0.96730.168611
160.0656220.51250.305068
17-0.005908-0.04610.481673
18-0.04382-0.34220.366672
190.1030210.80460.212082
20-0.182097-1.42220.080027
21-0.076786-0.59970.275459
220.116490.90980.183251
23-0.041956-0.32770.372135
24-0.134935-1.05390.148049
250.0774240.60470.27381
26-0.069755-0.54480.293937
270.0277010.21640.414717
28-0.03976-0.31050.378606
29-0.10697-0.83550.203359
30-0.036662-0.28630.387794
31-0.150054-1.1720.122885
320.0057130.04460.482278
33-0.039138-0.30570.380445
340.0312730.24430.403928
35-0.126096-0.98480.164296
360.0252350.19710.422207
370.0752390.58760.279473
380.0498220.38910.34927
390.0088980.06950.472411
40-0.151704-1.18480.120337
410.0405610.31680.376243
42-0.010248-0.080.468235
43-0.016963-0.13250.447518
44-0.046037-0.35960.360209
450.0557990.43580.332259
46-0.035985-0.28110.38981
47-0.005266-0.04110.483664
480.0141610.11060.456147
49-0.072858-0.5690.285708
50-0.060275-0.47080.319746
51-0.012273-0.09590.461973
52-0.037042-0.28930.386665
53-0.098112-0.76630.223233
54-0.029811-0.23280.408336
550.086860.67840.250042
560.0822530.64240.261506
57-0.066788-0.52160.301909
58-0.069038-0.53920.295855
59-0.07863-0.61410.27071
600.0169410.13230.447585


Parameters (Session):
par1 = 60 ; par2 = 1 ; par3 = 0 ; par4 = 0 ; par5 = 12 ; par6 = White Noise ; par7 = 0.95 ;
Parameters (R input):
par1 = 60 ; par2 = 1 ; par3 = 0 ; par4 = 0 ; par5 = 12 ; par6 = White Noise ; par7 = 0.95 ; par8 = ;
R code (references can be found in the software module):
if (par1 == 'Default') {
par1 = 10*log10(length(x))
} else {
par1 <- as.numeric(par1)
}
par2 <- as.numeric(par2)
par3 <- as.numeric(par3)
par4 <- as.numeric(par4)
par5 <- as.numeric(par5)
if (par6 == 'White Noise') par6 <- 'white' else par6 <- 'ma'
par7 <- as.numeric(par7)
if (par8 != '') par8 <- as.numeric(par8)
ox <- x
if (par8 == '') {
if (par2 == 0) {
x <- log(x)
} else {
x <- (x ^ par2 - 1) / par2
}
} else {
x <- log(x,base=par8)
}
if (par3 > 0) x <- diff(x,lag=1,difference=par3)
if (par4 > 0) x <- diff(x,lag=par5,difference=par4)
bitmap(file='picts.png')
op <- par(mfrow=c(2,1))
plot(ox,type='l',main='Original Time Series',xlab='time',ylab='value')
if (par8=='') {
mytitle <- paste('Working Time Series (lambda=',par2,', d=',par3,', D=',par4,')',sep='')
mysub <- paste('(lambda=',par2,', d=',par3,', D=',par4,', CI=', par7, ', CI type=',par6,')',sep='')
} else {
mytitle <- paste('Working Time Series (base=',par8,', d=',par3,', D=',par4,')',sep='')
mysub <- paste('(base=',par8,', d=',par3,', D=',par4,', CI=', par7, ', CI type=',par6,')',sep='')
}
plot(x,type='l', main=mytitle,xlab='time',ylab='value')
par(op)
dev.off()
bitmap(file='pic1.png')
racf <- acf(x, par1, main='Autocorrelation', xlab='time lag', ylab='ACF', ci.type=par6, ci=par7, sub=mysub)
dev.off()
bitmap(file='pic2.png')
rpacf <- pacf(x,par1,main='Partial Autocorrelation',xlab='lags',ylab='PACF',sub=mysub)
dev.off()
(myacf <- c(racf$acf))
(mypacf <- c(rpacf$acf))
lengthx <- length(x)
sqrtn <- sqrt(lengthx)
load(file='createtable')
a<-table.start()
a<-table.row.start(a)
a<-table.element(a,'Autocorrelation Function',4,TRUE)
a<-table.row.end(a)
a<-table.row.start(a)
a<-table.element(a,'Time lag k',header=TRUE)
a<-table.element(a,hyperlink('basics.htm','ACF(k)','click here for more information about the Autocorrelation Function'),header=TRUE)
a<-table.element(a,'T-STAT',header=TRUE)
a<-table.element(a,'P-value',header=TRUE)
a<-table.row.end(a)
for (i in 2:(par1+1)) {
a<-table.row.start(a)
a<-table.element(a,i-1,header=TRUE)
a<-table.element(a,round(myacf[i],6))
mytstat <- myacf[i]*sqrtn
a<-table.element(a,round(mytstat,4))
a<-table.element(a,round(1-pt(abs(mytstat),lengthx),6))
a<-table.row.end(a)
}
a<-table.end(a)
table.save(a,file='mytable.tab')
a<-table.start()
a<-table.row.start(a)
a<-table.element(a,'Partial Autocorrelation Function',4,TRUE)
a<-table.row.end(a)
a<-table.row.start(a)
a<-table.element(a,'Time lag k',header=TRUE)
a<-table.element(a,hyperlink('basics.htm','PACF(k)','click here for more information about the Partial Autocorrelation Function'),header=TRUE)
a<-table.element(a,'T-STAT',header=TRUE)
a<-table.element(a,'P-value',header=TRUE)
a<-table.row.end(a)
for (i in 1:par1) {
a<-table.row.start(a)
a<-table.element(a,i,header=TRUE)
a<-table.element(a,round(mypacf[i],6))
mytstat <- mypacf[i]*sqrtn
a<-table.element(a,round(mytstat,4))
a<-table.element(a,round(1-pt(abs(mytstat),lengthx),6))
a<-table.row.end(a)
}
a<-table.end(a)
table.save(a,file='mytable1.tab')