Free Statistics

of Irreproducible Research!

Author's title

Author*The author of this computation has been verified*
R Software Modulerwasp_exponentialsmoothing.wasp
Title produced by softwareExponential Smoothing
Date of computationSat, 18 Dec 2010 13:02:21 +0000
Cite this page as followsStatistical Computations at FreeStatistics.org, Office for Research Development and Education, URL https://freestatistics.org/blog/index.php?v=date/2010/Dec/18/t1292677201bm7q0w831oeztug.htm/, Retrieved Tue, 30 Apr 2024 05:24:59 +0000
Statistical Computations at FreeStatistics.org, Office for Research Development and Education, URL https://freestatistics.org/blog/index.php?pk=111932, Retrieved Tue, 30 Apr 2024 05:24:59 +0000
QR Codes:

Original text written by user:
IsPrivate?No (this computation is public)
User-defined keywords
Estimated Impact122
Family? (F = Feedback message, R = changed R code, M = changed R Module, P = changed Parameters, D = changed Data)
-       [Exponential Smoothing] [Exponential smoot...] [2010-12-18 13:02:21] [aedc5b8e4f26bdca34b1a0cf88d6dfa2] [Current]
Feedback Forum

Post a new message
Dataseries X:
37
30
47
35
30
43
82
40
47
19
52
136
80
42
54
66
81
63
137
72
107
58
36
52
79
77
54
84
48
96
83
66
61
53
30
74
69
59
42
65
70
100
63
105
82
81
75
102
121
98
76
77
63
37
35
23
40
29
37
51
20
28
13
22
25
13
16
13
16
17
9
17
25
14
8
7
10
7
10
3


Summary of computational transaction
Raw Inputview raw input (R code)
Raw Outputview raw output of R engine
Computing time2 seconds
R Server'Sir Ronald Aylmer Fisher' @ 193.190.124.24

\begin{tabular}{lllllllll}
\hline
Summary of computational transaction \tabularnewline
Raw Input & view raw input (R code)  \tabularnewline
Raw Output & view raw output of R engine  \tabularnewline
Computing time & 2 seconds \tabularnewline
R Server & 'Sir Ronald Aylmer Fisher' @ 193.190.124.24 \tabularnewline
\hline
\end{tabular}
%Source: https://freestatistics.org/blog/index.php?pk=111932&T=0

[TABLE]
[ROW][C]Summary of computational transaction[/C][/ROW]
[ROW][C]Raw Input[/C][C]view raw input (R code) [/C][/ROW]
[ROW][C]Raw Output[/C][C]view raw output of R engine [/C][/ROW]
[ROW][C]Computing time[/C][C]2 seconds[/C][/ROW]
[ROW][C]R Server[/C][C]'Sir Ronald Aylmer Fisher' @ 193.190.124.24[/C][/ROW]
[/TABLE]
Source: https://freestatistics.org/blog/index.php?pk=111932&T=0

Globally Unique Identifier (entire table): ba.freestatistics.org/blog/index.php?pk=111932&T=0

As an alternative you can also use a QR Code:  

The GUIDs for individual cells are displayed in the table below:

Summary of computational transaction
Raw Inputview raw input (R code)
Raw Outputview raw output of R engine
Computing time2 seconds
R Server'Sir Ronald Aylmer Fisher' @ 193.190.124.24


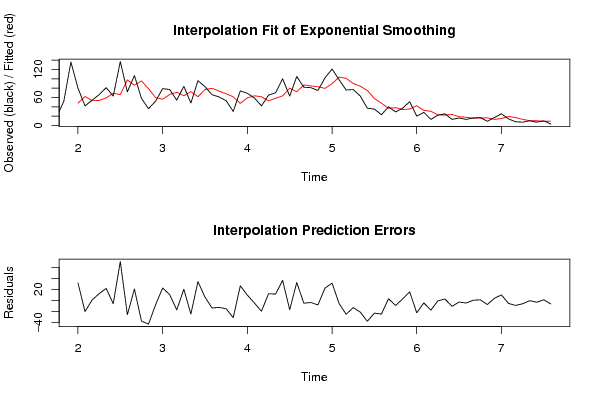
Estimated Parameters of Exponential Smoothing
ParameterValue
alpha0.445417135362361
beta0
gamma0

\begin{tabular}{lllllllll}
\hline
Estimated Parameters of Exponential Smoothing \tabularnewline
Parameter & Value \tabularnewline
alpha & 0.445417135362361 \tabularnewline
beta & 0 \tabularnewline
gamma & 0 \tabularnewline
\hline
\end{tabular}
%Source: https://freestatistics.org/blog/index.php?pk=111932&T=1

[TABLE]
[ROW][C]Estimated Parameters of Exponential Smoothing[/C][/ROW]
[ROW][C]Parameter[/C][C]Value[/C][/ROW]
[ROW][C]alpha[/C][C]0.445417135362361[/C][/ROW]
[ROW][C]beta[/C][C]0[/C][/ROW]
[ROW][C]gamma[/C][C]0[/C][/ROW]
[/TABLE]
Source: https://freestatistics.org/blog/index.php?pk=111932&T=1

Globally Unique Identifier (entire table): ba.freestatistics.org/blog/index.php?pk=111932&T=1

As an alternative you can also use a QR Code:  

The GUIDs for individual cells are displayed in the table below:

Estimated Parameters of Exponential Smoothing
ParameterValue
alpha0.445417135362361
beta0
gamma0


Interpolation Forecasts of Exponential Smoothing
tObservedFittedResiduals
138047.87532.125
144262.1840254735159-20.1840254735159
155453.19371466702150.806285332978497
166653.552847970321512.4471520296785
178159.097022770800721.9029772291993
186368.8529841441377-5.85298414413768
1913766.245964713334570.7540352866655
207297.7610244260485-25.7610244260485
2110786.286622722198220.7133772778018
225895.5127158929565-37.5127158929565
233678.8039094402537-42.8039094402537
245259.738314715066-7.73831471506595
257956.291536742148922.7084632578511
267766.406275394942410.5937246050576
275471.1249018613449-17.1249018613449
288463.497177130903120.5028228690969
294872.6294857600981-24.6294857600981
309661.659090767387234.3409092326128
318376.95512018351646.04487981648356
326679.6476132349843-13.6476132349843
336173.5687324433242-12.5687324433242
345367.9704036432827-14.9704036432827
353061.3023293372735-31.3023293372735
367447.359735473695926.6402645263041
376959.22576578429789.77423421570218
385963.5793771890167-4.57937718901666
394261.5396441197411-19.5396441197411
406552.83635180992612.1636481900740
417058.254249142304311.7457508576957
4210063.486007842019136.5139921579809
436379.7499656296707-16.7499656296707
4410572.289243921484832.7107560785152
458286.859175189514-4.85917518951398
468184.6948152963768-3.6948152963768
477583.0490812513716-8.04908125137162
4810279.463882538086822.5361174619132
4912189.501855420161931.4981445798381
5098103.531668748143-5.53166874814286
5176101.067768700572-25.0677687005716
527789.9021549760367-12.9021549760367
536384.1553140666092-21.1553140666092
543774.732374677369-37.7323746773691
553557.925728438156-22.9257284381560
562347.7142161511371-24.7142161511371
574036.70608079037143.29391920962857
582938.1732488488392-9.17324884883924
593734.08732662462322.91267337537681
605135.384681255729715.6153187442703
612042.3400117985728-22.3400117985728
622832.3893877392911-4.38938773929114
631330.4342792264614-17.4342792264614
642222.6687525163034-0.668752516303439
652522.37087868622522.62912131377481
661323.5419343703269-10.5419343703269
671618.8463761619179-2.84637616191787
681317.5785514457127-4.5785514457127
691615.53918617665410.46081382334585
701715.74444054978421.25555945021576
71916.3036882433765-7.30368824337648
721713.05050034843203.94949965156803
732514.809675169348010.1903248306520
741419.3486204638290-5.34862046382898
75816.9662532586898-8.96625325868977
76712.9725304172707-5.97253041727074
771010.3122630279454-0.312263027945436
78710.1731757245584-3.1731757245584
79108.759788883324211.24021111667579
8039.3122001661585-6.3122001661585

\begin{tabular}{lllllllll}
\hline
Interpolation Forecasts of Exponential Smoothing \tabularnewline
t & Observed & Fitted & Residuals \tabularnewline
13 & 80 & 47.875 & 32.125 \tabularnewline
14 & 42 & 62.1840254735159 & -20.1840254735159 \tabularnewline
15 & 54 & 53.1937146670215 & 0.806285332978497 \tabularnewline
16 & 66 & 53.5528479703215 & 12.4471520296785 \tabularnewline
17 & 81 & 59.0970227708007 & 21.9029772291993 \tabularnewline
18 & 63 & 68.8529841441377 & -5.85298414413768 \tabularnewline
19 & 137 & 66.2459647133345 & 70.7540352866655 \tabularnewline
20 & 72 & 97.7610244260485 & -25.7610244260485 \tabularnewline
21 & 107 & 86.2866227221982 & 20.7133772778018 \tabularnewline
22 & 58 & 95.5127158929565 & -37.5127158929565 \tabularnewline
23 & 36 & 78.8039094402537 & -42.8039094402537 \tabularnewline
24 & 52 & 59.738314715066 & -7.73831471506595 \tabularnewline
25 & 79 & 56.2915367421489 & 22.7084632578511 \tabularnewline
26 & 77 & 66.4062753949424 & 10.5937246050576 \tabularnewline
27 & 54 & 71.1249018613449 & -17.1249018613449 \tabularnewline
28 & 84 & 63.4971771309031 & 20.5028228690969 \tabularnewline
29 & 48 & 72.6294857600981 & -24.6294857600981 \tabularnewline
30 & 96 & 61.6590907673872 & 34.3409092326128 \tabularnewline
31 & 83 & 76.9551201835164 & 6.04487981648356 \tabularnewline
32 & 66 & 79.6476132349843 & -13.6476132349843 \tabularnewline
33 & 61 & 73.5687324433242 & -12.5687324433242 \tabularnewline
34 & 53 & 67.9704036432827 & -14.9704036432827 \tabularnewline
35 & 30 & 61.3023293372735 & -31.3023293372735 \tabularnewline
36 & 74 & 47.3597354736959 & 26.6402645263041 \tabularnewline
37 & 69 & 59.2257657842978 & 9.77423421570218 \tabularnewline
38 & 59 & 63.5793771890167 & -4.57937718901666 \tabularnewline
39 & 42 & 61.5396441197411 & -19.5396441197411 \tabularnewline
40 & 65 & 52.836351809926 & 12.1636481900740 \tabularnewline
41 & 70 & 58.2542491423043 & 11.7457508576957 \tabularnewline
42 & 100 & 63.4860078420191 & 36.5139921579809 \tabularnewline
43 & 63 & 79.7499656296707 & -16.7499656296707 \tabularnewline
44 & 105 & 72.2892439214848 & 32.7107560785152 \tabularnewline
45 & 82 & 86.859175189514 & -4.85917518951398 \tabularnewline
46 & 81 & 84.6948152963768 & -3.6948152963768 \tabularnewline
47 & 75 & 83.0490812513716 & -8.04908125137162 \tabularnewline
48 & 102 & 79.4638825380868 & 22.5361174619132 \tabularnewline
49 & 121 & 89.5018554201619 & 31.4981445798381 \tabularnewline
50 & 98 & 103.531668748143 & -5.53166874814286 \tabularnewline
51 & 76 & 101.067768700572 & -25.0677687005716 \tabularnewline
52 & 77 & 89.9021549760367 & -12.9021549760367 \tabularnewline
53 & 63 & 84.1553140666092 & -21.1553140666092 \tabularnewline
54 & 37 & 74.732374677369 & -37.7323746773691 \tabularnewline
55 & 35 & 57.925728438156 & -22.9257284381560 \tabularnewline
56 & 23 & 47.7142161511371 & -24.7142161511371 \tabularnewline
57 & 40 & 36.7060807903714 & 3.29391920962857 \tabularnewline
58 & 29 & 38.1732488488392 & -9.17324884883924 \tabularnewline
59 & 37 & 34.0873266246232 & 2.91267337537681 \tabularnewline
60 & 51 & 35.3846812557297 & 15.6153187442703 \tabularnewline
61 & 20 & 42.3400117985728 & -22.3400117985728 \tabularnewline
62 & 28 & 32.3893877392911 & -4.38938773929114 \tabularnewline
63 & 13 & 30.4342792264614 & -17.4342792264614 \tabularnewline
64 & 22 & 22.6687525163034 & -0.668752516303439 \tabularnewline
65 & 25 & 22.3708786862252 & 2.62912131377481 \tabularnewline
66 & 13 & 23.5419343703269 & -10.5419343703269 \tabularnewline
67 & 16 & 18.8463761619179 & -2.84637616191787 \tabularnewline
68 & 13 & 17.5785514457127 & -4.5785514457127 \tabularnewline
69 & 16 & 15.5391861766541 & 0.46081382334585 \tabularnewline
70 & 17 & 15.7444405497842 & 1.25555945021576 \tabularnewline
71 & 9 & 16.3036882433765 & -7.30368824337648 \tabularnewline
72 & 17 & 13.0505003484320 & 3.94949965156803 \tabularnewline
73 & 25 & 14.8096751693480 & 10.1903248306520 \tabularnewline
74 & 14 & 19.3486204638290 & -5.34862046382898 \tabularnewline
75 & 8 & 16.9662532586898 & -8.96625325868977 \tabularnewline
76 & 7 & 12.9725304172707 & -5.97253041727074 \tabularnewline
77 & 10 & 10.3122630279454 & -0.312263027945436 \tabularnewline
78 & 7 & 10.1731757245584 & -3.1731757245584 \tabularnewline
79 & 10 & 8.75978888332421 & 1.24021111667579 \tabularnewline
80 & 3 & 9.3122001661585 & -6.3122001661585 \tabularnewline
\hline
\end{tabular}
%Source: https://freestatistics.org/blog/index.php?pk=111932&T=2

[TABLE]
[ROW][C]Interpolation Forecasts of Exponential Smoothing[/C][/ROW]
[ROW][C]t[/C][C]Observed[/C][C]Fitted[/C][C]Residuals[/C][/ROW]
[ROW][C]13[/C][C]80[/C][C]47.875[/C][C]32.125[/C][/ROW]
[ROW][C]14[/C][C]42[/C][C]62.1840254735159[/C][C]-20.1840254735159[/C][/ROW]
[ROW][C]15[/C][C]54[/C][C]53.1937146670215[/C][C]0.806285332978497[/C][/ROW]
[ROW][C]16[/C][C]66[/C][C]53.5528479703215[/C][C]12.4471520296785[/C][/ROW]
[ROW][C]17[/C][C]81[/C][C]59.0970227708007[/C][C]21.9029772291993[/C][/ROW]
[ROW][C]18[/C][C]63[/C][C]68.8529841441377[/C][C]-5.85298414413768[/C][/ROW]
[ROW][C]19[/C][C]137[/C][C]66.2459647133345[/C][C]70.7540352866655[/C][/ROW]
[ROW][C]20[/C][C]72[/C][C]97.7610244260485[/C][C]-25.7610244260485[/C][/ROW]
[ROW][C]21[/C][C]107[/C][C]86.2866227221982[/C][C]20.7133772778018[/C][/ROW]
[ROW][C]22[/C][C]58[/C][C]95.5127158929565[/C][C]-37.5127158929565[/C][/ROW]
[ROW][C]23[/C][C]36[/C][C]78.8039094402537[/C][C]-42.8039094402537[/C][/ROW]
[ROW][C]24[/C][C]52[/C][C]59.738314715066[/C][C]-7.73831471506595[/C][/ROW]
[ROW][C]25[/C][C]79[/C][C]56.2915367421489[/C][C]22.7084632578511[/C][/ROW]
[ROW][C]26[/C][C]77[/C][C]66.4062753949424[/C][C]10.5937246050576[/C][/ROW]
[ROW][C]27[/C][C]54[/C][C]71.1249018613449[/C][C]-17.1249018613449[/C][/ROW]
[ROW][C]28[/C][C]84[/C][C]63.4971771309031[/C][C]20.5028228690969[/C][/ROW]
[ROW][C]29[/C][C]48[/C][C]72.6294857600981[/C][C]-24.6294857600981[/C][/ROW]
[ROW][C]30[/C][C]96[/C][C]61.6590907673872[/C][C]34.3409092326128[/C][/ROW]
[ROW][C]31[/C][C]83[/C][C]76.9551201835164[/C][C]6.04487981648356[/C][/ROW]
[ROW][C]32[/C][C]66[/C][C]79.6476132349843[/C][C]-13.6476132349843[/C][/ROW]
[ROW][C]33[/C][C]61[/C][C]73.5687324433242[/C][C]-12.5687324433242[/C][/ROW]
[ROW][C]34[/C][C]53[/C][C]67.9704036432827[/C][C]-14.9704036432827[/C][/ROW]
[ROW][C]35[/C][C]30[/C][C]61.3023293372735[/C][C]-31.3023293372735[/C][/ROW]
[ROW][C]36[/C][C]74[/C][C]47.3597354736959[/C][C]26.6402645263041[/C][/ROW]
[ROW][C]37[/C][C]69[/C][C]59.2257657842978[/C][C]9.77423421570218[/C][/ROW]
[ROW][C]38[/C][C]59[/C][C]63.5793771890167[/C][C]-4.57937718901666[/C][/ROW]
[ROW][C]39[/C][C]42[/C][C]61.5396441197411[/C][C]-19.5396441197411[/C][/ROW]
[ROW][C]40[/C][C]65[/C][C]52.836351809926[/C][C]12.1636481900740[/C][/ROW]
[ROW][C]41[/C][C]70[/C][C]58.2542491423043[/C][C]11.7457508576957[/C][/ROW]
[ROW][C]42[/C][C]100[/C][C]63.4860078420191[/C][C]36.5139921579809[/C][/ROW]
[ROW][C]43[/C][C]63[/C][C]79.7499656296707[/C][C]-16.7499656296707[/C][/ROW]
[ROW][C]44[/C][C]105[/C][C]72.2892439214848[/C][C]32.7107560785152[/C][/ROW]
[ROW][C]45[/C][C]82[/C][C]86.859175189514[/C][C]-4.85917518951398[/C][/ROW]
[ROW][C]46[/C][C]81[/C][C]84.6948152963768[/C][C]-3.6948152963768[/C][/ROW]
[ROW][C]47[/C][C]75[/C][C]83.0490812513716[/C][C]-8.04908125137162[/C][/ROW]
[ROW][C]48[/C][C]102[/C][C]79.4638825380868[/C][C]22.5361174619132[/C][/ROW]
[ROW][C]49[/C][C]121[/C][C]89.5018554201619[/C][C]31.4981445798381[/C][/ROW]
[ROW][C]50[/C][C]98[/C][C]103.531668748143[/C][C]-5.53166874814286[/C][/ROW]
[ROW][C]51[/C][C]76[/C][C]101.067768700572[/C][C]-25.0677687005716[/C][/ROW]
[ROW][C]52[/C][C]77[/C][C]89.9021549760367[/C][C]-12.9021549760367[/C][/ROW]
[ROW][C]53[/C][C]63[/C][C]84.1553140666092[/C][C]-21.1553140666092[/C][/ROW]
[ROW][C]54[/C][C]37[/C][C]74.732374677369[/C][C]-37.7323746773691[/C][/ROW]
[ROW][C]55[/C][C]35[/C][C]57.925728438156[/C][C]-22.9257284381560[/C][/ROW]
[ROW][C]56[/C][C]23[/C][C]47.7142161511371[/C][C]-24.7142161511371[/C][/ROW]
[ROW][C]57[/C][C]40[/C][C]36.7060807903714[/C][C]3.29391920962857[/C][/ROW]
[ROW][C]58[/C][C]29[/C][C]38.1732488488392[/C][C]-9.17324884883924[/C][/ROW]
[ROW][C]59[/C][C]37[/C][C]34.0873266246232[/C][C]2.91267337537681[/C][/ROW]
[ROW][C]60[/C][C]51[/C][C]35.3846812557297[/C][C]15.6153187442703[/C][/ROW]
[ROW][C]61[/C][C]20[/C][C]42.3400117985728[/C][C]-22.3400117985728[/C][/ROW]
[ROW][C]62[/C][C]28[/C][C]32.3893877392911[/C][C]-4.38938773929114[/C][/ROW]
[ROW][C]63[/C][C]13[/C][C]30.4342792264614[/C][C]-17.4342792264614[/C][/ROW]
[ROW][C]64[/C][C]22[/C][C]22.6687525163034[/C][C]-0.668752516303439[/C][/ROW]
[ROW][C]65[/C][C]25[/C][C]22.3708786862252[/C][C]2.62912131377481[/C][/ROW]
[ROW][C]66[/C][C]13[/C][C]23.5419343703269[/C][C]-10.5419343703269[/C][/ROW]
[ROW][C]67[/C][C]16[/C][C]18.8463761619179[/C][C]-2.84637616191787[/C][/ROW]
[ROW][C]68[/C][C]13[/C][C]17.5785514457127[/C][C]-4.5785514457127[/C][/ROW]
[ROW][C]69[/C][C]16[/C][C]15.5391861766541[/C][C]0.46081382334585[/C][/ROW]
[ROW][C]70[/C][C]17[/C][C]15.7444405497842[/C][C]1.25555945021576[/C][/ROW]
[ROW][C]71[/C][C]9[/C][C]16.3036882433765[/C][C]-7.30368824337648[/C][/ROW]
[ROW][C]72[/C][C]17[/C][C]13.0505003484320[/C][C]3.94949965156803[/C][/ROW]
[ROW][C]73[/C][C]25[/C][C]14.8096751693480[/C][C]10.1903248306520[/C][/ROW]
[ROW][C]74[/C][C]14[/C][C]19.3486204638290[/C][C]-5.34862046382898[/C][/ROW]
[ROW][C]75[/C][C]8[/C][C]16.9662532586898[/C][C]-8.96625325868977[/C][/ROW]
[ROW][C]76[/C][C]7[/C][C]12.9725304172707[/C][C]-5.97253041727074[/C][/ROW]
[ROW][C]77[/C][C]10[/C][C]10.3122630279454[/C][C]-0.312263027945436[/C][/ROW]
[ROW][C]78[/C][C]7[/C][C]10.1731757245584[/C][C]-3.1731757245584[/C][/ROW]
[ROW][C]79[/C][C]10[/C][C]8.75978888332421[/C][C]1.24021111667579[/C][/ROW]
[ROW][C]80[/C][C]3[/C][C]9.3122001661585[/C][C]-6.3122001661585[/C][/ROW]
[/TABLE]
Source: https://freestatistics.org/blog/index.php?pk=111932&T=2

Globally Unique Identifier (entire table): ba.freestatistics.org/blog/index.php?pk=111932&T=2

As an alternative you can also use a QR Code:  

The GUIDs for individual cells are displayed in the table below:

Interpolation Forecasts of Exponential Smoothing
tObservedFittedResiduals
138047.87532.125
144262.1840254735159-20.1840254735159
155453.19371466702150.806285332978497
166653.552847970321512.4471520296785
178159.097022770800721.9029772291993
186368.8529841441377-5.85298414413768
1913766.245964713334570.7540352866655
207297.7610244260485-25.7610244260485
2110786.286622722198220.7133772778018
225895.5127158929565-37.5127158929565
233678.8039094402537-42.8039094402537
245259.738314715066-7.73831471506595
257956.291536742148922.7084632578511
267766.406275394942410.5937246050576
275471.1249018613449-17.1249018613449
288463.497177130903120.5028228690969
294872.6294857600981-24.6294857600981
309661.659090767387234.3409092326128
318376.95512018351646.04487981648356
326679.6476132349843-13.6476132349843
336173.5687324433242-12.5687324433242
345367.9704036432827-14.9704036432827
353061.3023293372735-31.3023293372735
367447.359735473695926.6402645263041
376959.22576578429789.77423421570218
385963.5793771890167-4.57937718901666
394261.5396441197411-19.5396441197411
406552.83635180992612.1636481900740
417058.254249142304311.7457508576957
4210063.486007842019136.5139921579809
436379.7499656296707-16.7499656296707
4410572.289243921484832.7107560785152
458286.859175189514-4.85917518951398
468184.6948152963768-3.6948152963768
477583.0490812513716-8.04908125137162
4810279.463882538086822.5361174619132
4912189.501855420161931.4981445798381
5098103.531668748143-5.53166874814286
5176101.067768700572-25.0677687005716
527789.9021549760367-12.9021549760367
536384.1553140666092-21.1553140666092
543774.732374677369-37.7323746773691
553557.925728438156-22.9257284381560
562347.7142161511371-24.7142161511371
574036.70608079037143.29391920962857
582938.1732488488392-9.17324884883924
593734.08732662462322.91267337537681
605135.384681255729715.6153187442703
612042.3400117985728-22.3400117985728
622832.3893877392911-4.38938773929114
631330.4342792264614-17.4342792264614
642222.6687525163034-0.668752516303439
652522.37087868622522.62912131377481
661323.5419343703269-10.5419343703269
671618.8463761619179-2.84637616191787
681317.5785514457127-4.5785514457127
691615.53918617665410.46081382334585
701715.74444054978421.25555945021576
71916.3036882433765-7.30368824337648
721713.05050034843203.94949965156803
732514.809675169348010.1903248306520
741419.3486204638290-5.34862046382898
75816.9662532586898-8.96625325868977
76712.9725304172707-5.97253041727074
771010.3122630279454-0.312263027945436
78710.1731757245584-3.1731757245584
79108.759788883324211.24021111667579
8039.3122001661585-6.3122001661585


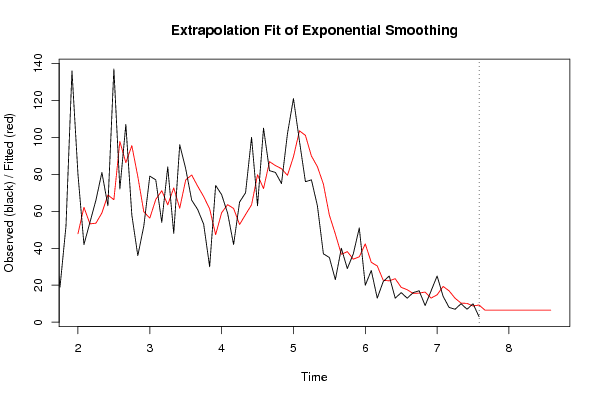
Extrapolation Forecasts of Exponential Smoothing
tForecast95% Lower Bound95% Upper Bound
816.50063805031436NANA
826.50063805031436NANA
836.50063805031436NANA
846.50063805031436NANA
856.50063805031436NANA
866.50063805031436NANA
876.50063805031436NANA
886.50063805031436NANA
896.50063805031436NANA
906.50063805031436NANA
916.50063805031436NANA
926.50063805031436NANA

\begin{tabular}{lllllllll}
\hline
Extrapolation Forecasts of Exponential Smoothing \tabularnewline
t & Forecast & 95% Lower Bound & 95% Upper Bound \tabularnewline
81 & 6.50063805031436 & NA & NA \tabularnewline
82 & 6.50063805031436 & NA & NA \tabularnewline
83 & 6.50063805031436 & NA & NA \tabularnewline
84 & 6.50063805031436 & NA & NA \tabularnewline
85 & 6.50063805031436 & NA & NA \tabularnewline
86 & 6.50063805031436 & NA & NA \tabularnewline
87 & 6.50063805031436 & NA & NA \tabularnewline
88 & 6.50063805031436 & NA & NA \tabularnewline
89 & 6.50063805031436 & NA & NA \tabularnewline
90 & 6.50063805031436 & NA & NA \tabularnewline
91 & 6.50063805031436 & NA & NA \tabularnewline
92 & 6.50063805031436 & NA & NA \tabularnewline
\hline
\end{tabular}
%Source: https://freestatistics.org/blog/index.php?pk=111932&T=3

[TABLE]
[ROW][C]Extrapolation Forecasts of Exponential Smoothing[/C][/ROW]
[ROW][C]t[/C][C]Forecast[/C][C]95% Lower Bound[/C][C]95% Upper Bound[/C][/ROW]
[ROW][C]81[/C][C]6.50063805031436[/C][C]NA[/C][C]NA[/C][/ROW]
[ROW][C]82[/C][C]6.50063805031436[/C][C]NA[/C][C]NA[/C][/ROW]
[ROW][C]83[/C][C]6.50063805031436[/C][C]NA[/C][C]NA[/C][/ROW]
[ROW][C]84[/C][C]6.50063805031436[/C][C]NA[/C][C]NA[/C][/ROW]
[ROW][C]85[/C][C]6.50063805031436[/C][C]NA[/C][C]NA[/C][/ROW]
[ROW][C]86[/C][C]6.50063805031436[/C][C]NA[/C][C]NA[/C][/ROW]
[ROW][C]87[/C][C]6.50063805031436[/C][C]NA[/C][C]NA[/C][/ROW]
[ROW][C]88[/C][C]6.50063805031436[/C][C]NA[/C][C]NA[/C][/ROW]
[ROW][C]89[/C][C]6.50063805031436[/C][C]NA[/C][C]NA[/C][/ROW]
[ROW][C]90[/C][C]6.50063805031436[/C][C]NA[/C][C]NA[/C][/ROW]
[ROW][C]91[/C][C]6.50063805031436[/C][C]NA[/C][C]NA[/C][/ROW]
[ROW][C]92[/C][C]6.50063805031436[/C][C]NA[/C][C]NA[/C][/ROW]
[/TABLE]
Source: https://freestatistics.org/blog/index.php?pk=111932&T=3

Globally Unique Identifier (entire table): ba.freestatistics.org/blog/index.php?pk=111932&T=3

As an alternative you can also use a QR Code:  

The GUIDs for individual cells are displayed in the table below:

Extrapolation Forecasts of Exponential Smoothing
tForecast95% Lower Bound95% Upper Bound
816.50063805031436NANA
826.50063805031436NANA
836.50063805031436NANA
846.50063805031436NANA
856.50063805031436NANA
866.50063805031436NANA
876.50063805031436NANA
886.50063805031436NANA
896.50063805031436NANA
906.50063805031436NANA
916.50063805031436NANA
926.50063805031436NANA


Parameters (Session):
par1 = 12 ; par2 = Triple ; par3 = multiplicative ;
Parameters (R input):
par1 = 12 ; par2 = Triple ; par3 = multiplicative ;
R code (references can be found in the software module):
par1 <- as.numeric(par1)
if (par2 == 'Single') K <- 1
if (par2 == 'Double') K <- 2
if (par2 == 'Triple') K <- par1
nx <- length(x)
nxmK <- nx - K
x <- ts(x, frequency = par1)
if (par2 == 'Single') fit <- HoltWinters(x, gamma=F, beta=F)
if (par2 == 'Double') fit <- HoltWinters(x, gamma=F)
if (par2 == 'Triple') fit <- HoltWinters(x, seasonal=par3)
fit
myresid <- x - fit$fitted[,'xhat']
bitmap(file='test1.png')
op <- par(mfrow=c(2,1))
plot(fit,ylab='Observed (black) / Fitted (red)',main='Interpolation Fit of Exponential Smoothing')
plot(myresid,ylab='Residuals',main='Interpolation Prediction Errors')
par(op)
dev.off()
bitmap(file='test2.png')
p <- predict(fit, par1, prediction.interval=TRUE)
np <- length(p[,1])
plot(fit,p,ylab='Observed (black) / Fitted (red)',main='Extrapolation Fit of Exponential Smoothing')
dev.off()
bitmap(file='test3.png')
op <- par(mfrow = c(2,2))
acf(as.numeric(myresid),lag.max = nx/2,main='Residual ACF')
spectrum(myresid,main='Residals Periodogram')
cpgram(myresid,main='Residal Cumulative Periodogram')
qqnorm(myresid,main='Residual Normal QQ Plot')
qqline(myresid)
par(op)
dev.off()
load(file='createtable')
a<-table.start()
a<-table.row.start(a)
a<-table.element(a,'Estimated Parameters of Exponential Smoothing',2,TRUE)
a<-table.row.end(a)
a<-table.row.start(a)
a<-table.element(a,'Parameter',header=TRUE)
a<-table.element(a,'Value',header=TRUE)
a<-table.row.end(a)
a<-table.row.start(a)
a<-table.element(a,'alpha',header=TRUE)
a<-table.element(a,fit$alpha)
a<-table.row.end(a)
a<-table.row.start(a)
a<-table.element(a,'beta',header=TRUE)
a<-table.element(a,fit$beta)
a<-table.row.end(a)
a<-table.row.start(a)
a<-table.element(a,'gamma',header=TRUE)
a<-table.element(a,fit$gamma)
a<-table.row.end(a)
a<-table.end(a)
table.save(a,file='mytable.tab')
a<-table.start()
a<-table.row.start(a)
a<-table.element(a,'Interpolation Forecasts of Exponential Smoothing',4,TRUE)
a<-table.row.end(a)
a<-table.row.start(a)
a<-table.element(a,'t',header=TRUE)
a<-table.element(a,'Observed',header=TRUE)
a<-table.element(a,'Fitted',header=TRUE)
a<-table.element(a,'Residuals',header=TRUE)
a<-table.row.end(a)
for (i in 1:nxmK) {
a<-table.row.start(a)
a<-table.element(a,i+K,header=TRUE)
a<-table.element(a,x[i+K])
a<-table.element(a,fit$fitted[i,'xhat'])
a<-table.element(a,myresid[i])
a<-table.row.end(a)
}
a<-table.end(a)
table.save(a,file='mytable1.tab')
a<-table.start()
a<-table.row.start(a)
a<-table.element(a,'Extrapolation Forecasts of Exponential Smoothing',4,TRUE)
a<-table.row.end(a)
a<-table.row.start(a)
a<-table.element(a,'t',header=TRUE)
a<-table.element(a,'Forecast',header=TRUE)
a<-table.element(a,'95% Lower Bound',header=TRUE)
a<-table.element(a,'95% Upper Bound',header=TRUE)
a<-table.row.end(a)
for (i in 1:np) {
a<-table.row.start(a)
a<-table.element(a,nx+i,header=TRUE)
a<-table.element(a,p[i,'fit'])
a<-table.element(a,p[i,'lwr'])
a<-table.element(a,p[i,'upr'])
a<-table.row.end(a)
}
a<-table.end(a)
table.save(a,file='mytable2.tab')