| Multiple Linear Regression - Estimated Regression Equation |
| kleding/schoeisel[t] = + 104.357875 -0.0560624999999774M1[t] -0.118550000000008M2[t] -0.0470375000000059M3[t] -0.0035250000000042M4[t] + 0.0199874999999958M5[t] + 0.0794999999999971M6[t] + 0.0750124999999974M7[t] + 0.314524999999997M8[t] + 0.333962500000001M9[t] + 0.358474999999994M10[t] + 0.272987499999995M11[t] -0.0795125000000003t + e[t] |
| Multiple Linear Regression - Ordinary Least Squares | |||||
| Variable | Parameter | S.D. | T-STAT H0: parameter = 0 | 2-tail p-value | 1-tail p-value |
| (Intercept) | 104.357875 | 0.13855 | 753.2161 | 0 | 0 |
| M1 | -0.0560624999999774 | 0.16658 | -0.3365 | 0.738093 | 0.369047 |
| M2 | -0.118550000000008 | 0.166465 | -0.7122 | 0.480211 | 0.240105 |
| M3 | -0.0470375000000059 | 0.166375 | -0.2827 | 0.778748 | 0.389374 |
| M4 | -0.0035250000000042 | 0.166311 | -0.0212 | 0.983188 | 0.491594 |
| M5 | 0.0199874999999958 | 0.166272 | 0.1202 | 0.904877 | 0.452439 |
| M6 | 0.0794999999999971 | 0.16626 | 0.4782 | 0.634953 | 0.317477 |
| M7 | 0.0750124999999974 | 0.166272 | 0.4511 | 0.654154 | 0.327077 |
| M8 | 0.314524999999997 | 0.166311 | 1.8912 | 0.065348 | 0.032674 |
| M9 | 0.333962500000001 | 0.175363 | 1.9044 | 0.063561 | 0.03178 |
| M10 | 0.358474999999994 | 0.175302 | 2.0449 | 0.047016 | 0.023508 |
| M11 | 0.272987499999995 | 0.175265 | 1.5576 | 0.126666 | 0.063333 |
| t | -0.0795125000000003 | 0.002065 | -38.4978 | 0 | 0 |
| Multiple Linear Regression - Regression Statistics | |
| Multiple R | 0.986049960445294 |
| R-squared | 0.972294524494166 |
| Adjusted R-squared | 0.964562763887886 |
| F-TEST (value) | 125.753314672535 |
| F-TEST (DF numerator) | 12 |
| F-TEST (DF denominator) | 43 |
| p-value | 0 |
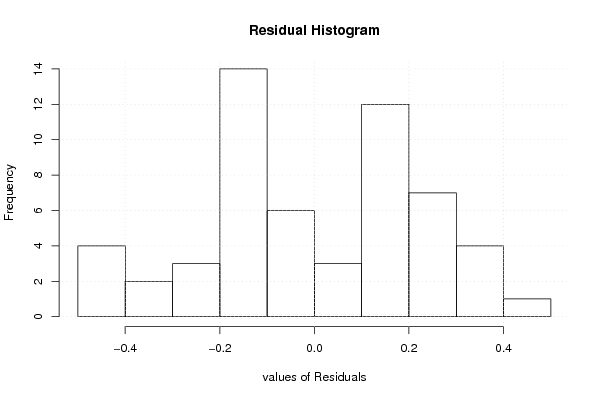
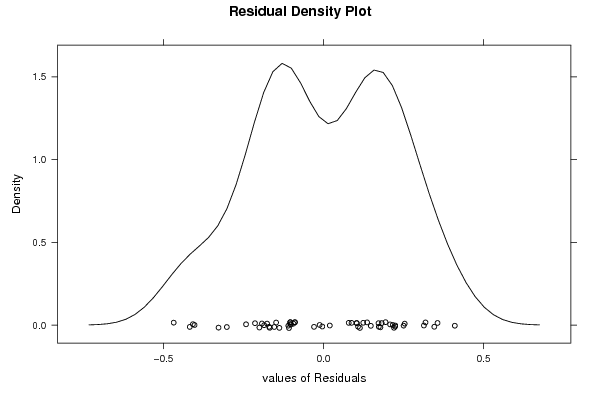
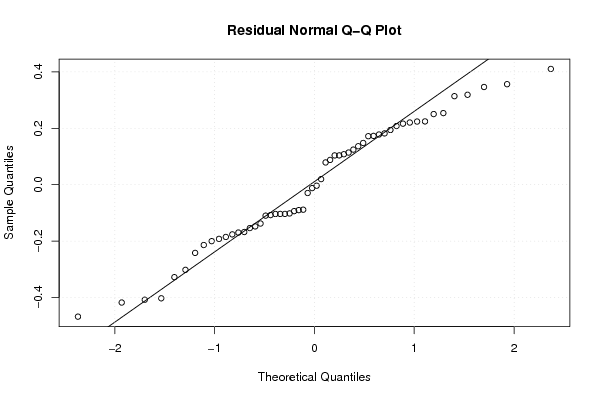
| Multiple Linear Regression - Residual Statistics | |
| Residual Standard Deviation | 0.247845260708803 |
| Sum Squared Residuals | 2.64137275000003 |
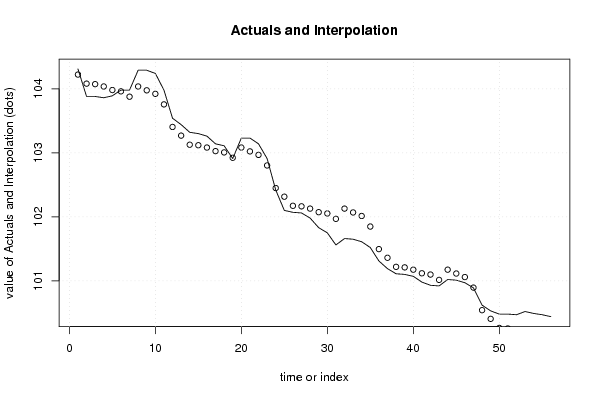
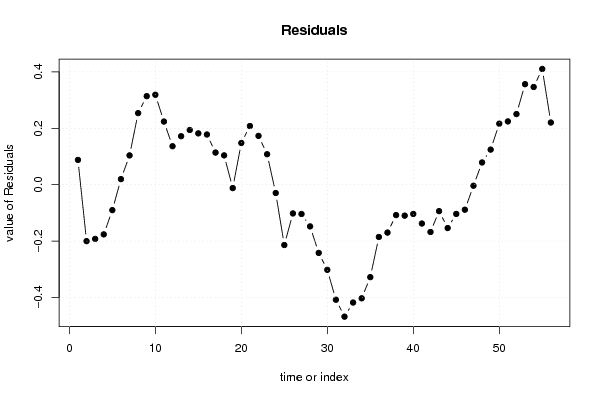
| Multiple Linear Regression - Actuals, Interpolation, and Residuals | |||
| Time or Index | Actuals | Interpolation Forecast | Residuals Prediction Error |
| 1 | 104.31 | 104.222300000000 | 0.0877000000001128 |
| 2 | 103.88 | 104.0803 | -0.200300000000007 |
| 3 | 103.88 | 104.0723 | -0.19230000000001 |
| 4 | 103.86 | 104.0363 | -0.176300000000007 |
| 5 | 103.89 | 103.9803 | -0.0903000000000056 |
| 6 | 103.98 | 103.9603 | 0.0196999999999969 |
| 7 | 103.98 | 103.8763 | 0.103699999999997 |
| 8 | 104.29 | 104.0363 | 0.253700000000000 |
| 9 | 104.29 | 103.976225 | 0.313774999999996 |
| 10 | 104.24 | 103.921225 | 0.318774999999992 |
| 11 | 103.98 | 103.756225 | 0.223775 |
| 12 | 103.54 | 103.403725 | 0.136274999999998 |
| 13 | 103.44 | 103.26815 | 0.171849999999969 |
| 14 | 103.32 | 103.12615 | 0.193849999999993 |
| 15 | 103.3 | 103.11815 | 0.181849999999995 |
| 16 | 103.26 | 103.08215 | 0.177850000000002 |
| 17 | 103.14 | 103.02615 | 0.113849999999997 |
| 18 | 103.11 | 103.00615 | 0.103849999999995 |
| 19 | 102.91 | 102.92215 | -0.0121500000000073 |
| 20 | 103.23 | 103.08215 | 0.147850000000001 |
| 21 | 103.23 | 103.022075 | 0.207924999999997 |
| 22 | 103.14 | 102.967075 | 0.172925000000000 |
| 23 | 102.91 | 102.802075 | 0.107924999999996 |
| 24 | 102.42 | 102.449575 | -0.0295750000000036 |
| 25 | 102.1 | 102.314 | -0.214000000000034 |
| 26 | 102.07 | 102.172 | -0.102000000000004 |
| 27 | 102.06 | 102.164 | -0.103999999999997 |
| 28 | 101.98 | 102.128 | -0.147999999999996 |
| 29 | 101.83 | 102.072 | -0.242000000000002 |
| 30 | 101.75 | 102.052 | -0.302000000000001 |
| 31 | 101.56 | 101.968 | -0.407999999999998 |
| 32 | 101.66 | 102.128 | -0.468000000000003 |
| 33 | 101.65 | 102.067925 | -0.417924999999998 |
| 34 | 101.61 | 102.012925 | -0.402924999999997 |
| 35 | 101.52 | 101.847925 | -0.327925000000001 |
| 36 | 101.31 | 101.495425 | -0.185424999999999 |
| 37 | 101.19 | 101.35985 | -0.169850000000027 |
| 38 | 101.11 | 101.21785 | -0.107849999999994 |
| 39 | 101.1 | 101.20985 | -0.109850000000001 |
| 40 | 101.07 | 101.17385 | -0.103850000000004 |
| 41 | 100.98 | 101.11785 | -0.137849999999993 |
| 42 | 100.93 | 101.09785 | -0.167849999999991 |
| 43 | 100.92 | 101.01385 | -0.0938499999999962 |
| 44 | 101.02 | 101.17385 | -0.153850000000001 |
| 45 | 101.01 | 101.113775 | -0.103774999999995 |
| 46 | 100.97 | 101.058775 | -0.088774999999995 |
| 47 | 100.89 | 100.893775 | -0.00377499999999424 |
| 48 | 100.62 | 100.541275 | 0.0787250000000054 |
| 49 | 100.53 | 100.4057 | 0.124299999999980 |
| 50 | 100.48 | 100.2637 | 0.216300000000013 |
| 51 | 100.48 | 100.2557 | 0.224300000000012 |
| 52 | 100.47 | 100.2197 | 0.250300000000005 |
| 53 | 100.52 | 100.1637 | 0.356300000000003 |
| 54 | 100.49 | 100.1437 | 0.3463 |
| 55 | 100.47 | 100.0597 | 0.410300000000005 |
| 56 | 100.44 | 100.2197 | 0.220300000000004 |
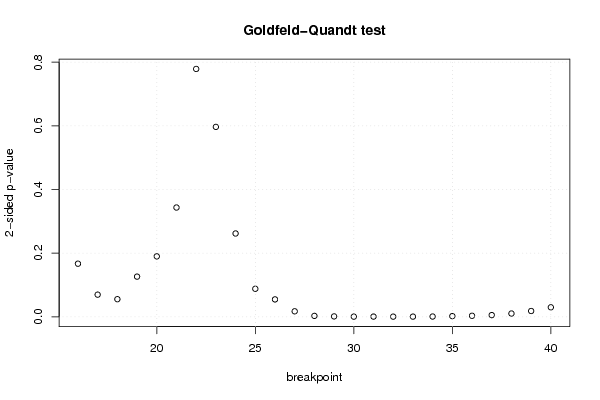
| Goldfeld-Quandt test for Heteroskedasticity | |||
| p-values | Alternative Hypothesis | ||
| breakpoint index | greater | 2-sided | less |
| 16 | 0.0833942631665752 | 0.166788526333150 | 0.916605736833425 |
| 17 | 0.034775094735645 | 0.06955018947129 | 0.965224905264355 |
| 18 | 0.0276039668868906 | 0.0552079337737812 | 0.97239603311311 |
| 19 | 0.0630884924188008 | 0.126176984837602 | 0.9369115075812 |
| 20 | 0.0949486336142717 | 0.189897267228543 | 0.905051366385728 |
| 21 | 0.171652064259814 | 0.343304128519628 | 0.828347935740186 |
| 22 | 0.389423536251266 | 0.778847072502532 | 0.610576463748734 |
| 23 | 0.70164245782568 | 0.596715084348641 | 0.298357542174320 |
| 24 | 0.869114703340444 | 0.261770593319112 | 0.130885296659556 |
| 25 | 0.956022197939906 | 0.0879556041201878 | 0.0439778020600939 |
| 26 | 0.972703662134358 | 0.0545926757312844 | 0.0272963378656422 |
| 27 | 0.991410777207307 | 0.0171784455853860 | 0.00858922279269302 |
| 28 | 0.998596312159333 | 0.00280737568133428 | 0.00140368784066714 |
| 29 | 0.999400210295779 | 0.00119957940844249 | 0.000599789704221247 |
| 30 | 0.999796682979518 | 0.000406634040964429 | 0.000203317020482215 |
| 31 | 0.999729767633797 | 0.000540464732406409 | 0.000270232366203204 |
| 32 | 0.999814051014233 | 0.000371897971534784 | 0.000185948985767392 |
| 33 | 0.999780216036565 | 0.000439567926869993 | 0.000219783963434997 |
| 34 | 0.999618889785667 | 0.00076222042866534 | 0.00038111021433267 |
| 35 | 0.998997553779561 | 0.00200489244087735 | 0.00100244622043867 |
| 36 | 0.998455879536893 | 0.00308824092621459 | 0.00154412046310729 |
| 37 | 0.997367983720444 | 0.00526403255911142 | 0.00263201627955571 |
| 38 | 0.994931289554444 | 0.0101374208911128 | 0.00506871044555638 |
| 39 | 0.990931302763902 | 0.0181373944721956 | 0.00906869723609782 |
| 40 | 0.985140501402304 | 0.0297189971953915 | 0.0148594985976958 |
| Meta Analysis of Goldfeld-Quandt test for Heteroskedasticity | |||
| Description | # significant tests | % significant tests | OK/NOK |
| 1% type I error level | 10 | 0.4 | NOK |
| 5% type I error level | 14 | 0.56 | NOK |
| 10% type I error level | 18 | 0.72 | NOK |