| Multiple Linear Regression - Estimated Regression Equation |
| Y(t)[t] = + 27.5646541936156 + 0.719237622037051T.I.P.[t] + 0.351615816868488`Y(t-1)`[t] -0.225481858966781`Y(t-3)`[t] -2.87531712508168M1[t] -1.25845267587132M2[t] -1.64388521197177M3[t] + 11.4973887999212M4[t] + 5.12018350407216M5[t] -8.78441952464868M6[t] -5.16373479336386M7[t] -4.47697332405873M8[t] + 1.16759647044438M9[t] + 6.50191392593397M10[t] -1.4199990435579M11[t] -0.100533009976323t + e[t] |
| Multiple Linear Regression - Ordinary Least Squares | |||||
| Variable | Parameter | S.D. | T-STAT H0: parameter = 0 | 2-tail p-value | 1-tail p-value |
| (Intercept) | 27.5646541936156 | 11.154238 | 2.4712 | 0.01771 | 0.008855 |
| T.I.P. | 0.719237622037051 | 0.110576 | 6.5044 | 0 | 0 |
| `Y(t-1)` | 0.351615816868488 | 0.111572 | 3.1515 | 0.003033 | 0.001516 |
| `Y(t-3)` | -0.225481858966781 | 0.111906 | -2.0149 | 0.050501 | 0.025251 |
| M1 | -2.87531712508168 | 2.810467 | -1.0231 | 0.312271 | 0.156136 |
| M2 | -1.25845267587132 | 2.606872 | -0.4827 | 0.631845 | 0.315922 |
| M3 | -1.64388521197177 | 2.585307 | -0.6359 | 0.528403 | 0.264202 |
| M4 | 11.4973887999212 | 3.793259 | 3.031 | 0.00421 | 0.002105 |
| M5 | 5.12018350407216 | 2.950822 | 1.7352 | 0.090223 | 0.045111 |
| M6 | -8.78441952464868 | 2.498781 | -3.5155 | 0.001087 | 0.000543 |
| M7 | -5.16373479336386 | 2.503896 | -2.0623 | 0.045556 | 0.022778 |
| M8 | -4.47697332405873 | 2.606334 | -1.7177 | 0.093392 | 0.046696 |
| M9 | 1.16759647044438 | 2.841313 | 0.4109 | 0.68326 | 0.34163 |
| M10 | 6.50191392593397 | 2.902503 | 2.2401 | 0.030567 | 0.015283 |
| M11 | -1.4199990435579 | 2.854385 | -0.4975 | 0.621508 | 0.310754 |
| t | -0.100533009976323 | 0.034392 | -2.9231 | 0.005618 | 0.002809 |
| Multiple Linear Regression - Regression Statistics | |
| Multiple R | 0.913268637606618 |
| R-squared | 0.834059604435848 |
| Adjusted R-squared | 0.773349703619695 |
| F-TEST (value) | 13.7384445242568 |
| F-TEST (DF numerator) | 15 |
| F-TEST (DF denominator) | 41 |
| p-value | 1.75230940868687e-11 |
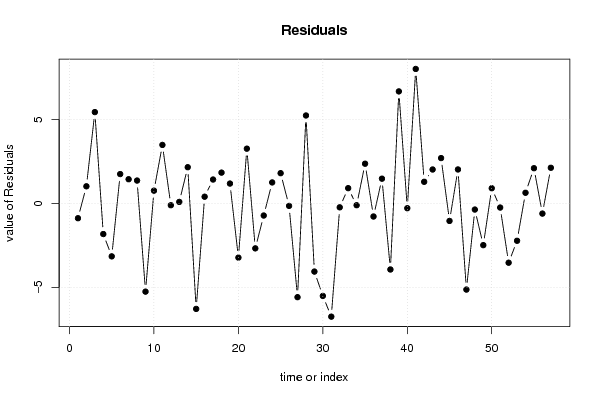
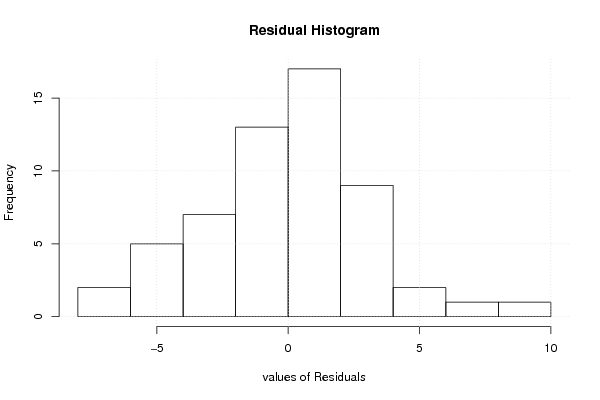
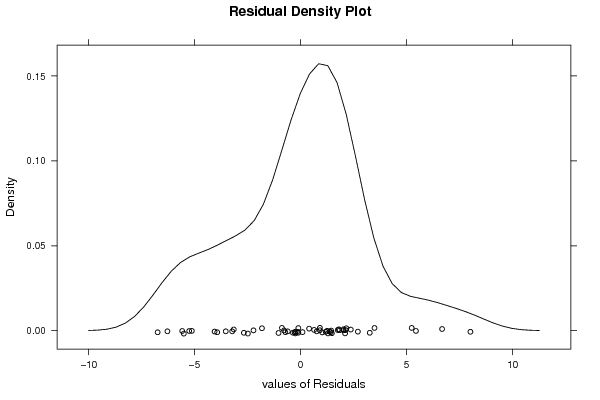
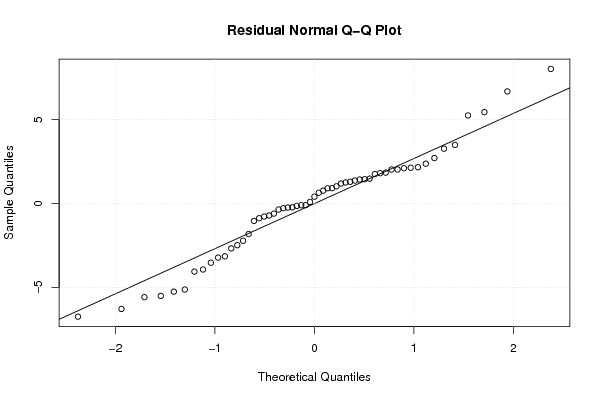
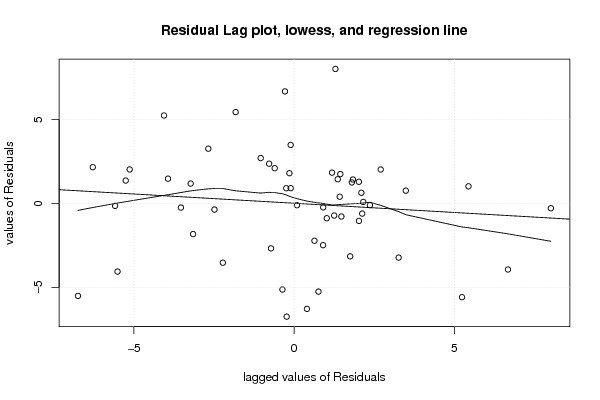
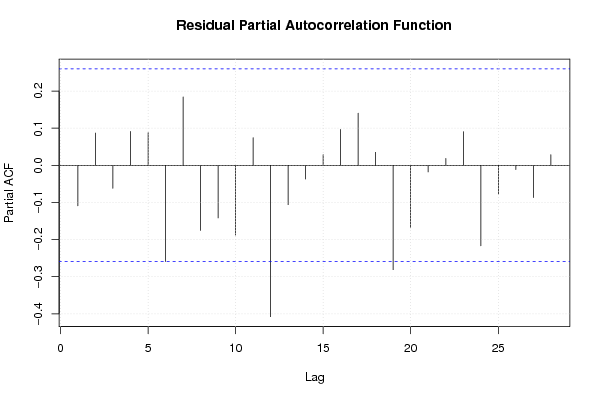
| Multiple Linear Regression - Residual Statistics | |
| Residual Standard Deviation | 3.62948298030304 |
| Sum Squared Residuals | 540.099014876688 |
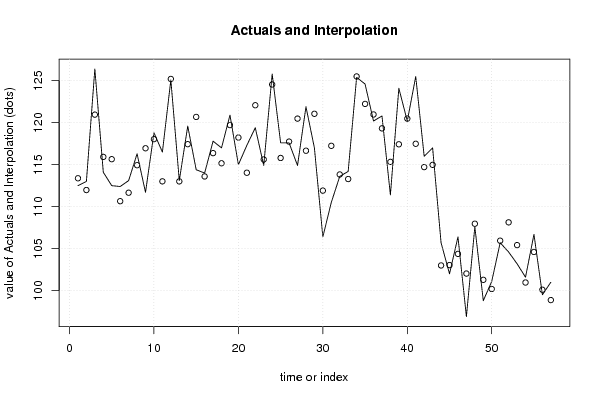
| Multiple Linear Regression - Actuals, Interpolation, and Residuals | |||
| Time or Index | Actuals | Interpolation Forecast | Residuals Prediction Error |
| 1 | 112.5 | 113.381553606476 | -0.881553606475701 |
| 2 | 113 | 111.979825778402 | 1.02017422159778 |
| 3 | 126.4 | 120.959189466451 | 5.44081053354928 |
| 4 | 114.1 | 115.923764694843 | -1.82376469484289 |
| 5 | 112.5 | 115.6531277182 | -3.15312771820009 |
| 6 | 112.4 | 110.650607848007 | 1.74939215199312 |
| 7 | 113.1 | 111.658590212049 | 1.44140978795053 |
| 8 | 116.3 | 114.937509821441 | 1.36249017855949 |
| 9 | 111.7 | 116.954220862602 | -5.2542208626023 |
| 10 | 118.8 | 118.039251096522 | 0.760748903478475 |
| 11 | 116.5 | 113.014439425589 | 3.48556057441113 |
| 12 | 125.1 | 125.207122437768 | -0.107122437768481 |
| 13 | 113.1 | 113.009530322967 | 0.0904696770330307 |
| 14 | 119.6 | 117.442066358144 | 2.15793364185637 |
| 15 | 114.4 | 120.682876458172 | -6.28287645817183 |
| 16 | 114 | 113.599258956492 | 0.40074104350817 |
| 17 | 117.8 | 116.375730333394 | 1.42426966660554 |
| 18 | 117 | 115.164338060555 | 1.83566193944535 |
| 19 | 120.9 | 119.716093829418 | 1.18390617058195 |
| 20 | 115 | 118.227537471127 | -3.22753747112682 |
| 21 | 117.3 | 114.037736343099 | 3.26226365690091 |
| 22 | 119.4 | 122.077808405588 | -2.67780840558763 |
| 23 | 114.9 | 115.620632274021 | -0.720632274021336 |
| 24 | 125.8 | 124.548926753571 | 1.25107324642868 |
| 25 | 117.6 | 115.797859318679 | 1.80214068132096 |
| 26 | 117.6 | 117.747169815461 | -0.147169815460565 |
| 27 | 114.9 | 120.485429220739 | -5.58542922073857 |
| 28 | 121.9 | 116.660589496323 | 5.23941050367726 |
| 29 | 117 | 121.05924208641 | -4.0592420864103 |
| 30 | 106.4 | 111.909661827175 | -5.50966182717538 |
| 31 | 110.5 | 117.244765335077 | -6.74476533507725 |
| 32 | 113.6 | 113.832417391967 | -0.232417391966923 |
| 33 | 114.2 | 113.290710540741 | 0.909289459258885 |
| 34 | 125.4 | 125.506831410408 | -0.106831410408123 |
| 35 | 124.6 | 122.233887823348 | 2.36611217665222 |
| 36 | 120.2 | 120.979059221943 | -0.779059221943333 |
| 37 | 120.8 | 119.324984837514 | 1.47501516248608 |
| 38 | 111.4 | 115.334922753339 | -3.93492275333866 |
| 39 | 124.1 | 117.426704538004 | 6.67329546199609 |
| 40 | 120.2 | 120.484848620233 | -0.284848620232935 |
| 41 | 125.5 | 117.488441066649 | 8.01155893335099 |
| 42 | 116 | 114.710288823107 | 1.28971117689341 |
| 43 | 117 | 114.978308149894 | 2.02169185010586 |
| 44 | 105.7 | 102.997525334364 | 2.70247466563643 |
| 45 | 102 | 103.042269176072 | -1.04226917607191 |
| 46 | 106.4 | 104.376109087483 | 2.02389091251728 |
| 47 | 96.9 | 102.031040477042 | -5.13104047704201 |
| 48 | 107.6 | 107.964891586717 | -0.364891586716859 |
| 49 | 98.8 | 101.286071914364 | -2.48607191436437 |
| 50 | 101.1 | 100.196015294655 | 0.903984705345068 |
| 51 | 105.7 | 105.945800316635 | -0.245800316634972 |
| 52 | 104.6 | 108.13153823211 | -3.5315382321096 |
| 53 | 103.2 | 105.423458795346 | -2.22345879534613 |
| 54 | 101.6 | 100.965103441157 | 0.634896558843497 |
| 55 | 106.7 | 104.602242473561 | 2.09775752643891 |
| 56 | 99.5 | 100.105009981102 | -0.605009981102175 |
| 57 | 101 | 98.8750630774856 | 2.12493692251442 |
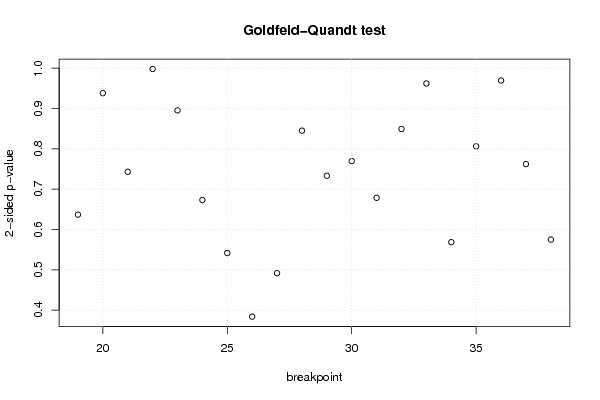
| Goldfeld-Quandt test for Heteroskedasticity | |||
| p-values | Alternative Hypothesis | ||
| breakpoint index | greater | 2-sided | less |
| 19 | 0.681613208712021 | 0.636773582575958 | 0.318386791287979 |
| 20 | 0.531004287850866 | 0.937991424298268 | 0.468995712149134 |
| 21 | 0.628429159765247 | 0.743141680469507 | 0.371570840234753 |
| 22 | 0.499038584422185 | 0.99807716884437 | 0.500961415577815 |
| 23 | 0.44766625500748 | 0.895332510014961 | 0.55233374499252 |
| 24 | 0.336500613659002 | 0.673001227318004 | 0.663499386340998 |
| 25 | 0.2707139146065 | 0.541427829213 | 0.7292860853935 |
| 26 | 0.191891597872708 | 0.383783195745415 | 0.808108402127293 |
| 27 | 0.245754418030207 | 0.491508836060413 | 0.754245581969793 |
| 28 | 0.42253002280863 | 0.84506004561726 | 0.57746997719137 |
| 29 | 0.366610788456309 | 0.733221576912618 | 0.633389211543691 |
| 30 | 0.3847917742107 | 0.769583548421401 | 0.6152082257893 |
| 31 | 0.660769453956495 | 0.678461092087009 | 0.339230546043505 |
| 32 | 0.575409217872904 | 0.849181564254192 | 0.424590782127096 |
| 33 | 0.481018204225057 | 0.962036408450114 | 0.518981795774943 |
| 34 | 0.715753949059422 | 0.568492101881156 | 0.284246050940578 |
| 35 | 0.596869411093025 | 0.806261177813951 | 0.403130588906975 |
| 36 | 0.51531562556361 | 0.96936874887278 | 0.48468437443639 |
| 37 | 0.3810355730472 | 0.7620711460944 | 0.6189644269528 |
| 38 | 0.287416526121309 | 0.574833052242618 | 0.712583473878691 |
| Meta Analysis of Goldfeld-Quandt test for Heteroskedasticity | |||
| Description | # significant tests | % significant tests | OK/NOK |
| 1% type I error level | 0 | 0 | OK |
| 5% type I error level | 0 | 0 | OK |
| 10% type I error level | 0 | 0 | OK |