Free Statistics

of Irreproducible Research!

Author's title

Author*The author of this computation has been verified*
R Software Modulerwasp_smp.wasp
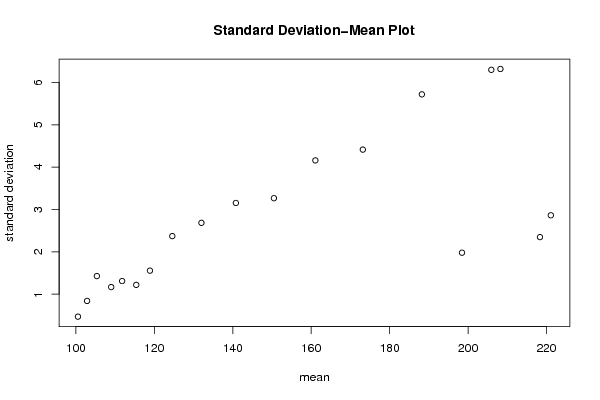
Title produced by softwareStandard Deviation-Mean Plot
Date of computationSat, 18 Dec 2010 12:19:36 +0000
Cite this page as followsStatistical Computations at FreeStatistics.org, Office for Research Development and Education, URL https://freestatistics.org/blog/index.php?v=date/2010/Dec/18/t1292674789q022xg0aj5pbqd5.htm/, Retrieved Tue, 30 Apr 2024 01:19:41 +0000
Statistical Computations at FreeStatistics.org, Office for Research Development and Education, URL https://freestatistics.org/blog/index.php?pk=111881, Retrieved Tue, 30 Apr 2024 01:19:41 +0000
QR Codes:

Original text written by user:
IsPrivate?No (this computation is public)
User-defined keywords
Estimated Impact166
Family? (F = Feedback message, R = changed R code, M = changed R Module, P = changed Parameters, D = changed Data)
-     [Standard Deviation-Mean Plot] [Standard deviatio...] [2008-12-11 16:40:34] [12d343c4448a5f9e527bb31caeac580b]
-  M D  [Standard Deviation-Mean Plot] [Paper SMP] [2009-12-20 19:13:30] [83058a88a37d754675a5cd22dab372fc]
-   PD      [Standard Deviation-Mean Plot] [paper] [2010-12-18 12:19:36] [912a7c71b856221ca57f8714938acfc7] [Current]
Feedback Forum

Post a new message
Dataseries X:
100.00
100.42
100.50
101.14
101.98
102.31
103.27
103.80
103.46
105.06
106.08
106.74
107.35
108.96
109.85
109.81
109.99
111.60
112.74
112.78
113.66
115.37
116.26
116.24
116.73
118.76
119.78
120.23
121.48
124.07
125.82
126.92
128.48
131.44
133.51
134.58
136.68
140.10
142.45
143.91
146.19
149.84
152.31
153.62
155.79
159.89
163.21
165.32
167.68
171.79
175.38
177.81
181.09
186.48
191.07
194.23
197.82
204.41
209.26
212.24
214.88
218.87
219.86
219.75
220.89
224.02
222.27
217.27
213.23
212.44
207.87
199.46
198.19
199.77
200.10
195.76
191.27
195.79
192.7


Summary of computational transaction
Raw Inputview raw input (R code)
Raw Outputview raw output of R engine
Computing time3 seconds
R Server'George Udny Yule' @ 72.249.76.132

\begin{tabular}{lllllllll}
\hline
Summary of computational transaction \tabularnewline
Raw Input & view raw input (R code)  \tabularnewline
Raw Output & view raw output of R engine  \tabularnewline
Computing time & 3 seconds \tabularnewline
R Server & 'George Udny Yule' @ 72.249.76.132 \tabularnewline
\hline
\end{tabular}
%Source: https://freestatistics.org/blog/index.php?pk=111881&T=0

[TABLE]
[ROW][C]Summary of computational transaction[/C][/ROW]
[ROW][C]Raw Input[/C][C]view raw input (R code) [/C][/ROW]
[ROW][C]Raw Output[/C][C]view raw output of R engine [/C][/ROW]
[ROW][C]Computing time[/C][C]3 seconds[/C][/ROW]
[ROW][C]R Server[/C][C]'George Udny Yule' @ 72.249.76.132[/C][/ROW]
[/TABLE]
Source: https://freestatistics.org/blog/index.php?pk=111881&T=0

Globally Unique Identifier (entire table): ba.freestatistics.org/blog/index.php?pk=111881&T=0

As an alternative you can also use a QR Code:  

The GUIDs for individual cells are displayed in the table below:

Summary of computational transaction
Raw Inputview raw input (R code)
Raw Outputview raw output of R engine
Computing time3 seconds
R Server'George Udny Yule' @ 72.249.76.132


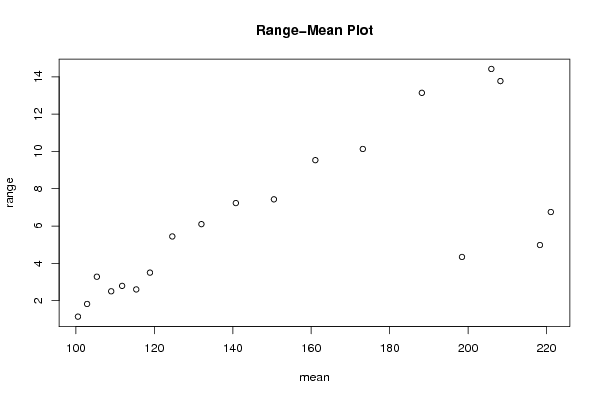
Standard Deviation-Mean Plot
SectionMeanStandard DeviationRange
1100.5150.4708502946797421.14
2102.840.8420213774008321.81999999999999
3105.3351.428320692281673.28
4108.99251.169397993271182.5
5111.77751.311243048917072.79000000000001
6115.38251.220993447975872.60000000000001
7118.8751.556630977463833.5
8124.57252.372275630416225.44
9132.00252.685794420030456.10000000000002
10140.7853.154790008859547.22999999999999
11150.493.267098610898267.43
12161.05254.159794666406839.53
13173.1654.414298736303810.13
14188.21755.7185975844898613.1400000000000
15205.93256.2978164205275714.4200000000000
16218.342.348829495727614.98000000000002
17221.11252.864010882195346.75
18208.256.3183594917246213.7700000000000
19198.4551.980614382794734.34

\begin{tabular}{lllllllll}
\hline
Standard Deviation-Mean Plot \tabularnewline
Section & Mean & Standard Deviation & Range \tabularnewline
1 & 100.515 & 0.470850294679742 & 1.14 \tabularnewline
2 & 102.84 & 0.842021377400832 & 1.81999999999999 \tabularnewline
3 & 105.335 & 1.42832069228167 & 3.28 \tabularnewline
4 & 108.9925 & 1.16939799327118 & 2.5 \tabularnewline
5 & 111.7775 & 1.31124304891707 & 2.79000000000001 \tabularnewline
6 & 115.3825 & 1.22099344797587 & 2.60000000000001 \tabularnewline
7 & 118.875 & 1.55663097746383 & 3.5 \tabularnewline
8 & 124.5725 & 2.37227563041622 & 5.44 \tabularnewline
9 & 132.0025 & 2.68579442003045 & 6.10000000000002 \tabularnewline
10 & 140.785 & 3.15479000885954 & 7.22999999999999 \tabularnewline
11 & 150.49 & 3.26709861089826 & 7.43 \tabularnewline
12 & 161.0525 & 4.15979466640683 & 9.53 \tabularnewline
13 & 173.165 & 4.4142987363038 & 10.13 \tabularnewline
14 & 188.2175 & 5.71859758448986 & 13.1400000000000 \tabularnewline
15 & 205.9325 & 6.29781642052757 & 14.4200000000000 \tabularnewline
16 & 218.34 & 2.34882949572761 & 4.98000000000002 \tabularnewline
17 & 221.1125 & 2.86401088219534 & 6.75 \tabularnewline
18 & 208.25 & 6.31835949172462 & 13.7700000000000 \tabularnewline
19 & 198.455 & 1.98061438279473 & 4.34 \tabularnewline
\hline
\end{tabular}
%Source: https://freestatistics.org/blog/index.php?pk=111881&T=1

[TABLE]
[ROW][C]Standard Deviation-Mean Plot[/C][/ROW]
[ROW][C]Section[/C][C]Mean[/C][C]Standard Deviation[/C][C]Range[/C][/ROW]
[ROW][C]1[/C][C]100.515[/C][C]0.470850294679742[/C][C]1.14[/C][/ROW]
[ROW][C]2[/C][C]102.84[/C][C]0.842021377400832[/C][C]1.81999999999999[/C][/ROW]
[ROW][C]3[/C][C]105.335[/C][C]1.42832069228167[/C][C]3.28[/C][/ROW]
[ROW][C]4[/C][C]108.9925[/C][C]1.16939799327118[/C][C]2.5[/C][/ROW]
[ROW][C]5[/C][C]111.7775[/C][C]1.31124304891707[/C][C]2.79000000000001[/C][/ROW]
[ROW][C]6[/C][C]115.3825[/C][C]1.22099344797587[/C][C]2.60000000000001[/C][/ROW]
[ROW][C]7[/C][C]118.875[/C][C]1.55663097746383[/C][C]3.5[/C][/ROW]
[ROW][C]8[/C][C]124.5725[/C][C]2.37227563041622[/C][C]5.44[/C][/ROW]
[ROW][C]9[/C][C]132.0025[/C][C]2.68579442003045[/C][C]6.10000000000002[/C][/ROW]
[ROW][C]10[/C][C]140.785[/C][C]3.15479000885954[/C][C]7.22999999999999[/C][/ROW]
[ROW][C]11[/C][C]150.49[/C][C]3.26709861089826[/C][C]7.43[/C][/ROW]
[ROW][C]12[/C][C]161.0525[/C][C]4.15979466640683[/C][C]9.53[/C][/ROW]
[ROW][C]13[/C][C]173.165[/C][C]4.4142987363038[/C][C]10.13[/C][/ROW]
[ROW][C]14[/C][C]188.2175[/C][C]5.71859758448986[/C][C]13.1400000000000[/C][/ROW]
[ROW][C]15[/C][C]205.9325[/C][C]6.29781642052757[/C][C]14.4200000000000[/C][/ROW]
[ROW][C]16[/C][C]218.34[/C][C]2.34882949572761[/C][C]4.98000000000002[/C][/ROW]
[ROW][C]17[/C][C]221.1125[/C][C]2.86401088219534[/C][C]6.75[/C][/ROW]
[ROW][C]18[/C][C]208.25[/C][C]6.31835949172462[/C][C]13.7700000000000[/C][/ROW]
[ROW][C]19[/C][C]198.455[/C][C]1.98061438279473[/C][C]4.34[/C][/ROW]
[/TABLE]
Source: https://freestatistics.org/blog/index.php?pk=111881&T=1

Globally Unique Identifier (entire table): ba.freestatistics.org/blog/index.php?pk=111881&T=1

As an alternative you can also use a QR Code:  

The GUIDs for individual cells are displayed in the table below:

Standard Deviation-Mean Plot
SectionMeanStandard DeviationRange
1100.5150.4708502946797421.14
2102.840.8420213774008321.81999999999999
3105.3351.428320692281673.28
4108.99251.169397993271182.5
5111.77751.311243048917072.79000000000001
6115.38251.220993447975872.60000000000001
7118.8751.556630977463833.5
8124.57252.372275630416225.44
9132.00252.685794420030456.10000000000002
10140.7853.154790008859547.22999999999999
11150.493.267098610898267.43
12161.05254.159794666406839.53
13173.1654.414298736303810.13
14188.21755.7185975844898613.1400000000000
15205.93256.2978164205275714.4200000000000
16218.342.348829495727614.98000000000002
17221.11252.864010882195346.75
18208.256.3183594917246213.7700000000000
19198.4551.980614382794734.34


Regression: S.E.(k) = alpha + beta * Mean(k)
alpha-1.66161551264380
beta0.0295044018521920
S.D.0.00720623052386016
T-STAT4.0942905940216
p-value0.000755997555267205

\begin{tabular}{lllllllll}
\hline
Regression: S.E.(k) = alpha + beta * Mean(k) \tabularnewline
alpha & -1.66161551264380 \tabularnewline
beta & 0.0295044018521920 \tabularnewline
S.D. & 0.00720623052386016 \tabularnewline
T-STAT & 4.0942905940216 \tabularnewline
p-value & 0.000755997555267205 \tabularnewline
\hline
\end{tabular}
%Source: https://freestatistics.org/blog/index.php?pk=111881&T=2

[TABLE]
[ROW][C]Regression: S.E.(k) = alpha + beta * Mean(k)[/C][/ROW]
[ROW][C]alpha[/C][C]-1.66161551264380[/C][/ROW]
[ROW][C]beta[/C][C]0.0295044018521920[/C][/ROW]
[ROW][C]S.D.[/C][C]0.00720623052386016[/C][/ROW]
[ROW][C]T-STAT[/C][C]4.0942905940216[/C][/ROW]
[ROW][C]p-value[/C][C]0.000755997555267205[/C][/ROW]
[/TABLE]
Source: https://freestatistics.org/blog/index.php?pk=111881&T=2

Globally Unique Identifier (entire table): ba.freestatistics.org/blog/index.php?pk=111881&T=2

As an alternative you can also use a QR Code:  

The GUIDs for individual cells are displayed in the table below:

Regression: S.E.(k) = alpha + beta * Mean(k)
alpha-1.66161551264380
beta0.0295044018521920
S.D.0.00720623052386016
T-STAT4.0942905940216
p-value0.000755997555267205


Regression: ln S.E.(k) = alpha + beta * ln Mean(k)
alpha-8.94662180693358
beta1.95947202209655
S.D.0.379645084015354
T-STAT5.16132594520125
p-value7.82961598023542e-05
Lambda-0.959472022096554

\begin{tabular}{lllllllll}
\hline
Regression: ln S.E.(k) = alpha + beta * ln Mean(k) \tabularnewline
alpha & -8.94662180693358 \tabularnewline
beta & 1.95947202209655 \tabularnewline
S.D. & 0.379645084015354 \tabularnewline
T-STAT & 5.16132594520125 \tabularnewline
p-value & 7.82961598023542e-05 \tabularnewline
Lambda & -0.959472022096554 \tabularnewline
\hline
\end{tabular}
%Source: https://freestatistics.org/blog/index.php?pk=111881&T=3

[TABLE]
[ROW][C]Regression: ln S.E.(k) = alpha + beta * ln Mean(k)[/C][/ROW]
[ROW][C]alpha[/C][C]-8.94662180693358[/C][/ROW]
[ROW][C]beta[/C][C]1.95947202209655[/C][/ROW]
[ROW][C]S.D.[/C][C]0.379645084015354[/C][/ROW]
[ROW][C]T-STAT[/C][C]5.16132594520125[/C][/ROW]
[ROW][C]p-value[/C][C]7.82961598023542e-05[/C][/ROW]
[ROW][C]Lambda[/C][C]-0.959472022096554[/C][/ROW]
[/TABLE]
Source: https://freestatistics.org/blog/index.php?pk=111881&T=3

Globally Unique Identifier (entire table): ba.freestatistics.org/blog/index.php?pk=111881&T=3

As an alternative you can also use a QR Code:  

The GUIDs for individual cells are displayed in the table below:

Regression: ln S.E.(k) = alpha + beta * ln Mean(k)
alpha-8.94662180693358
beta1.95947202209655
S.D.0.379645084015354
T-STAT5.16132594520125
p-value7.82961598023542e-05
Lambda-0.959472022096554


Parameters (Session):
par1 = 4 ;
Parameters (R input):
par1 = 4 ;
R code (references can be found in the software module):
par1 <- as.numeric(par1)
(n <- length(x))
(np <- floor(n / par1))
arr <- array(NA,dim=c(par1,np))
j <- 0
k <- 1
for (i in 1:(np*par1))
{
j = j + 1
arr[j,k] <- x[i]
if (j == par1) {
j = 0
k=k+1
}
}
arr
arr.mean <- array(NA,dim=np)
arr.sd <- array(NA,dim=np)
arr.range <- array(NA,dim=np)
for (j in 1:np)
{
arr.mean[j] <- mean(arr[,j],na.rm=TRUE)
arr.sd[j] <- sd(arr[,j],na.rm=TRUE)
arr.range[j] <- max(arr[,j],na.rm=TRUE) - min(arr[,j],na.rm=TRUE)
}
arr.mean
arr.sd
arr.range
(lm1 <- lm(arr.sd~arr.mean))
(lnlm1 <- lm(log(arr.sd)~log(arr.mean)))
(lm2 <- lm(arr.range~arr.mean))
bitmap(file='test1.png')
plot(arr.mean,arr.sd,main='Standard Deviation-Mean Plot',xlab='mean',ylab='standard deviation')
dev.off()
bitmap(file='test2.png')
plot(arr.mean,arr.range,main='Range-Mean Plot',xlab='mean',ylab='range')
dev.off()
load(file='createtable')
a<-table.start()
a<-table.row.start(a)
a<-table.element(a,'Standard Deviation-Mean Plot',4,TRUE)
a<-table.row.end(a)
a<-table.row.start(a)
a<-table.element(a,'Section',header=TRUE)
a<-table.element(a,'Mean',header=TRUE)
a<-table.element(a,'Standard Deviation',header=TRUE)
a<-table.element(a,'Range',header=TRUE)
a<-table.row.end(a)
for (j in 1:np) {
a<-table.row.start(a)
a<-table.element(a,j,header=TRUE)
a<-table.element(a,arr.mean[j])
a<-table.element(a,arr.sd[j] )
a<-table.element(a,arr.range[j] )
a<-table.row.end(a)
}
a<-table.end(a)
table.save(a,file='mytable.tab')
a<-table.start()
a<-table.row.start(a)
a<-table.element(a,'Regression: S.E.(k) = alpha + beta * Mean(k)',2,TRUE)
a<-table.row.end(a)
a<-table.row.start(a)
a<-table.element(a,'alpha',header=TRUE)
a<-table.element(a,lm1$coefficients[[1]])
a<-table.row.end(a)
a<-table.row.start(a)
a<-table.element(a,'beta',header=TRUE)
a<-table.element(a,lm1$coefficients[[2]])
a<-table.row.end(a)
a<-table.row.start(a)
a<-table.element(a,'S.D.',header=TRUE)
a<-table.element(a,summary(lm1)$coefficients[2,2])
a<-table.row.end(a)
a<-table.row.start(a)
a<-table.element(a,'T-STAT',header=TRUE)
a<-table.element(a,summary(lm1)$coefficients[2,3])
a<-table.row.end(a)
a<-table.row.start(a)
a<-table.element(a,'p-value',header=TRUE)
a<-table.element(a,summary(lm1)$coefficients[2,4])
a<-table.row.end(a)
a<-table.end(a)
table.save(a,file='mytable1.tab')
a<-table.start()
a<-table.row.start(a)
a<-table.element(a,'Regression: ln S.E.(k) = alpha + beta * ln Mean(k)',2,TRUE)
a<-table.row.end(a)
a<-table.row.start(a)
a<-table.element(a,'alpha',header=TRUE)
a<-table.element(a,lnlm1$coefficients[[1]])
a<-table.row.end(a)
a<-table.row.start(a)
a<-table.element(a,'beta',header=TRUE)
a<-table.element(a,lnlm1$coefficients[[2]])
a<-table.row.end(a)
a<-table.row.start(a)
a<-table.element(a,'S.D.',header=TRUE)
a<-table.element(a,summary(lnlm1)$coefficients[2,2])
a<-table.row.end(a)
a<-table.row.start(a)
a<-table.element(a,'T-STAT',header=TRUE)
a<-table.element(a,summary(lnlm1)$coefficients[2,3])
a<-table.row.end(a)
a<-table.row.start(a)
a<-table.element(a,'p-value',header=TRUE)
a<-table.element(a,summary(lnlm1)$coefficients[2,4])
a<-table.row.end(a)
a<-table.row.start(a)
a<-table.element(a,'Lambda',header=TRUE)
a<-table.element(a,1-lnlm1$coefficients[[2]])
a<-table.row.end(a)
a<-table.end(a)
table.save(a,file='mytable2.tab')