| Multiple Linear Regression - Estimated Regression Equation |
| Y(t)[t] = + 20.0671702470839 + 0.688595272943731T.I.P.[t] + 0.278503576120453`Y(t-1)`[t] + 0.193058224490072`Y(t-2)`[t] -0.338193109465919`Y(t-3)`[t] + 0.070699095273498`Y(t-4)`[t] -1.27620287842946M1[t] + 1.02349878003249M2[t] + 12.4875141879310M3[t] + 5.84323690683027M4[t] -6.6780209838056M5[t] -3.98147706592191M6[t] -2.25560893189417M7[t] + 1.76076039900308M8[t] + 8.23238768247252M9[t] + 0.579379111442313M10[t] + 0.792972106293582M11[t] -0.0934952638383165t + e[t] |
| Multiple Linear Regression - Ordinary Least Squares | |||||
| Variable | Parameter | S.D. | T-STAT H0: parameter = 0 | 2-tail p-value | 1-tail p-value |
| (Intercept) | 20.0671702470839 | 12.063566 | 1.6635 | 0.104449 | 0.052225 |
| T.I.P. | 0.688595272943731 | 0.113198 | 6.0831 | 0 | 0 |
| `Y(t-1)` | 0.278503576120453 | 0.11864 | 2.3475 | 0.024212 | 0.012106 |
| `Y(t-2)` | 0.193058224490072 | 0.130147 | 1.4834 | 0.14622 | 0.07311 |
| `Y(t-3)` | -0.338193109465919 | 0.133198 | -2.539 | 0.015332 | 0.007666 |
| `Y(t-4)` | 0.070699095273498 | 0.114835 | 0.6157 | 0.541791 | 0.270895 |
| M1 | -1.27620287842946 | 2.903066 | -0.4396 | 0.662713 | 0.331357 |
| M2 | 1.02349878003249 | 2.811965 | 0.364 | 0.71789 | 0.358945 |
| M3 | 12.4875141879310 | 3.101382 | 4.0264 | 0.000261 | 0.000131 |
| M4 | 5.84323690683027 | 2.680737 | 2.1797 | 0.035544 | 0.017772 |
| M5 | -6.6780209838056 | 2.684944 | -2.4872 | 0.017381 | 0.008691 |
| M6 | -3.98147706592191 | 3.058419 | -1.3018 | 0.200818 | 0.100409 |
| M7 | -2.25560893189417 | 2.598024 | -0.8682 | 0.390734 | 0.195367 |
| M8 | 1.76076039900308 | 2.766272 | 0.6365 | 0.52826 | 0.26413 |
| M9 | 8.23238768247252 | 2.713911 | 3.0334 | 0.004344 | 0.002172 |
| M10 | 0.579379111442313 | 2.706512 | 0.2141 | 0.831638 | 0.415819 |
| M11 | 0.792972106293582 | 3.077052 | 0.2577 | 0.798025 | 0.399013 |
| t | -0.0934952638383165 | 0.035915 | -2.6032 | 0.013099 | 0.00655 |
| Multiple Linear Regression - Regression Statistics | |
| Multiple R | 0.921362250010479 |
| R-squared | 0.848908395744372 |
| Adjusted R-squared | 0.781314783314223 |
| F-TEST (value) | 12.5590032138262 |
| F-TEST (DF numerator) | 17 |
| F-TEST (DF denominator) | 38 |
| p-value | 9.74198499648082e-11 |
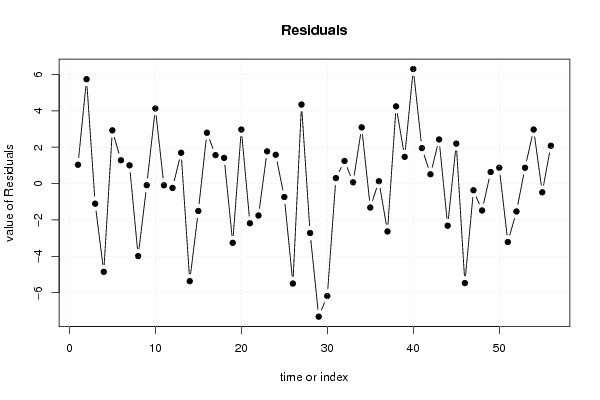
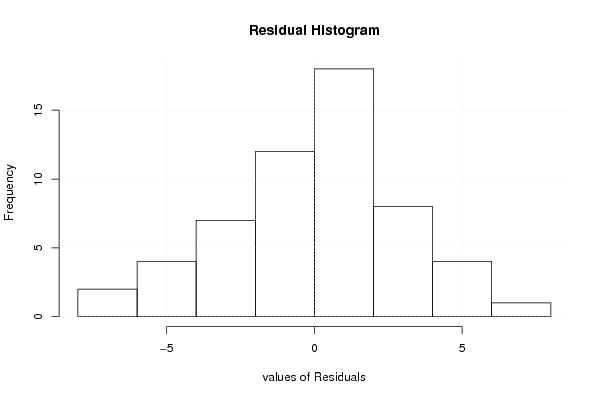
| Multiple Linear Regression - Residual Statistics | |
| Residual Standard Deviation | 3.59658263510853 |
| Sum Squared Residuals | 491.545452744239 |
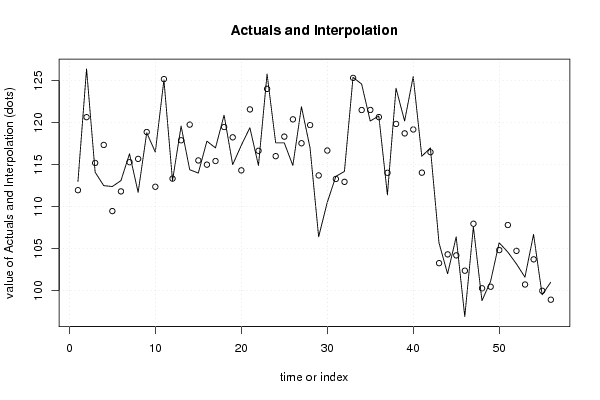
| Multiple Linear Regression - Actuals, Interpolation, and Residuals | |||
| Time or Index | Actuals | Interpolation Forecast | Residuals Prediction Error |
| 1 | 113 | 111.962621185805 | 1.03737881419492 |
| 2 | 126.4 | 120.657651311703 | 5.74234868829665 |
| 3 | 114.1 | 115.203847217153 | -1.10384721715255 |
| 4 | 112.5 | 117.352638178784 | -4.85263817878449 |
| 5 | 112.4 | 109.471642298598 | 2.92835770140159 |
| 6 | 113.1 | 111.818345066454 | 1.28165493354592 |
| 7 | 116.3 | 115.294801012297 | 1.00519898770294 |
| 8 | 111.7 | 115.688858764459 | -3.98885876445923 |
| 9 | 118.8 | 118.887491165437 | -0.0874911654367105 |
| 10 | 116.5 | 112.368178268774 | 4.13182173122608 |
| 11 | 125.1 | 125.191566616575 | -0.0915666165749797 |
| 12 | 113.1 | 113.338599129718 | -0.238599129718491 |
| 13 | 119.6 | 117.902043043916 | 1.69795695608434 |
| 14 | 114.4 | 119.767153111741 | -5.36715311174095 |
| 15 | 114 | 115.503680682146 | -1.50368068214638 |
| 16 | 117.8 | 115.001748206051 | 2.79825179394927 |
| 17 | 117 | 115.433146042634 | 1.56685395736592 |
| 18 | 120.9 | 119.485267001214 | 1.41473299878611 |
| 19 | 115 | 118.257000802004 | -3.25700080200372 |
| 20 | 117.3 | 114.323153419989 | 2.97684658001139 |
| 21 | 119.4 | 121.581668828844 | -2.18166882884439 |
| 22 | 114.9 | 116.653105546511 | -1.75310554651093 |
| 23 | 125.8 | 124.026426827266 | 1.77357317273388 |
| 24 | 117.6 | 116.014128849507 | 1.58587115049293 |
| 25 | 117.6 | 118.338877996084 | -0.73887799608428 |
| 26 | 114.9 | 120.397458784236 | -5.49745878423554 |
| 27 | 121.9 | 117.551519667162 | 4.34848033283803 |
| 28 | 117 | 119.718847061142 | -2.71884706114193 |
| 29 | 106.4 | 113.719296116099 | -7.31929611609895 |
| 30 | 110.5 | 116.683075441909 | -6.18307544190925 |
| 31 | 113.6 | 113.296718714107 | 0.303281285892692 |
| 32 | 114.2 | 112.954596850896 | 1.24540314910410 |
| 33 | 125.4 | 125.330278773907 | 0.0697212260929037 |
| 34 | 124.6 | 121.506367650741 | 3.09363234925947 |
| 35 | 120.2 | 121.516380145983 | -1.31638014598302 |
| 36 | 120.8 | 120.669171639553 | 0.130828360447137 |
| 37 | 111.4 | 114.033022571698 | -2.63302257169836 |
| 38 | 124.1 | 119.851068546932 | 4.2489314530676 |
| 39 | 120.2 | 118.726798981052 | 1.47320101894758 |
| 40 | 125.5 | 119.192798663597 | 6.30720133640251 |
| 41 | 116 | 114.047683041306 | 1.95231695869420 |
| 42 | 117 | 116.487533148657 | 0.512466851343351 |
| 43 | 105.7 | 103.272103561592 | 2.42789643840797 |
| 44 | 102 | 104.316649295843 | -2.31664929584264 |
| 45 | 106.4 | 104.200561231812 | 2.19943876818819 |
| 46 | 96.9 | 102.372348533975 | -5.4723485339746 |
| 47 | 107.6 | 107.965626410176 | -0.365626410175878 |
| 48 | 98.8 | 100.278100381222 | -1.47810038122158 |
| 49 | 101.1 | 100.463435202497 | 0.636564797503383 |
| 50 | 105.7 | 104.826668245388 | 0.873331754612235 |
| 51 | 104.6 | 107.814153452487 | -3.21415345248668 |
| 52 | 103.2 | 104.733967890425 | -1.53396789042537 |
| 53 | 101.6 | 100.728232501363 | 0.871767498637248 |
| 54 | 106.7 | 103.725779341766 | 2.97422065823387 |
| 55 | 99.5 | 99.9793759099999 | -0.479375909999884 |
| 56 | 101 | 98.9167416688136 | 2.08325833118638 |
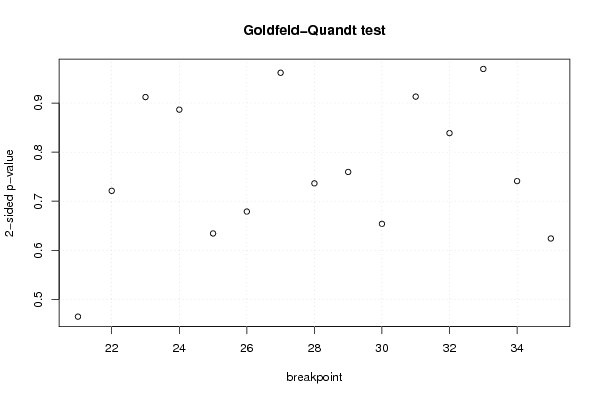
| Goldfeld-Quandt test for Heteroskedasticity | |||
| p-values | Alternative Hypothesis | ||
| breakpoint index | greater | 2-sided | less |
| 21 | 0.767632385557414 | 0.464735228885171 | 0.232367614442586 |
| 22 | 0.639400373962384 | 0.721199252075233 | 0.360599626037616 |
| 23 | 0.543840950643266 | 0.912318098713468 | 0.456159049356734 |
| 24 | 0.443357912549657 | 0.886715825099314 | 0.556642087450343 |
| 25 | 0.31715734359401 | 0.63431468718802 | 0.68284265640599 |
| 26 | 0.339469209753477 | 0.678938419506953 | 0.660530790246523 |
| 27 | 0.480932667311437 | 0.961865334622875 | 0.519067332688563 |
| 28 | 0.368201468635594 | 0.736402937271189 | 0.631798531364406 |
| 29 | 0.379828861778287 | 0.759657723556574 | 0.620171138221713 |
| 30 | 0.673055854083896 | 0.653888291832207 | 0.326944145916103 |
| 31 | 0.543383170803837 | 0.913233658392326 | 0.456616829196163 |
| 32 | 0.41940663153474 | 0.83881326306948 | 0.58059336846526 |
| 33 | 0.515188212428611 | 0.969623575142778 | 0.484811787571389 |
| 34 | 0.370547429943248 | 0.741094859886496 | 0.629452570056752 |
| 35 | 0.312036852928394 | 0.624073705856788 | 0.687963147071606 |
| Meta Analysis of Goldfeld-Quandt test for Heteroskedasticity | |||
| Description | # significant tests | % significant tests | OK/NOK |
| 1% type I error level | 0 | 0 | OK |
| 5% type I error level | 0 | 0 | OK |
| 10% type I error level | 0 | 0 | OK |