Free Statistics

of Irreproducible Research!

Author's title

Author*The author of this computation has been verified*
R Software Modulerwasp_multipleregression.wasp
Title produced by softwareMultiple Regression
Date of computationSat, 18 Dec 2010 12:00:02 +0000
Cite this page as followsStatistical Computations at FreeStatistics.org, Office for Research Development and Education, URL https://freestatistics.org/blog/index.php?v=date/2010/Dec/18/t1292673537o7ysf6dsbokdge4.htm/, Retrieved Tue, 30 Apr 2024 03:58:18 +0000
Statistical Computations at FreeStatistics.org, Office for Research Development and Education, URL https://freestatistics.org/blog/index.php?pk=111862, Retrieved Tue, 30 Apr 2024 03:58:18 +0000
QR Codes:

Original text written by user:
IsPrivate?No (this computation is public)
User-defined keywords
Estimated Impact107
Family? (F = Feedback message, R = changed R code, M = changed R Module, P = changed Parameters, D = changed Data)
-       [Multiple Regression] [4 vertragingen] [2010-12-18 12:00:02] [19046f4a6967f3fb6f5f17d42e7d38f2] [Current]
-    D    [Multiple Regression] [2 vertragingen] [2010-12-18 12:29:41] [0ed8ad64bdfc801eaa95d5097964fc04]
Feedback Forum

Post a new message
Dataseries X:
98,1	113	112,5	116,7	107,5	116,1
113,9	126,4	113	112,5	116,7	107,5
80,9	114,1	126,4	113	112,5	116,7
95,7	112,5	114,1	126,4	113	112,5
113,2	112,4	112,5	114,1	126,4	113
105,9	113,1	112,4	112,5	114,1	126,4
108,8	116,3	113,1	112,4	112,5	114,1
102,3	111,7	116,3	113,1	112,4	112,5
99	118,8	111,7	116,3	113,1	112,4
100,7	116,5	118,8	111,7	116,3	113,1
115,5	125,1	116,5	118,8	111,7	116,3
100,7	113,1	125,1	116,5	118,8	111,7
109,9	119,6	113,1	125,1	116,5	118,8
114,6	114,4	119,6	113,1	125,1	116,5
85,4	114	114,4	119,6	113,1	125,1
100,5	117,8	114	114,4	119,6	113,1
114,8	117	117,8	114	114,4	119,6
116,5	120,9	117	117,8	114	114,4
112,9	115	120,9	117	117,8	114
102	117,3	115	120,9	117	117,8
106	119,4	117,3	115	120,9	117
105,3	114,9	119,4	117,3	115	120,9
118,8	125,8	114,9	119,4	117,3	115
106,1	117,6	125,8	114,9	119,4	117,3
109,3	117,6	117,6	125,8	114,9	119,4
117,2	114,9	117,6	117,6	125,8	114,9
92,5	121,9	114,9	117,6	117,6	125,8
104,2	117	121,9	114,9	117,6	117,6
112,5	106,4	117	121,9	114,9	117,6
122,4	110,5	106,4	117	121,9	114,9
113,3	113,6	110,5	106,4	117	121,9
100	114,2	113,6	110,5	106,4	117
110,7	125,4	114,2	113,6	110,5	106,4
112,8	124,6	125,4	114,2	113,6	110,5
109,8	120,2	124,6	125,4	114,2	113,6
117,3	120,8	120,2	124,6	125,4	114,2
109,1	111,4	120,8	120,2	124,6	125,4
115,9	124,1	111,4	120,8	120,2	124,6
96	120,2	124,1	111,4	120,8	120,2
99,8	125,5	120,2	124,1	111,4	120,8
116,8	116	125,5	120,2	124,1	111,4
115,7	117	116	125,5	120,2	124,1
99,4	105,7	117	116	125,5	120,2
94,3	102	105,7	117	116	125,5
91	106,4	102	105,7	117	116
93,2	96,9	106,4	102	105,7	117
103,1	107,6	96,9	106,4	102	105,7
94,1	98,8	107,6	96,9	106,4	102
91,8	101,1	98,8	107,6	96,9	106,4
102,7	105,7	101,1	98,8	107,6	96,9
82,6	104,6	105,7	101,1	98,8	107,6
89,1	103,2	104,6	105,7	101,1	98,8
104,5	101,6	103,2	104,6	105,7	101,1
105,1	106,7	101,6	103,2	104,6	105,7
95,1	99,5	106,7	101,6	103,2	104,6
88,7	101	99,5	106,7	101,6	103,2


Summary of computational transaction
Raw Inputview raw input (R code)
Raw Outputview raw output of R engine
Computing time6 seconds
R Server'Gwilym Jenkins' @ 72.249.127.135

\begin{tabular}{lllllllll}
\hline
Summary of computational transaction \tabularnewline
Raw Input & view raw input (R code)  \tabularnewline
Raw Output & view raw output of R engine  \tabularnewline
Computing time & 6 seconds \tabularnewline
R Server & 'Gwilym Jenkins' @ 72.249.127.135 \tabularnewline
\hline
\end{tabular}
%Source: https://freestatistics.org/blog/index.php?pk=111862&T=0

[TABLE]
[ROW][C]Summary of computational transaction[/C][/ROW]
[ROW][C]Raw Input[/C][C]view raw input (R code) [/C][/ROW]
[ROW][C]Raw Output[/C][C]view raw output of R engine [/C][/ROW]
[ROW][C]Computing time[/C][C]6 seconds[/C][/ROW]
[ROW][C]R Server[/C][C]'Gwilym Jenkins' @ 72.249.127.135[/C][/ROW]
[/TABLE]
Source: https://freestatistics.org/blog/index.php?pk=111862&T=0

Globally Unique Identifier (entire table): ba.freestatistics.org/blog/index.php?pk=111862&T=0

As an alternative you can also use a QR Code:  

The GUIDs for individual cells are displayed in the table below:

Summary of computational transaction
Raw Inputview raw input (R code)
Raw Outputview raw output of R engine
Computing time6 seconds
R Server'Gwilym Jenkins' @ 72.249.127.135


Multiple Linear Regression - Estimated Regression Equation
Y(t)[t] = + 20.0671702470839 + 0.688595272943731T.I.P.[t] + 0.278503576120453`Y(t-1)`[t] + 0.193058224490072`Y(t-2)`[t] -0.338193109465919`Y(t-3)`[t] + 0.070699095273498`Y(t-4)`[t] -1.27620287842946M1[t] + 1.02349878003249M2[t] + 12.4875141879310M3[t] + 5.84323690683027M4[t] -6.6780209838056M5[t] -3.98147706592191M6[t] -2.25560893189417M7[t] + 1.76076039900308M8[t] + 8.23238768247252M9[t] + 0.579379111442313M10[t] + 0.792972106293582M11[t] -0.0934952638383165t + e[t]

\begin{tabular}{lllllllll}
\hline
Multiple Linear Regression - Estimated Regression Equation \tabularnewline
Y(t)[t] =  +  20.0671702470839 +  0.688595272943731T.I.P.[t] +  0.278503576120453`Y(t-1)`[t] +  0.193058224490072`Y(t-2)`[t] -0.338193109465919`Y(t-3)`[t] +  0.070699095273498`Y(t-4)`[t] -1.27620287842946M1[t] +  1.02349878003249M2[t] +  12.4875141879310M3[t] +  5.84323690683027M4[t] -6.6780209838056M5[t] -3.98147706592191M6[t] -2.25560893189417M7[t] +  1.76076039900308M8[t] +  8.23238768247252M9[t] +  0.579379111442313M10[t] +  0.792972106293582M11[t] -0.0934952638383165t  + e[t] \tabularnewline
\hline
\end{tabular}
%Source: https://freestatistics.org/blog/index.php?pk=111862&T=1

[TABLE]
[ROW][C]Multiple Linear Regression - Estimated Regression Equation[/C][/ROW]
[ROW][C]Y(t)[t] =  +  20.0671702470839 +  0.688595272943731T.I.P.[t] +  0.278503576120453`Y(t-1)`[t] +  0.193058224490072`Y(t-2)`[t] -0.338193109465919`Y(t-3)`[t] +  0.070699095273498`Y(t-4)`[t] -1.27620287842946M1[t] +  1.02349878003249M2[t] +  12.4875141879310M3[t] +  5.84323690683027M4[t] -6.6780209838056M5[t] -3.98147706592191M6[t] -2.25560893189417M7[t] +  1.76076039900308M8[t] +  8.23238768247252M9[t] +  0.579379111442313M10[t] +  0.792972106293582M11[t] -0.0934952638383165t  + e[t][/C][/ROW]
[/TABLE]
Source: https://freestatistics.org/blog/index.php?pk=111862&T=1

Globally Unique Identifier (entire table): ba.freestatistics.org/blog/index.php?pk=111862&T=1

As an alternative you can also use a QR Code:  

The GUIDs for individual cells are displayed in the table below:

Multiple Linear Regression - Estimated Regression Equation
Y(t)[t] = + 20.0671702470839 + 0.688595272943731T.I.P.[t] + 0.278503576120453`Y(t-1)`[t] + 0.193058224490072`Y(t-2)`[t] -0.338193109465919`Y(t-3)`[t] + 0.070699095273498`Y(t-4)`[t] -1.27620287842946M1[t] + 1.02349878003249M2[t] + 12.4875141879310M3[t] + 5.84323690683027M4[t] -6.6780209838056M5[t] -3.98147706592191M6[t] -2.25560893189417M7[t] + 1.76076039900308M8[t] + 8.23238768247252M9[t] + 0.579379111442313M10[t] + 0.792972106293582M11[t] -0.0934952638383165t + e[t]


Multiple Linear Regression - Ordinary Least Squares
VariableParameterS.D.T-STATH0: parameter = 02-tail p-value1-tail p-value
(Intercept)20.067170247083912.0635661.66350.1044490.052225
T.I.P.0.6885952729437310.1131986.083100
`Y(t-1)`0.2785035761204530.118642.34750.0242120.012106
`Y(t-2)`0.1930582244900720.1301471.48340.146220.07311
`Y(t-3)`-0.3381931094659190.133198-2.5390.0153320.007666
`Y(t-4)`0.0706990952734980.1148350.61570.5417910.270895
M1-1.276202878429462.903066-0.43960.6627130.331357
M21.023498780032492.8119650.3640.717890.358945
M312.48751418793103.1013824.02640.0002610.000131
M45.843236906830272.6807372.17970.0355440.017772
M5-6.67802098380562.684944-2.48720.0173810.008691
M6-3.981477065921913.058419-1.30180.2008180.100409
M7-2.255608931894172.598024-0.86820.3907340.195367
M81.760760399003082.7662720.63650.528260.26413
M98.232387682472522.7139113.03340.0043440.002172
M100.5793791114423132.7065120.21410.8316380.415819
M110.7929721062935823.0770520.25770.7980250.399013
t-0.09349526383831650.035915-2.60320.0130990.00655

\begin{tabular}{lllllllll}
\hline
Multiple Linear Regression - Ordinary Least Squares \tabularnewline
Variable & Parameter & S.D. & T-STATH0: parameter = 0 & 2-tail p-value & 1-tail p-value \tabularnewline
(Intercept) & 20.0671702470839 & 12.063566 & 1.6635 & 0.104449 & 0.052225 \tabularnewline
T.I.P. & 0.688595272943731 & 0.113198 & 6.0831 & 0 & 0 \tabularnewline
`Y(t-1)` & 0.278503576120453 & 0.11864 & 2.3475 & 0.024212 & 0.012106 \tabularnewline
`Y(t-2)` & 0.193058224490072 & 0.130147 & 1.4834 & 0.14622 & 0.07311 \tabularnewline
`Y(t-3)` & -0.338193109465919 & 0.133198 & -2.539 & 0.015332 & 0.007666 \tabularnewline
`Y(t-4)` & 0.070699095273498 & 0.114835 & 0.6157 & 0.541791 & 0.270895 \tabularnewline
M1 & -1.27620287842946 & 2.903066 & -0.4396 & 0.662713 & 0.331357 \tabularnewline
M2 & 1.02349878003249 & 2.811965 & 0.364 & 0.71789 & 0.358945 \tabularnewline
M3 & 12.4875141879310 & 3.101382 & 4.0264 & 0.000261 & 0.000131 \tabularnewline
M4 & 5.84323690683027 & 2.680737 & 2.1797 & 0.035544 & 0.017772 \tabularnewline
M5 & -6.6780209838056 & 2.684944 & -2.4872 & 0.017381 & 0.008691 \tabularnewline
M6 & -3.98147706592191 & 3.058419 & -1.3018 & 0.200818 & 0.100409 \tabularnewline
M7 & -2.25560893189417 & 2.598024 & -0.8682 & 0.390734 & 0.195367 \tabularnewline
M8 & 1.76076039900308 & 2.766272 & 0.6365 & 0.52826 & 0.26413 \tabularnewline
M9 & 8.23238768247252 & 2.713911 & 3.0334 & 0.004344 & 0.002172 \tabularnewline
M10 & 0.579379111442313 & 2.706512 & 0.2141 & 0.831638 & 0.415819 \tabularnewline
M11 & 0.792972106293582 & 3.077052 & 0.2577 & 0.798025 & 0.399013 \tabularnewline
t & -0.0934952638383165 & 0.035915 & -2.6032 & 0.013099 & 0.00655 \tabularnewline
\hline
\end{tabular}
%Source: https://freestatistics.org/blog/index.php?pk=111862&T=2

[TABLE]
[ROW][C]Multiple Linear Regression - Ordinary Least Squares[/C][/ROW]
[ROW][C]Variable[/C][C]Parameter[/C][C]S.D.[/C][C]T-STATH0: parameter = 0[/C][C]2-tail p-value[/C][C]1-tail p-value[/C][/ROW]
[ROW][C](Intercept)[/C][C]20.0671702470839[/C][C]12.063566[/C][C]1.6635[/C][C]0.104449[/C][C]0.052225[/C][/ROW]
[ROW][C]T.I.P.[/C][C]0.688595272943731[/C][C]0.113198[/C][C]6.0831[/C][C]0[/C][C]0[/C][/ROW]
[ROW][C]`Y(t-1)`[/C][C]0.278503576120453[/C][C]0.11864[/C][C]2.3475[/C][C]0.024212[/C][C]0.012106[/C][/ROW]
[ROW][C]`Y(t-2)`[/C][C]0.193058224490072[/C][C]0.130147[/C][C]1.4834[/C][C]0.14622[/C][C]0.07311[/C][/ROW]
[ROW][C]`Y(t-3)`[/C][C]-0.338193109465919[/C][C]0.133198[/C][C]-2.539[/C][C]0.015332[/C][C]0.007666[/C][/ROW]
[ROW][C]`Y(t-4)`[/C][C]0.070699095273498[/C][C]0.114835[/C][C]0.6157[/C][C]0.541791[/C][C]0.270895[/C][/ROW]
[ROW][C]M1[/C][C]-1.27620287842946[/C][C]2.903066[/C][C]-0.4396[/C][C]0.662713[/C][C]0.331357[/C][/ROW]
[ROW][C]M2[/C][C]1.02349878003249[/C][C]2.811965[/C][C]0.364[/C][C]0.71789[/C][C]0.358945[/C][/ROW]
[ROW][C]M3[/C][C]12.4875141879310[/C][C]3.101382[/C][C]4.0264[/C][C]0.000261[/C][C]0.000131[/C][/ROW]
[ROW][C]M4[/C][C]5.84323690683027[/C][C]2.680737[/C][C]2.1797[/C][C]0.035544[/C][C]0.017772[/C][/ROW]
[ROW][C]M5[/C][C]-6.6780209838056[/C][C]2.684944[/C][C]-2.4872[/C][C]0.017381[/C][C]0.008691[/C][/ROW]
[ROW][C]M6[/C][C]-3.98147706592191[/C][C]3.058419[/C][C]-1.3018[/C][C]0.200818[/C][C]0.100409[/C][/ROW]
[ROW][C]M7[/C][C]-2.25560893189417[/C][C]2.598024[/C][C]-0.8682[/C][C]0.390734[/C][C]0.195367[/C][/ROW]
[ROW][C]M8[/C][C]1.76076039900308[/C][C]2.766272[/C][C]0.6365[/C][C]0.52826[/C][C]0.26413[/C][/ROW]
[ROW][C]M9[/C][C]8.23238768247252[/C][C]2.713911[/C][C]3.0334[/C][C]0.004344[/C][C]0.002172[/C][/ROW]
[ROW][C]M10[/C][C]0.579379111442313[/C][C]2.706512[/C][C]0.2141[/C][C]0.831638[/C][C]0.415819[/C][/ROW]
[ROW][C]M11[/C][C]0.792972106293582[/C][C]3.077052[/C][C]0.2577[/C][C]0.798025[/C][C]0.399013[/C][/ROW]
[ROW][C]t[/C][C]-0.0934952638383165[/C][C]0.035915[/C][C]-2.6032[/C][C]0.013099[/C][C]0.00655[/C][/ROW]
[/TABLE]
Source: https://freestatistics.org/blog/index.php?pk=111862&T=2

Globally Unique Identifier (entire table): ba.freestatistics.org/blog/index.php?pk=111862&T=2

As an alternative you can also use a QR Code:  

The GUIDs for individual cells are displayed in the table below:

Multiple Linear Regression - Ordinary Least Squares
VariableParameterS.D.T-STATH0: parameter = 02-tail p-value1-tail p-value
(Intercept)20.067170247083912.0635661.66350.1044490.052225
T.I.P.0.6885952729437310.1131986.083100
`Y(t-1)`0.2785035761204530.118642.34750.0242120.012106
`Y(t-2)`0.1930582244900720.1301471.48340.146220.07311
`Y(t-3)`-0.3381931094659190.133198-2.5390.0153320.007666
`Y(t-4)`0.0706990952734980.1148350.61570.5417910.270895
M1-1.276202878429462.903066-0.43960.6627130.331357
M21.023498780032492.8119650.3640.717890.358945
M312.48751418793103.1013824.02640.0002610.000131
M45.843236906830272.6807372.17970.0355440.017772
M5-6.67802098380562.684944-2.48720.0173810.008691
M6-3.981477065921913.058419-1.30180.2008180.100409
M7-2.255608931894172.598024-0.86820.3907340.195367
M81.760760399003082.7662720.63650.528260.26413
M98.232387682472522.7139113.03340.0043440.002172
M100.5793791114423132.7065120.21410.8316380.415819
M110.7929721062935823.0770520.25770.7980250.399013
t-0.09349526383831650.035915-2.60320.0130990.00655


Multiple Linear Regression - Regression Statistics
Multiple R0.921362250010479
R-squared0.848908395744372
Adjusted R-squared0.781314783314223
F-TEST (value)12.5590032138262
F-TEST (DF numerator)17
F-TEST (DF denominator)38
p-value9.74198499648082e-11
Multiple Linear Regression - Residual Statistics
Residual Standard Deviation3.59658263510853
Sum Squared Residuals491.545452744239

\begin{tabular}{lllllllll}
\hline
Multiple Linear Regression - Regression Statistics \tabularnewline
Multiple R & 0.921362250010479 \tabularnewline
R-squared & 0.848908395744372 \tabularnewline
Adjusted R-squared & 0.781314783314223 \tabularnewline
F-TEST (value) & 12.5590032138262 \tabularnewline
F-TEST (DF numerator) & 17 \tabularnewline
F-TEST (DF denominator) & 38 \tabularnewline
p-value & 9.74198499648082e-11 \tabularnewline
Multiple Linear Regression - Residual Statistics \tabularnewline
Residual Standard Deviation & 3.59658263510853 \tabularnewline
Sum Squared Residuals & 491.545452744239 \tabularnewline
\hline
\end{tabular}
%Source: https://freestatistics.org/blog/index.php?pk=111862&T=3

[TABLE]
[ROW][C]Multiple Linear Regression - Regression Statistics[/C][/ROW]
[ROW][C]Multiple R[/C][C]0.921362250010479[/C][/ROW]
[ROW][C]R-squared[/C][C]0.848908395744372[/C][/ROW]
[ROW][C]Adjusted R-squared[/C][C]0.781314783314223[/C][/ROW]
[ROW][C]F-TEST (value)[/C][C]12.5590032138262[/C][/ROW]
[ROW][C]F-TEST (DF numerator)[/C][C]17[/C][/ROW]
[ROW][C]F-TEST (DF denominator)[/C][C]38[/C][/ROW]
[ROW][C]p-value[/C][C]9.74198499648082e-11[/C][/ROW]
[ROW][C]Multiple Linear Regression - Residual Statistics[/C][/ROW]
[ROW][C]Residual Standard Deviation[/C][C]3.59658263510853[/C][/ROW]
[ROW][C]Sum Squared Residuals[/C][C]491.545452744239[/C][/ROW]
[/TABLE]
Source: https://freestatistics.org/blog/index.php?pk=111862&T=3

Globally Unique Identifier (entire table): ba.freestatistics.org/blog/index.php?pk=111862&T=3

As an alternative you can also use a QR Code:  

The GUIDs for individual cells are displayed in the table below:

Multiple Linear Regression - Regression Statistics
Multiple R0.921362250010479
R-squared0.848908395744372
Adjusted R-squared0.781314783314223
F-TEST (value)12.5590032138262
F-TEST (DF numerator)17
F-TEST (DF denominator)38
p-value9.74198499648082e-11
Multiple Linear Regression - Residual Statistics
Residual Standard Deviation3.59658263510853
Sum Squared Residuals491.545452744239


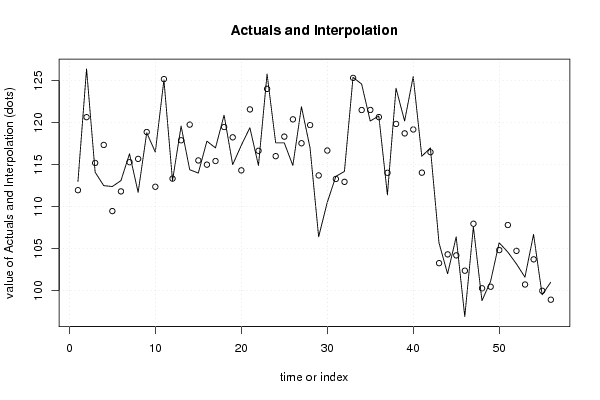
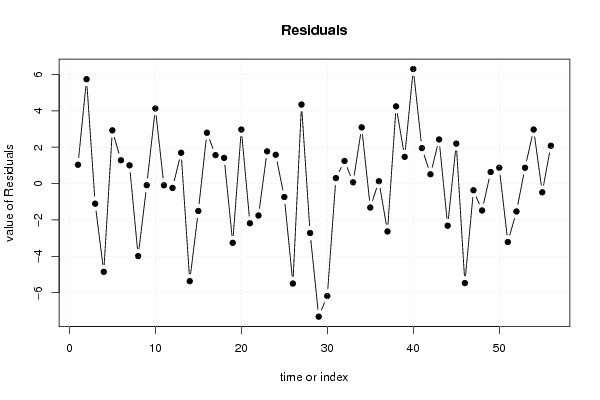
Multiple Linear Regression - Actuals, Interpolation, and Residuals
Time or IndexActualsInterpolationForecastResidualsPrediction Error
1113111.9626211858051.03737881419492
2126.4120.6576513117035.74234868829665
3114.1115.203847217153-1.10384721715255
4112.5117.352638178784-4.85263817878449
5112.4109.4716422985982.92835770140159
6113.1111.8183450664541.28165493354592
7116.3115.2948010122971.00519898770294
8111.7115.688858764459-3.98885876445923
9118.8118.887491165437-0.0874911654367105
10116.5112.3681782687744.13182173122608
11125.1125.191566616575-0.0915666165749797
12113.1113.338599129718-0.238599129718491
13119.6117.9020430439161.69795695608434
14114.4119.767153111741-5.36715311174095
15114115.503680682146-1.50368068214638
16117.8115.0017482060512.79825179394927
17117115.4331460426341.56685395736592
18120.9119.4852670012141.41473299878611
19115118.257000802004-3.25700080200372
20117.3114.3231534199892.97684658001139
21119.4121.581668828844-2.18166882884439
22114.9116.653105546511-1.75310554651093
23125.8124.0264268272661.77357317273388
24117.6116.0141288495071.58587115049293
25117.6118.338877996084-0.73887799608428
26114.9120.397458784236-5.49745878423554
27121.9117.5515196671624.34848033283803
28117119.718847061142-2.71884706114193
29106.4113.719296116099-7.31929611609895
30110.5116.683075441909-6.18307544190925
31113.6113.2967187141070.303281285892692
32114.2112.9545968508961.24540314910410
33125.4125.3302787739070.0697212260929037
34124.6121.5063676507413.09363234925947
35120.2121.516380145983-1.31638014598302
36120.8120.6691716395530.130828360447137
37111.4114.033022571698-2.63302257169836
38124.1119.8510685469324.2489314530676
39120.2118.7267989810521.47320101894758
40125.5119.1927986635976.30720133640251
41116114.0476830413061.95231695869420
42117116.4875331486570.512466851343351
43105.7103.2721035615922.42789643840797
44102104.316649295843-2.31664929584264
45106.4104.2005612318122.19943876818819
4696.9102.372348533975-5.4723485339746
47107.6107.965626410176-0.365626410175878
4898.8100.278100381222-1.47810038122158
49101.1100.4634352024970.636564797503383
50105.7104.8266682453880.873331754612235
51104.6107.814153452487-3.21415345248668
52103.2104.733967890425-1.53396789042537
53101.6100.7282325013630.871767498637248
54106.7103.7257793417662.97422065823387
5599.599.9793759099999-0.479375909999884
5610198.91674166881362.08325833118638

\begin{tabular}{lllllllll}
\hline
Multiple Linear Regression - Actuals, Interpolation, and Residuals \tabularnewline
Time or Index & Actuals & InterpolationForecast & ResidualsPrediction Error \tabularnewline
1 & 113 & 111.962621185805 & 1.03737881419492 \tabularnewline
2 & 126.4 & 120.657651311703 & 5.74234868829665 \tabularnewline
3 & 114.1 & 115.203847217153 & -1.10384721715255 \tabularnewline
4 & 112.5 & 117.352638178784 & -4.85263817878449 \tabularnewline
5 & 112.4 & 109.471642298598 & 2.92835770140159 \tabularnewline
6 & 113.1 & 111.818345066454 & 1.28165493354592 \tabularnewline
7 & 116.3 & 115.294801012297 & 1.00519898770294 \tabularnewline
8 & 111.7 & 115.688858764459 & -3.98885876445923 \tabularnewline
9 & 118.8 & 118.887491165437 & -0.0874911654367105 \tabularnewline
10 & 116.5 & 112.368178268774 & 4.13182173122608 \tabularnewline
11 & 125.1 & 125.191566616575 & -0.0915666165749797 \tabularnewline
12 & 113.1 & 113.338599129718 & -0.238599129718491 \tabularnewline
13 & 119.6 & 117.902043043916 & 1.69795695608434 \tabularnewline
14 & 114.4 & 119.767153111741 & -5.36715311174095 \tabularnewline
15 & 114 & 115.503680682146 & -1.50368068214638 \tabularnewline
16 & 117.8 & 115.001748206051 & 2.79825179394927 \tabularnewline
17 & 117 & 115.433146042634 & 1.56685395736592 \tabularnewline
18 & 120.9 & 119.485267001214 & 1.41473299878611 \tabularnewline
19 & 115 & 118.257000802004 & -3.25700080200372 \tabularnewline
20 & 117.3 & 114.323153419989 & 2.97684658001139 \tabularnewline
21 & 119.4 & 121.581668828844 & -2.18166882884439 \tabularnewline
22 & 114.9 & 116.653105546511 & -1.75310554651093 \tabularnewline
23 & 125.8 & 124.026426827266 & 1.77357317273388 \tabularnewline
24 & 117.6 & 116.014128849507 & 1.58587115049293 \tabularnewline
25 & 117.6 & 118.338877996084 & -0.73887799608428 \tabularnewline
26 & 114.9 & 120.397458784236 & -5.49745878423554 \tabularnewline
27 & 121.9 & 117.551519667162 & 4.34848033283803 \tabularnewline
28 & 117 & 119.718847061142 & -2.71884706114193 \tabularnewline
29 & 106.4 & 113.719296116099 & -7.31929611609895 \tabularnewline
30 & 110.5 & 116.683075441909 & -6.18307544190925 \tabularnewline
31 & 113.6 & 113.296718714107 & 0.303281285892692 \tabularnewline
32 & 114.2 & 112.954596850896 & 1.24540314910410 \tabularnewline
33 & 125.4 & 125.330278773907 & 0.0697212260929037 \tabularnewline
34 & 124.6 & 121.506367650741 & 3.09363234925947 \tabularnewline
35 & 120.2 & 121.516380145983 & -1.31638014598302 \tabularnewline
36 & 120.8 & 120.669171639553 & 0.130828360447137 \tabularnewline
37 & 111.4 & 114.033022571698 & -2.63302257169836 \tabularnewline
38 & 124.1 & 119.851068546932 & 4.2489314530676 \tabularnewline
39 & 120.2 & 118.726798981052 & 1.47320101894758 \tabularnewline
40 & 125.5 & 119.192798663597 & 6.30720133640251 \tabularnewline
41 & 116 & 114.047683041306 & 1.95231695869420 \tabularnewline
42 & 117 & 116.487533148657 & 0.512466851343351 \tabularnewline
43 & 105.7 & 103.272103561592 & 2.42789643840797 \tabularnewline
44 & 102 & 104.316649295843 & -2.31664929584264 \tabularnewline
45 & 106.4 & 104.200561231812 & 2.19943876818819 \tabularnewline
46 & 96.9 & 102.372348533975 & -5.4723485339746 \tabularnewline
47 & 107.6 & 107.965626410176 & -0.365626410175878 \tabularnewline
48 & 98.8 & 100.278100381222 & -1.47810038122158 \tabularnewline
49 & 101.1 & 100.463435202497 & 0.636564797503383 \tabularnewline
50 & 105.7 & 104.826668245388 & 0.873331754612235 \tabularnewline
51 & 104.6 & 107.814153452487 & -3.21415345248668 \tabularnewline
52 & 103.2 & 104.733967890425 & -1.53396789042537 \tabularnewline
53 & 101.6 & 100.728232501363 & 0.871767498637248 \tabularnewline
54 & 106.7 & 103.725779341766 & 2.97422065823387 \tabularnewline
55 & 99.5 & 99.9793759099999 & -0.479375909999884 \tabularnewline
56 & 101 & 98.9167416688136 & 2.08325833118638 \tabularnewline
\hline
\end{tabular}
%Source: https://freestatistics.org/blog/index.php?pk=111862&T=4

[TABLE]
[ROW][C]Multiple Linear Regression - Actuals, Interpolation, and Residuals[/C][/ROW]
[ROW][C]Time or Index[/C][C]Actuals[/C][C]InterpolationForecast[/C][C]ResidualsPrediction Error[/C][/ROW]
[ROW][C]1[/C][C]113[/C][C]111.962621185805[/C][C]1.03737881419492[/C][/ROW]
[ROW][C]2[/C][C]126.4[/C][C]120.657651311703[/C][C]5.74234868829665[/C][/ROW]
[ROW][C]3[/C][C]114.1[/C][C]115.203847217153[/C][C]-1.10384721715255[/C][/ROW]
[ROW][C]4[/C][C]112.5[/C][C]117.352638178784[/C][C]-4.85263817878449[/C][/ROW]
[ROW][C]5[/C][C]112.4[/C][C]109.471642298598[/C][C]2.92835770140159[/C][/ROW]
[ROW][C]6[/C][C]113.1[/C][C]111.818345066454[/C][C]1.28165493354592[/C][/ROW]
[ROW][C]7[/C][C]116.3[/C][C]115.294801012297[/C][C]1.00519898770294[/C][/ROW]
[ROW][C]8[/C][C]111.7[/C][C]115.688858764459[/C][C]-3.98885876445923[/C][/ROW]
[ROW][C]9[/C][C]118.8[/C][C]118.887491165437[/C][C]-0.0874911654367105[/C][/ROW]
[ROW][C]10[/C][C]116.5[/C][C]112.368178268774[/C][C]4.13182173122608[/C][/ROW]
[ROW][C]11[/C][C]125.1[/C][C]125.191566616575[/C][C]-0.0915666165749797[/C][/ROW]
[ROW][C]12[/C][C]113.1[/C][C]113.338599129718[/C][C]-0.238599129718491[/C][/ROW]
[ROW][C]13[/C][C]119.6[/C][C]117.902043043916[/C][C]1.69795695608434[/C][/ROW]
[ROW][C]14[/C][C]114.4[/C][C]119.767153111741[/C][C]-5.36715311174095[/C][/ROW]
[ROW][C]15[/C][C]114[/C][C]115.503680682146[/C][C]-1.50368068214638[/C][/ROW]
[ROW][C]16[/C][C]117.8[/C][C]115.001748206051[/C][C]2.79825179394927[/C][/ROW]
[ROW][C]17[/C][C]117[/C][C]115.433146042634[/C][C]1.56685395736592[/C][/ROW]
[ROW][C]18[/C][C]120.9[/C][C]119.485267001214[/C][C]1.41473299878611[/C][/ROW]
[ROW][C]19[/C][C]115[/C][C]118.257000802004[/C][C]-3.25700080200372[/C][/ROW]
[ROW][C]20[/C][C]117.3[/C][C]114.323153419989[/C][C]2.97684658001139[/C][/ROW]
[ROW][C]21[/C][C]119.4[/C][C]121.581668828844[/C][C]-2.18166882884439[/C][/ROW]
[ROW][C]22[/C][C]114.9[/C][C]116.653105546511[/C][C]-1.75310554651093[/C][/ROW]
[ROW][C]23[/C][C]125.8[/C][C]124.026426827266[/C][C]1.77357317273388[/C][/ROW]
[ROW][C]24[/C][C]117.6[/C][C]116.014128849507[/C][C]1.58587115049293[/C][/ROW]
[ROW][C]25[/C][C]117.6[/C][C]118.338877996084[/C][C]-0.73887799608428[/C][/ROW]
[ROW][C]26[/C][C]114.9[/C][C]120.397458784236[/C][C]-5.49745878423554[/C][/ROW]
[ROW][C]27[/C][C]121.9[/C][C]117.551519667162[/C][C]4.34848033283803[/C][/ROW]
[ROW][C]28[/C][C]117[/C][C]119.718847061142[/C][C]-2.71884706114193[/C][/ROW]
[ROW][C]29[/C][C]106.4[/C][C]113.719296116099[/C][C]-7.31929611609895[/C][/ROW]
[ROW][C]30[/C][C]110.5[/C][C]116.683075441909[/C][C]-6.18307544190925[/C][/ROW]
[ROW][C]31[/C][C]113.6[/C][C]113.296718714107[/C][C]0.303281285892692[/C][/ROW]
[ROW][C]32[/C][C]114.2[/C][C]112.954596850896[/C][C]1.24540314910410[/C][/ROW]
[ROW][C]33[/C][C]125.4[/C][C]125.330278773907[/C][C]0.0697212260929037[/C][/ROW]
[ROW][C]34[/C][C]124.6[/C][C]121.506367650741[/C][C]3.09363234925947[/C][/ROW]
[ROW][C]35[/C][C]120.2[/C][C]121.516380145983[/C][C]-1.31638014598302[/C][/ROW]
[ROW][C]36[/C][C]120.8[/C][C]120.669171639553[/C][C]0.130828360447137[/C][/ROW]
[ROW][C]37[/C][C]111.4[/C][C]114.033022571698[/C][C]-2.63302257169836[/C][/ROW]
[ROW][C]38[/C][C]124.1[/C][C]119.851068546932[/C][C]4.2489314530676[/C][/ROW]
[ROW][C]39[/C][C]120.2[/C][C]118.726798981052[/C][C]1.47320101894758[/C][/ROW]
[ROW][C]40[/C][C]125.5[/C][C]119.192798663597[/C][C]6.30720133640251[/C][/ROW]
[ROW][C]41[/C][C]116[/C][C]114.047683041306[/C][C]1.95231695869420[/C][/ROW]
[ROW][C]42[/C][C]117[/C][C]116.487533148657[/C][C]0.512466851343351[/C][/ROW]
[ROW][C]43[/C][C]105.7[/C][C]103.272103561592[/C][C]2.42789643840797[/C][/ROW]
[ROW][C]44[/C][C]102[/C][C]104.316649295843[/C][C]-2.31664929584264[/C][/ROW]
[ROW][C]45[/C][C]106.4[/C][C]104.200561231812[/C][C]2.19943876818819[/C][/ROW]
[ROW][C]46[/C][C]96.9[/C][C]102.372348533975[/C][C]-5.4723485339746[/C][/ROW]
[ROW][C]47[/C][C]107.6[/C][C]107.965626410176[/C][C]-0.365626410175878[/C][/ROW]
[ROW][C]48[/C][C]98.8[/C][C]100.278100381222[/C][C]-1.47810038122158[/C][/ROW]
[ROW][C]49[/C][C]101.1[/C][C]100.463435202497[/C][C]0.636564797503383[/C][/ROW]
[ROW][C]50[/C][C]105.7[/C][C]104.826668245388[/C][C]0.873331754612235[/C][/ROW]
[ROW][C]51[/C][C]104.6[/C][C]107.814153452487[/C][C]-3.21415345248668[/C][/ROW]
[ROW][C]52[/C][C]103.2[/C][C]104.733967890425[/C][C]-1.53396789042537[/C][/ROW]
[ROW][C]53[/C][C]101.6[/C][C]100.728232501363[/C][C]0.871767498637248[/C][/ROW]
[ROW][C]54[/C][C]106.7[/C][C]103.725779341766[/C][C]2.97422065823387[/C][/ROW]
[ROW][C]55[/C][C]99.5[/C][C]99.9793759099999[/C][C]-0.479375909999884[/C][/ROW]
[ROW][C]56[/C][C]101[/C][C]98.9167416688136[/C][C]2.08325833118638[/C][/ROW]
[/TABLE]
Source: https://freestatistics.org/blog/index.php?pk=111862&T=4

Globally Unique Identifier (entire table): ba.freestatistics.org/blog/index.php?pk=111862&T=4

As an alternative you can also use a QR Code:  

The GUIDs for individual cells are displayed in the table below:

Multiple Linear Regression - Actuals, Interpolation, and Residuals
Time or IndexActualsInterpolationForecastResidualsPrediction Error
1113111.9626211858051.03737881419492
2126.4120.6576513117035.74234868829665
3114.1115.203847217153-1.10384721715255
4112.5117.352638178784-4.85263817878449
5112.4109.4716422985982.92835770140159
6113.1111.8183450664541.28165493354592
7116.3115.2948010122971.00519898770294
8111.7115.688858764459-3.98885876445923
9118.8118.887491165437-0.0874911654367105
10116.5112.3681782687744.13182173122608
11125.1125.191566616575-0.0915666165749797
12113.1113.338599129718-0.238599129718491
13119.6117.9020430439161.69795695608434
14114.4119.767153111741-5.36715311174095
15114115.503680682146-1.50368068214638
16117.8115.0017482060512.79825179394927
17117115.4331460426341.56685395736592
18120.9119.4852670012141.41473299878611
19115118.257000802004-3.25700080200372
20117.3114.3231534199892.97684658001139
21119.4121.581668828844-2.18166882884439
22114.9116.653105546511-1.75310554651093
23125.8124.0264268272661.77357317273388
24117.6116.0141288495071.58587115049293
25117.6118.338877996084-0.73887799608428
26114.9120.397458784236-5.49745878423554
27121.9117.5515196671624.34848033283803
28117119.718847061142-2.71884706114193
29106.4113.719296116099-7.31929611609895
30110.5116.683075441909-6.18307544190925
31113.6113.2967187141070.303281285892692
32114.2112.9545968508961.24540314910410
33125.4125.3302787739070.0697212260929037
34124.6121.5063676507413.09363234925947
35120.2121.516380145983-1.31638014598302
36120.8120.6691716395530.130828360447137
37111.4114.033022571698-2.63302257169836
38124.1119.8510685469324.2489314530676
39120.2118.7267989810521.47320101894758
40125.5119.1927986635976.30720133640251
41116114.0476830413061.95231695869420
42117116.4875331486570.512466851343351
43105.7103.2721035615922.42789643840797
44102104.316649295843-2.31664929584264
45106.4104.2005612318122.19943876818819
4696.9102.372348533975-5.4723485339746
47107.6107.965626410176-0.365626410175878
4898.8100.278100381222-1.47810038122158
49101.1100.4634352024970.636564797503383
50105.7104.8266682453880.873331754612235
51104.6107.814153452487-3.21415345248668
52103.2104.733967890425-1.53396789042537
53101.6100.7282325013630.871767498637248
54106.7103.7257793417662.97422065823387
5599.599.9793759099999-0.479375909999884
5610198.91674166881362.08325833118638


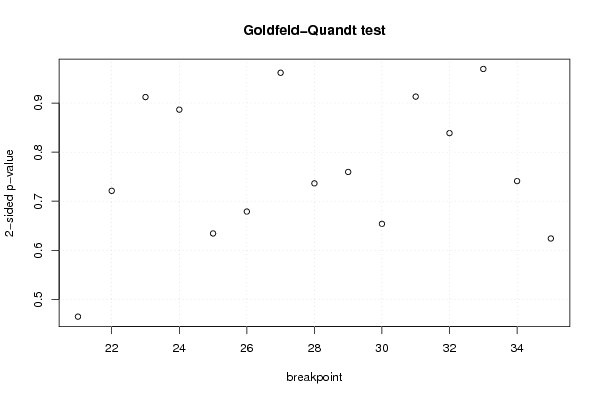
Goldfeld-Quandt test for Heteroskedasticity
p-valuesAlternative Hypothesis
breakpoint indexgreater2-sidedless
210.7676323855574140.4647352288851710.232367614442586
220.6394003739623840.7211992520752330.360599626037616
230.5438409506432660.9123180987134680.456159049356734
240.4433579125496570.8867158250993140.556642087450343
250.317157343594010.634314687188020.68284265640599
260.3394692097534770.6789384195069530.660530790246523
270.4809326673114370.9618653346228750.519067332688563
280.3682014686355940.7364029372711890.631798531364406
290.3798288617782870.7596577235565740.620171138221713
300.6730558540838960.6538882918322070.326944145916103
310.5433831708038370.9132336583923260.456616829196163
320.419406631534740.838813263069480.58059336846526
330.5151882124286110.9696235751427780.484811787571389
340.3705474299432480.7410948598864960.629452570056752
350.3120368529283940.6240737058567880.687963147071606

\begin{tabular}{lllllllll}
\hline
Goldfeld-Quandt test for Heteroskedasticity \tabularnewline
p-values & Alternative Hypothesis \tabularnewline
breakpoint index & greater & 2-sided & less \tabularnewline
21 & 0.767632385557414 & 0.464735228885171 & 0.232367614442586 \tabularnewline
22 & 0.639400373962384 & 0.721199252075233 & 0.360599626037616 \tabularnewline
23 & 0.543840950643266 & 0.912318098713468 & 0.456159049356734 \tabularnewline
24 & 0.443357912549657 & 0.886715825099314 & 0.556642087450343 \tabularnewline
25 & 0.31715734359401 & 0.63431468718802 & 0.68284265640599 \tabularnewline
26 & 0.339469209753477 & 0.678938419506953 & 0.660530790246523 \tabularnewline
27 & 0.480932667311437 & 0.961865334622875 & 0.519067332688563 \tabularnewline
28 & 0.368201468635594 & 0.736402937271189 & 0.631798531364406 \tabularnewline
29 & 0.379828861778287 & 0.759657723556574 & 0.620171138221713 \tabularnewline
30 & 0.673055854083896 & 0.653888291832207 & 0.326944145916103 \tabularnewline
31 & 0.543383170803837 & 0.913233658392326 & 0.456616829196163 \tabularnewline
32 & 0.41940663153474 & 0.83881326306948 & 0.58059336846526 \tabularnewline
33 & 0.515188212428611 & 0.969623575142778 & 0.484811787571389 \tabularnewline
34 & 0.370547429943248 & 0.741094859886496 & 0.629452570056752 \tabularnewline
35 & 0.312036852928394 & 0.624073705856788 & 0.687963147071606 \tabularnewline
\hline
\end{tabular}
%Source: https://freestatistics.org/blog/index.php?pk=111862&T=5

[TABLE]
[ROW][C]Goldfeld-Quandt test for Heteroskedasticity[/C][/ROW]
[ROW][C]p-values[/C][C]Alternative Hypothesis[/C][/ROW]
[ROW][C]breakpoint index[/C][C]greater[/C][C]2-sided[/C][C]less[/C][/ROW]
[ROW][C]21[/C][C]0.767632385557414[/C][C]0.464735228885171[/C][C]0.232367614442586[/C][/ROW]
[ROW][C]22[/C][C]0.639400373962384[/C][C]0.721199252075233[/C][C]0.360599626037616[/C][/ROW]
[ROW][C]23[/C][C]0.543840950643266[/C][C]0.912318098713468[/C][C]0.456159049356734[/C][/ROW]
[ROW][C]24[/C][C]0.443357912549657[/C][C]0.886715825099314[/C][C]0.556642087450343[/C][/ROW]
[ROW][C]25[/C][C]0.31715734359401[/C][C]0.63431468718802[/C][C]0.68284265640599[/C][/ROW]
[ROW][C]26[/C][C]0.339469209753477[/C][C]0.678938419506953[/C][C]0.660530790246523[/C][/ROW]
[ROW][C]27[/C][C]0.480932667311437[/C][C]0.961865334622875[/C][C]0.519067332688563[/C][/ROW]
[ROW][C]28[/C][C]0.368201468635594[/C][C]0.736402937271189[/C][C]0.631798531364406[/C][/ROW]
[ROW][C]29[/C][C]0.379828861778287[/C][C]0.759657723556574[/C][C]0.620171138221713[/C][/ROW]
[ROW][C]30[/C][C]0.673055854083896[/C][C]0.653888291832207[/C][C]0.326944145916103[/C][/ROW]
[ROW][C]31[/C][C]0.543383170803837[/C][C]0.913233658392326[/C][C]0.456616829196163[/C][/ROW]
[ROW][C]32[/C][C]0.41940663153474[/C][C]0.83881326306948[/C][C]0.58059336846526[/C][/ROW]
[ROW][C]33[/C][C]0.515188212428611[/C][C]0.969623575142778[/C][C]0.484811787571389[/C][/ROW]
[ROW][C]34[/C][C]0.370547429943248[/C][C]0.741094859886496[/C][C]0.629452570056752[/C][/ROW]
[ROW][C]35[/C][C]0.312036852928394[/C][C]0.624073705856788[/C][C]0.687963147071606[/C][/ROW]
[/TABLE]
Source: https://freestatistics.org/blog/index.php?pk=111862&T=5

Globally Unique Identifier (entire table): ba.freestatistics.org/blog/index.php?pk=111862&T=5

As an alternative you can also use a QR Code:  

The GUIDs for individual cells are displayed in the table below:

Goldfeld-Quandt test for Heteroskedasticity
p-valuesAlternative Hypothesis
breakpoint indexgreater2-sidedless
210.7676323855574140.4647352288851710.232367614442586
220.6394003739623840.7211992520752330.360599626037616
230.5438409506432660.9123180987134680.456159049356734
240.4433579125496570.8867158250993140.556642087450343
250.317157343594010.634314687188020.68284265640599
260.3394692097534770.6789384195069530.660530790246523
270.4809326673114370.9618653346228750.519067332688563
280.3682014686355940.7364029372711890.631798531364406
290.3798288617782870.7596577235565740.620171138221713
300.6730558540838960.6538882918322070.326944145916103
310.5433831708038370.9132336583923260.456616829196163
320.419406631534740.838813263069480.58059336846526
330.5151882124286110.9696235751427780.484811787571389
340.3705474299432480.7410948598864960.629452570056752
350.3120368529283940.6240737058567880.687963147071606


Meta Analysis of Goldfeld-Quandt test for Heteroskedasticity
Description# significant tests% significant testsOK/NOK
1% type I error level00OK
5% type I error level00OK
10% type I error level00OK

\begin{tabular}{lllllllll}
\hline
Meta Analysis of Goldfeld-Quandt test for Heteroskedasticity \tabularnewline
Description & # significant tests & % significant tests & OK/NOK \tabularnewline
1% type I error level & 0 & 0 & OK \tabularnewline
5% type I error level & 0 & 0 & OK \tabularnewline
10% type I error level & 0 & 0 & OK \tabularnewline
\hline
\end{tabular}
%Source: https://freestatistics.org/blog/index.php?pk=111862&T=6

[TABLE]
[ROW][C]Meta Analysis of Goldfeld-Quandt test for Heteroskedasticity[/C][/ROW]
[ROW][C]Description[/C][C]# significant tests[/C][C]% significant tests[/C][C]OK/NOK[/C][/ROW]
[ROW][C]1% type I error level[/C][C]0[/C][C]0[/C][C]OK[/C][/ROW]
[ROW][C]5% type I error level[/C][C]0[/C][C]0[/C][C]OK[/C][/ROW]
[ROW][C]10% type I error level[/C][C]0[/C][C]0[/C][C]OK[/C][/ROW]
[/TABLE]
Source: https://freestatistics.org/blog/index.php?pk=111862&T=6

Globally Unique Identifier (entire table): ba.freestatistics.org/blog/index.php?pk=111862&T=6

As an alternative you can also use a QR Code:  

The GUIDs for individual cells are displayed in the table below:

Meta Analysis of Goldfeld-Quandt test for Heteroskedasticity
Description# significant tests% significant testsOK/NOK
1% type I error level00OK
5% type I error level00OK
10% type I error level00OK


Parameters (Session):
par1 = 2 ; par2 = Include Monthly Dummies ; par3 = Linear Trend ;
Parameters (R input):
par1 = 2 ; par2 = Include Monthly Dummies ; par3 = Linear Trend ;
R code (references can be found in the software module):
library(lattice)
library(lmtest)
n25 <- 25 #minimum number of obs. for Goldfeld-Quandt test
par1 <- as.numeric(par1)
x <- t(y)
k <- length(x[1,])
n <- length(x[,1])
x1 <- cbind(x[,par1], x[,1:k!=par1])
mycolnames <- c(colnames(x)[par1], colnames(x)[1:k!=par1])
colnames(x1) <- mycolnames #colnames(x)[par1]
x <- x1
if (par3 == 'First Differences'){
x2 <- array(0, dim=c(n-1,k), dimnames=list(1:(n-1), paste('(1-B)',colnames(x),sep='')))
for (i in 1:n-1) {
for (j in 1:k) {
x2[i,j] <- x[i+1,j] - x[i,j]
}
}
x <- x2
}
if (par2 == 'Include Monthly Dummies'){
x2 <- array(0, dim=c(n,11), dimnames=list(1:n, paste('M', seq(1:11), sep ='')))
for (i in 1:11){
x2[seq(i,n,12),i] <- 1
}
x <- cbind(x, x2)
}
if (par2 == 'Include Quarterly Dummies'){
x2 <- array(0, dim=c(n,3), dimnames=list(1:n, paste('Q', seq(1:3), sep ='')))
for (i in 1:3){
x2[seq(i,n,4),i] <- 1
}
x <- cbind(x, x2)
}
k <- length(x[1,])
if (par3 == 'Linear Trend'){
x <- cbind(x, c(1:n))
colnames(x)[k+1] <- 't'
}
x
k <- length(x[1,])
df <- as.data.frame(x)
(mylm <- lm(df))
(mysum <- summary(mylm))
if (n > n25) {
kp3 <- k + 3
nmkm3 <- n - k - 3
gqarr <- array(NA, dim=c(nmkm3-kp3+1,3))
numgqtests <- 0
numsignificant1 <- 0
numsignificant5 <- 0
numsignificant10 <- 0
for (mypoint in kp3:nmkm3) {
j <- 0
numgqtests <- numgqtests + 1
for (myalt in c('greater', 'two.sided', 'less')) {
j <- j + 1
gqarr[mypoint-kp3+1,j] <- gqtest(mylm, point=mypoint, alternative=myalt)$p.value
}
if (gqarr[mypoint-kp3+1,2] < 0.01) numsignificant1 <- numsignificant1 + 1
if (gqarr[mypoint-kp3+1,2] < 0.05) numsignificant5 <- numsignificant5 + 1
if (gqarr[mypoint-kp3+1,2] < 0.10) numsignificant10 <- numsignificant10 + 1
}
gqarr
}
bitmap(file='test0.png')
plot(x[,1], type='l', main='Actuals and Interpolation', ylab='value of Actuals and Interpolation (dots)', xlab='time or index')
points(x[,1]-mysum$resid)
grid()
dev.off()
bitmap(file='test1.png')
plot(mysum$resid, type='b', pch=19, main='Residuals', ylab='value of Residuals', xlab='time or index')
grid()
dev.off()
bitmap(file='test2.png')
hist(mysum$resid, main='Residual Histogram', xlab='values of Residuals')
grid()
dev.off()
bitmap(file='test3.png')
densityplot(~mysum$resid,col='black',main='Residual Density Plot', xlab='values of Residuals')
dev.off()
bitmap(file='test4.png')
qqnorm(mysum$resid, main='Residual Normal Q-Q Plot')
qqline(mysum$resid)
grid()
dev.off()
(myerror <- as.ts(mysum$resid))
bitmap(file='test5.png')
dum <- cbind(lag(myerror,k=1),myerror)
dum
dum1 <- dum[2:length(myerror),]
dum1
z <- as.data.frame(dum1)
z
plot(z,main=paste('Residual Lag plot, lowess, and regression line'), ylab='values of Residuals', xlab='lagged values of Residuals')
lines(lowess(z))
abline(lm(z))
grid()
dev.off()
bitmap(file='test6.png')
acf(mysum$resid, lag.max=length(mysum$resid)/2, main='Residual Autocorrelation Function')
grid()
dev.off()
bitmap(file='test7.png')
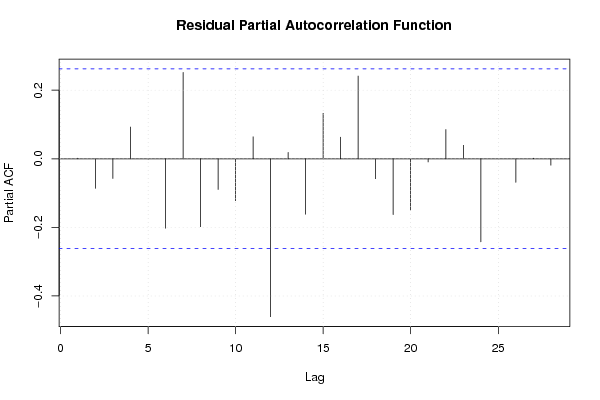
pacf(mysum$resid, lag.max=length(mysum$resid)/2, main='Residual Partial Autocorrelation Function')
grid()
dev.off()
bitmap(file='test8.png')
opar <- par(mfrow = c(2,2), oma = c(0, 0, 1.1, 0))
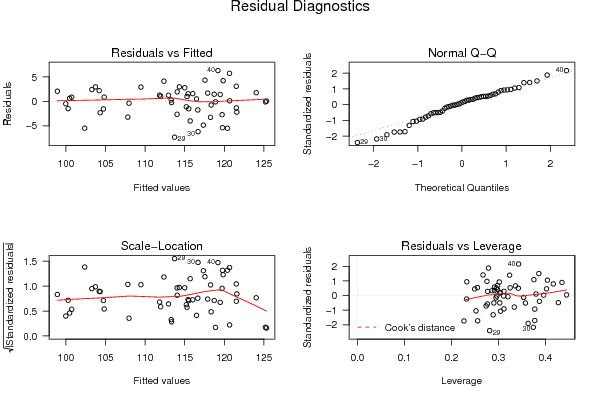
plot(mylm, las = 1, sub='Residual Diagnostics')
par(opar)
dev.off()
if (n > n25) {
bitmap(file='test9.png')
plot(kp3:nmkm3,gqarr[,2], main='Goldfeld-Quandt test',ylab='2-sided p-value',xlab='breakpoint')
grid()
dev.off()
}
load(file='createtable')
a<-table.start()
a<-table.row.start(a)
a<-table.element(a, 'Multiple Linear Regression - Estimated Regression Equation', 1, TRUE)
a<-table.row.end(a)
myeq <- colnames(x)[1]
myeq <- paste(myeq, '[t] = ', sep='')
for (i in 1:k){
if (mysum$coefficients[i,1] > 0) myeq <- paste(myeq, '+', '')
myeq <- paste(myeq, mysum$coefficients[i,1], sep=' ')
if (rownames(mysum$coefficients)[i] != '(Intercept)') {
myeq <- paste(myeq, rownames(mysum$coefficients)[i], sep='')
if (rownames(mysum$coefficients)[i] != 't') myeq <- paste(myeq, '[t]', sep='')
}
}
myeq <- paste(myeq, ' + e[t]')
a<-table.row.start(a)
a<-table.element(a, myeq)
a<-table.row.end(a)
a<-table.end(a)
table.save(a,file='mytable1.tab')
a<-table.start()
a<-table.row.start(a)
a<-table.element(a,hyperlink('ols1.htm','Multiple Linear Regression - Ordinary Least Squares',''), 6, TRUE)
a<-table.row.end(a)
a<-table.row.start(a)
a<-table.element(a,'Variable',header=TRUE)
a<-table.element(a,'Parameter',header=TRUE)
a<-table.element(a,'S.D.',header=TRUE)
a<-table.element(a,'T-STAT
H0: parameter = 0',header=TRUE)
a<-table.element(a,'2-tail p-value',header=TRUE)
a<-table.element(a,'1-tail p-value',header=TRUE)
a<-table.row.end(a)
for (i in 1:k){
a<-table.row.start(a)
a<-table.element(a,rownames(mysum$coefficients)[i],header=TRUE)
a<-table.element(a,mysum$coefficients[i,1])
a<-table.element(a, round(mysum$coefficients[i,2],6))
a<-table.element(a, round(mysum$coefficients[i,3],4))
a<-table.element(a, round(mysum$coefficients[i,4],6))
a<-table.element(a, round(mysum$coefficients[i,4]/2,6))
a<-table.row.end(a)
}
a<-table.end(a)
table.save(a,file='mytable2.tab')
a<-table.start()
a<-table.row.start(a)
a<-table.element(a, 'Multiple Linear Regression - Regression Statistics', 2, TRUE)
a<-table.row.end(a)
a<-table.row.start(a)
a<-table.element(a, 'Multiple R',1,TRUE)
a<-table.element(a, sqrt(mysum$r.squared))
a<-table.row.end(a)
a<-table.row.start(a)
a<-table.element(a, 'R-squared',1,TRUE)
a<-table.element(a, mysum$r.squared)
a<-table.row.end(a)
a<-table.row.start(a)
a<-table.element(a, 'Adjusted R-squared',1,TRUE)
a<-table.element(a, mysum$adj.r.squared)
a<-table.row.end(a)
a<-table.row.start(a)
a<-table.element(a, 'F-TEST (value)',1,TRUE)
a<-table.element(a, mysum$fstatistic[1])
a<-table.row.end(a)
a<-table.row.start(a)
a<-table.element(a, 'F-TEST (DF numerator)',1,TRUE)
a<-table.element(a, mysum$fstatistic[2])
a<-table.row.end(a)
a<-table.row.start(a)
a<-table.element(a, 'F-TEST (DF denominator)',1,TRUE)
a<-table.element(a, mysum$fstatistic[3])
a<-table.row.end(a)
a<-table.row.start(a)
a<-table.element(a, 'p-value',1,TRUE)
a<-table.element(a, 1-pf(mysum$fstatistic[1],mysum$fstatistic[2],mysum$fstatistic[3]))
a<-table.row.end(a)
a<-table.row.start(a)
a<-table.element(a, 'Multiple Linear Regression - Residual Statistics', 2, TRUE)
a<-table.row.end(a)
a<-table.row.start(a)
a<-table.element(a, 'Residual Standard Deviation',1,TRUE)
a<-table.element(a, mysum$sigma)
a<-table.row.end(a)
a<-table.row.start(a)
a<-table.element(a, 'Sum Squared Residuals',1,TRUE)
a<-table.element(a, sum(myerror*myerror))
a<-table.row.end(a)
a<-table.end(a)
table.save(a,file='mytable3.tab')
a<-table.start()
a<-table.row.start(a)
a<-table.element(a, 'Multiple Linear Regression - Actuals, Interpolation, and Residuals', 4, TRUE)
a<-table.row.end(a)
a<-table.row.start(a)
a<-table.element(a, 'Time or Index', 1, TRUE)
a<-table.element(a, 'Actuals', 1, TRUE)
a<-table.element(a, 'Interpolation
Forecast', 1, TRUE)
a<-table.element(a, 'Residuals
Prediction Error', 1, TRUE)
a<-table.row.end(a)
for (i in 1:n) {
a<-table.row.start(a)
a<-table.element(a,i, 1, TRUE)
a<-table.element(a,x[i])
a<-table.element(a,x[i]-mysum$resid[i])
a<-table.element(a,mysum$resid[i])
a<-table.row.end(a)
}
a<-table.end(a)
table.save(a,file='mytable4.tab')
if (n > n25) {
a<-table.start()
a<-table.row.start(a)
a<-table.element(a,'Goldfeld-Quandt test for Heteroskedasticity',4,TRUE)
a<-table.row.end(a)
a<-table.row.start(a)
a<-table.element(a,'p-values',header=TRUE)
a<-table.element(a,'Alternative Hypothesis',3,header=TRUE)
a<-table.row.end(a)
a<-table.row.start(a)
a<-table.element(a,'breakpoint index',header=TRUE)
a<-table.element(a,'greater',header=TRUE)
a<-table.element(a,'2-sided',header=TRUE)
a<-table.element(a,'less',header=TRUE)
a<-table.row.end(a)
for (mypoint in kp3:nmkm3) {
a<-table.row.start(a)
a<-table.element(a,mypoint,header=TRUE)
a<-table.element(a,gqarr[mypoint-kp3+1,1])
a<-table.element(a,gqarr[mypoint-kp3+1,2])
a<-table.element(a,gqarr[mypoint-kp3+1,3])
a<-table.row.end(a)
}
a<-table.end(a)
table.save(a,file='mytable5.tab')
a<-table.start()
a<-table.row.start(a)
a<-table.element(a,'Meta Analysis of Goldfeld-Quandt test for Heteroskedasticity',4,TRUE)
a<-table.row.end(a)
a<-table.row.start(a)
a<-table.element(a,'Description',header=TRUE)
a<-table.element(a,'# significant tests',header=TRUE)
a<-table.element(a,'% significant tests',header=TRUE)
a<-table.element(a,'OK/NOK',header=TRUE)
a<-table.row.end(a)
a<-table.row.start(a)
a<-table.element(a,'1% type I error level',header=TRUE)
a<-table.element(a,numsignificant1)
a<-table.element(a,numsignificant1/numgqtests)
if (numsignificant1/numgqtests < 0.01) dum <- 'OK' else dum <- 'NOK'
a<-table.element(a,dum)
a<-table.row.end(a)
a<-table.row.start(a)
a<-table.element(a,'5% type I error level',header=TRUE)
a<-table.element(a,numsignificant5)
a<-table.element(a,numsignificant5/numgqtests)
if (numsignificant5/numgqtests < 0.05) dum <- 'OK' else dum <- 'NOK'
a<-table.element(a,dum)
a<-table.row.end(a)
a<-table.row.start(a)
a<-table.element(a,'10% type I error level',header=TRUE)
a<-table.element(a,numsignificant10)
a<-table.element(a,numsignificant10/numgqtests)
if (numsignificant10/numgqtests < 0.1) dum <- 'OK' else dum <- 'NOK'
a<-table.element(a,dum)
a<-table.row.end(a)
a<-table.end(a)
table.save(a,file='mytable6.tab')
}