| Multiple Linear Regression - Estimated Regression Equation |
| Y(t)[t] = + 17.8886662901039 + 0.593242377727027T.I.P.[t] + 0.205154983132475`Y(t-1)`[t] + 0.115152970700046`Y(t-2)`[t] + 1.45879444891351M1[t] -2.14950402416359M2[t] -1.21608635241409M3[t] -1.28121836133137M4[t] + 10.7917317668094M5[t] + 4.87747224861314M6[t] -7.95768982198349M7[t] -4.45922797316631M8[t] -3.79312308338614M9[t] + 0.925313075396341M10[t] + 6.08788829036564M11[t] -0.089662245098952t + e[t] |
| Multiple Linear Regression - Ordinary Least Squares | |||||
| Variable | Parameter | S.D. | T-STAT H0: parameter = 0 | 2-tail p-value | 1-tail p-value |
| (Intercept) | 17.8886662901039 | 11.042792 | 1.6199 | 0.11273 | 0.056365 |
| T.I.P. | 0.593242377727027 | 0.109649 | 5.4104 | 3e-06 | 1e-06 |
| `Y(t-1)` | 0.205154983132475 | 0.117405 | 1.7474 | 0.087875 | 0.043937 |
| `Y(t-2)` | 0.115152970700046 | 0.116605 | 0.9875 | 0.329031 | 0.164515 |
| M1 | 1.45879444891351 | 2.868214 | 0.5086 | 0.613689 | 0.306844 |
| M2 | -2.14950402416359 | 2.497623 | -0.8606 | 0.394334 | 0.197167 |
| M3 | -1.21608635241409 | 2.806613 | -0.4333 | 0.667019 | 0.333509 |
| M4 | -1.28121836133137 | 2.863701 | -0.4474 | 0.656886 | 0.328443 |
| M5 | 10.7917317668094 | 3.040126 | 3.5498 | 0.000966 | 0.000483 |
| M6 | 4.87747224861314 | 2.721254 | 1.7924 | 0.08028 | 0.04014 |
| M7 | -7.95768982198349 | 2.744783 | -2.8992 | 0.005926 | 0.002963 |
| M8 | -4.45922797316631 | 2.985327 | -1.4937 | 0.142725 | 0.071363 |
| M9 | -3.79312308338614 | 2.56813 | -1.477 | 0.147136 | 0.073568 |
| M10 | 0.925313075396341 | 2.713631 | 0.341 | 0.734813 | 0.367407 |
| M11 | 6.08788829036564 | 2.746191 | 2.2168 | 0.032102 | 0.016051 |
| t | -0.089662245098952 | 0.033877 | -2.6467 | 0.011394 | 0.005697 |
| Multiple Linear Regression - Regression Statistics | |
| Multiple R | 0.90677540764535 |
| R-squared | 0.82224163991039 |
| Adjusted R-squared | 0.758756511306957 |
| F-TEST (value) | 12.9517204737289 |
| F-TEST (DF numerator) | 15 |
| F-TEST (DF denominator) | 42 |
| p-value | 3.16494608298967e-11 |
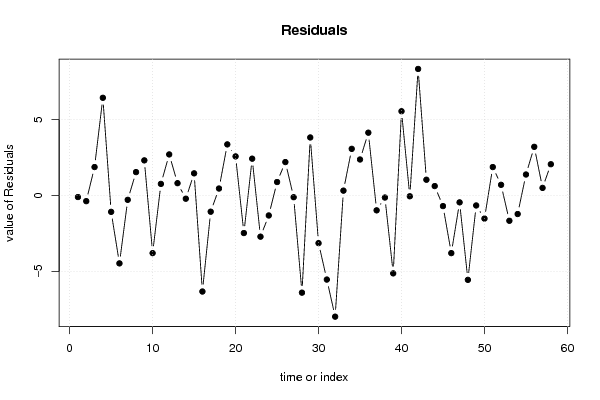
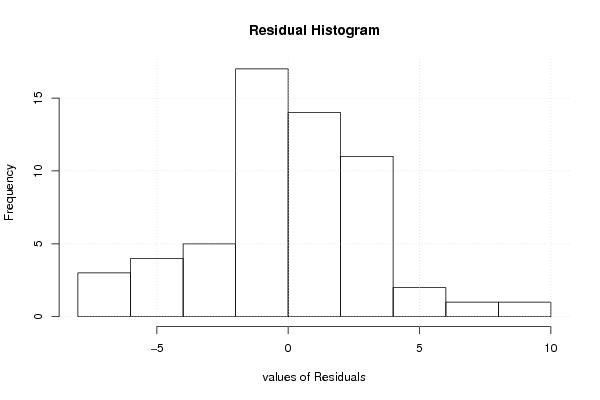
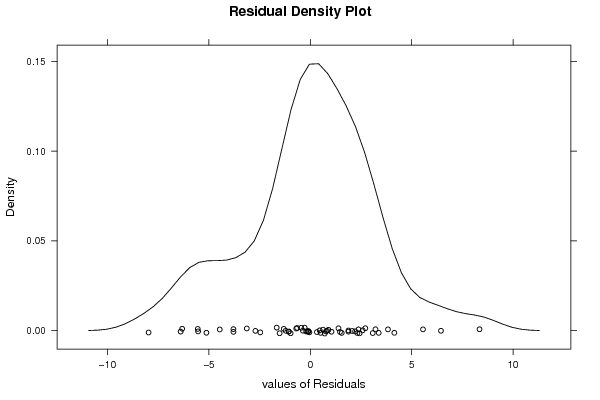
| Multiple Linear Regression - Residual Statistics | |
| Residual Standard Deviation | 3.71652920335122 |
| Sum Squared Residuals | 580.128751413224 |
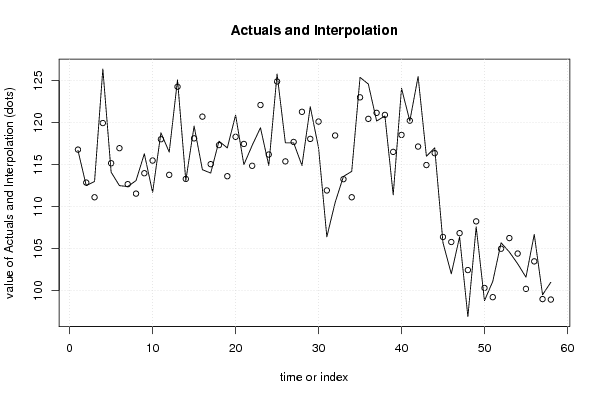
| Multiple Linear Regression - Actuals, Interpolation, and Residuals | |||
| Time or Index | Actuals | Interpolation Forecast | Residuals Prediction Error |
| 1 | 116.7 | 116.793696026955 | -0.0936960269545876 |
| 2 | 112.5 | 112.865685087896 | -0.365685087895518 |
| 3 | 113 | 111.118957740513 | 1.88104225948694 |
| 4 | 126.4 | 119.95632806921 | 6.44367193079011 |
| 5 | 114.1 | 115.169270746585 | -1.06927074658506 |
| 6 | 112.5 | 116.964979688501 | -4.46497968850097 |
| 7 | 112.4 | 112.677267470406 | -0.277267470405825 |
| 8 | 113.1 | 111.550637465283 | 1.54936253471654 |
| 9 | 116.3 | 113.979576196496 | 2.32042380350423 |
| 10 | 111.7 | 115.489377680468 | -3.78937768046757 |
| 11 | 118.8 | 118.029367387669 | 0.770632612330495 |
| 12 | 116.5 | 113.787225609361 | 2.71277439063878 |
| 13 | 125.1 | 124.282074634301 | 0.817925365698592 |
| 14 | 113.1 | 113.303607748095 | -0.203607748094534 |
| 15 | 119.6 | 118.133648800264 | 1.46635119973557 |
| 16 | 114.4 | 120.718765463526 | -6.31876546352574 |
| 17 | 114 | 115.0610643142 | -1.06106431419985 |
| 18 | 117.8 | 117.334245013689 | 0.46575498631052 |
| 19 | 117 | 113.626314447114 | 3.37368555288624 |
| 20 | 120.9 | 118.317083395122 | 2.58291660487787 |
| 21 | 115 | 117.465835537643 | -2.46583553764267 |
| 22 | 117.3 | 114.86694971935 | 2.43305028064981 |
| 23 | 119.4 | 122.105286134203 | -2.70528613420306 |
| 24 | 114.9 | 116.208143231518 | -1.30814323151785 |
| 25 | 125.8 | 124.904671349021 | 0.895328650978765 |
| 26 | 117.6 | 115.390533381706 | 2.20946661829429 |
| 27 | 117.6 | 117.705560936027 | -0.105560936026954 |
| 28 | 114.9 | 121.293127106314 | -6.39312710631384 |
| 29 | 121.9 | 118.06940980504 | 3.83059019495954 |
| 30 | 117 | 120.131595722189 | -3.13159572218863 |
| 31 | 106.4 | 111.931494519179 | -5.53149451917855 |
| 32 | 110.5 | 118.47450128476 | -7.9745012847599 |
| 33 | 113.6 | 113.272952233548 | 0.327047766452166 |
| 34 | 114.2 | 111.119710151043 | 3.08028984895724 |
| 35 | 125.4 | 123.020383761642 | 2.37961623835808 |
| 36 | 124.6 | 120.455469812908 | 4.14453018709216 |
| 37 | 120.2 | 121.170464168876 | -0.970464168875844 |
| 38 | 120.8 | 120.92701698131 | -0.127016981309569 |
| 39 | 111.4 | 116.522604829398 | -5.12260482939778 |
| 40 | 124.1 | 118.5424936849 | 5.55750631509989 |
| 41 | 120.2 | 120.243288612376 | -0.043288612376111 |
| 42 | 125.5 | 117.156026178118 | 8.3439738218825 |
| 43 | 116 | 114.954547108653 | 1.04545289134669 |
| 44 | 117 | 116.372118501824 | 0.627881498176457 |
| 45 | 105.7 | 106.389912151036 | -0.689912151036261 |
| 46 | 102 | 105.790051599615 | -3.79005159961503 |
| 47 | 106.4 | 106.844962716486 | -0.444962716485515 |
| 48 | 96.9 | 102.449161346213 | -5.5491613462131 |
| 49 | 107.6 | 108.249093820847 | -0.649093820846925 |
| 50 | 98.8 | 100.313156800995 | -1.51315680099467 |
| 51 | 101.1 | 99.2192276937978 | 1.88077230620222 |
| 52 | 105.7 | 104.98928567605 | 0.710714323949584 |
| 53 | 104.6 | 106.256966521799 | -1.65696652179852 |
| 54 | 103.2 | 104.413153397503 | -1.21315339750343 |
| 55 | 101.6 | 100.210376454649 | 1.38962354535145 |
| 56 | 106.7 | 103.485659353011 | 3.21434064698903 |
| 57 | 99.5 | 98.9917238812775 | 0.508276118722536 |
| 58 | 101 | 98.9339108495244 | 2.06608915047556 |
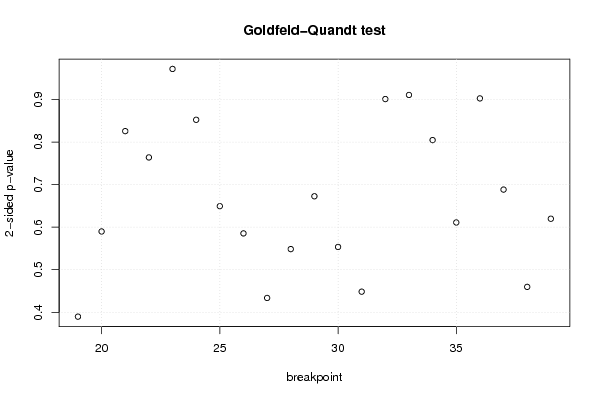
| Goldfeld-Quandt test for Heteroskedasticity | |||
| p-values | Alternative Hypothesis | ||
| breakpoint index | greater | 2-sided | less |
| 19 | 0.805132733379345 | 0.389734533241309 | 0.194867266620655 |
| 20 | 0.705033605057932 | 0.589932789884136 | 0.294966394942068 |
| 21 | 0.587103703547356 | 0.825792592905289 | 0.412896296452644 |
| 22 | 0.618023772919376 | 0.763952454161247 | 0.381976227080624 |
| 23 | 0.514044815618347 | 0.971910368763306 | 0.485955184381653 |
| 24 | 0.426210961569952 | 0.852421923139905 | 0.573789038430048 |
| 25 | 0.324705111367581 | 0.649410222735163 | 0.675294888632419 |
| 26 | 0.292710787574652 | 0.585421575149304 | 0.707289212425348 |
| 27 | 0.216816586543326 | 0.433633173086653 | 0.783183413456674 |
| 28 | 0.274251341845869 | 0.548502683691738 | 0.725748658154131 |
| 29 | 0.336332320304831 | 0.672664640609662 | 0.663667679695169 |
| 30 | 0.276751170445043 | 0.553502340890086 | 0.723248829554957 |
| 31 | 0.224220336901902 | 0.448440673803804 | 0.775779663098098 |
| 32 | 0.549431459998417 | 0.901137080003165 | 0.450568540001583 |
| 33 | 0.455382583853671 | 0.910765167707341 | 0.54461741614633 |
| 34 | 0.40235009075046 | 0.804700181500919 | 0.59764990924954 |
| 35 | 0.305533197228286 | 0.611066394456573 | 0.694466802771714 |
| 36 | 0.45135271369989 | 0.90270542739978 | 0.54864728630011 |
| 37 | 0.344178946023517 | 0.688357892047033 | 0.655821053976483 |
| 38 | 0.229864827054048 | 0.459729654108096 | 0.770135172945952 |
| 39 | 0.309920199360235 | 0.61984039872047 | 0.690079800639765 |
| Meta Analysis of Goldfeld-Quandt test for Heteroskedasticity | |||
| Description | # significant tests | % significant tests | OK/NOK |
| 1% type I error level | 0 | 0 | OK |
| 5% type I error level | 0 | 0 | OK |
| 10% type I error level | 0 | 0 | OK |