Free Statistics

of Irreproducible Research!

Author's title

Author*The author of this computation has been verified*
R Software Modulerwasp_multipleregression.wasp
Title produced by softwareMultiple Regression
Date of computationSat, 18 Dec 2010 11:51:23 +0000
Cite this page as followsStatistical Computations at FreeStatistics.org, Office for Research Development and Education, URL https://freestatistics.org/blog/index.php?v=date/2010/Dec/18/t1292672975vdty6oor63pvros.htm/, Retrieved Tue, 30 Apr 2024 02:50:26 +0000
Statistical Computations at FreeStatistics.org, Office for Research Development and Education, URL https://freestatistics.org/blog/index.php?pk=111859, Retrieved Tue, 30 Apr 2024 02:50:26 +0000
QR Codes:

Original text written by user:
IsPrivate?No (this computation is public)
User-defined keywords
Estimated Impact126
Family? (F = Feedback message, R = changed R code, M = changed R Module, P = changed Parameters, D = changed Data)
-       [Multiple Regression] [Vertragingen] [2010-12-18 11:51:23] [19046f4a6967f3fb6f5f17d42e7d38f2] [Current]
Feedback Forum

Post a new message
Dataseries X:
104,7	116,7	107,5	116,1
102,8	112,5	116,7	107,5
98,1	113	112,5	116,7
113,9	126,4	113	112,5
80,9	114,1	126,4	113
95,7	112,5	114,1	126,4
113,2	112,4	112,5	114,1
105,9	113,1	112,4	112,5
108,8	116,3	113,1	112,4
102,3	111,7	116,3	113,1
99	118,8	111,7	116,3
100,7	116,5	118,8	111,7
115,5	125,1	116,5	118,8
100,7	113,1	125,1	116,5
109,9	119,6	113,1	125,1
114,6	114,4	119,6	113,1
85,4	114	114,4	119,6
100,5	117,8	114	114,4
114,8	117	117,8	114
116,5	120,9	117	117,8
112,9	115	120,9	117
102	117,3	115	120,9
106	119,4	117,3	115
105,3	114,9	119,4	117,3
118,8	125,8	114,9	119,4
106,1	117,6	125,8	114,9
109,3	117,6	117,6	125,8
117,2	114,9	117,6	117,6
92,5	121,9	114,9	117,6
104,2	117	121,9	114,9
112,5	106,4	117	121,9
122,4	110,5	106,4	117
113,3	113,6	110,5	106,4
100	114,2	113,6	110,5
110,7	125,4	114,2	113,6
112,8	124,6	125,4	114,2
109,8	120,2	124,6	125,4
117,3	120,8	120,2	124,6
109,1	111,4	120,8	120,2
115,9	124,1	111,4	120,8
96	120,2	124,1	111,4
99,8	125,5	120,2	124,1
116,8	116	125,5	120,2
115,7	117	116	125,5
99,4	105,7	117	116
94,3	102	105,7	117
91	106,4	102	105,7
93,2	96,9	106,4	102
103,1	107,6	96,9	106,4
94,1	98,8	107,6	96,9
91,8	101,1	98,8	107,6
102,7	105,7	101,1	98,8
82,6	104,6	105,7	101,1
89,1	103,2	104,6	105,7
104,5	101,6	103,2	104,6
105,1	106,7	101,6	103,2
95,1	99,5	106,7	101,6
88,7	101	99,5	106,7


Summary of computational transaction
Raw Inputview raw input (R code)
Raw Outputview raw output of R engine
Computing time6 seconds
R Server'RServer@AstonUniversity' @ vre.aston.ac.uk

\begin{tabular}{lllllllll}
\hline
Summary of computational transaction \tabularnewline
Raw Input & view raw input (R code)  \tabularnewline
Raw Output & view raw output of R engine  \tabularnewline
Computing time & 6 seconds \tabularnewline
R Server & 'RServer@AstonUniversity' @ vre.aston.ac.uk \tabularnewline
\hline
\end{tabular}
%Source: https://freestatistics.org/blog/index.php?pk=111859&T=0

[TABLE]
[ROW][C]Summary of computational transaction[/C][/ROW]
[ROW][C]Raw Input[/C][C]view raw input (R code) [/C][/ROW]
[ROW][C]Raw Output[/C][C]view raw output of R engine [/C][/ROW]
[ROW][C]Computing time[/C][C]6 seconds[/C][/ROW]
[ROW][C]R Server[/C][C]'RServer@AstonUniversity' @ vre.aston.ac.uk[/C][/ROW]
[/TABLE]
Source: https://freestatistics.org/blog/index.php?pk=111859&T=0

Globally Unique Identifier (entire table): ba.freestatistics.org/blog/index.php?pk=111859&T=0

As an alternative you can also use a QR Code:  

The GUIDs for individual cells are displayed in the table below:

Summary of computational transaction
Raw Inputview raw input (R code)
Raw Outputview raw output of R engine
Computing time6 seconds
R Server'RServer@AstonUniversity' @ vre.aston.ac.uk


Multiple Linear Regression - Estimated Regression Equation
Y(t)[t] = + 17.8886662901039 + 0.593242377727027T.I.P.[t] + 0.205154983132475`Y(t-1)`[t] + 0.115152970700046`Y(t-2)`[t] + 1.45879444891351M1[t] -2.14950402416359M2[t] -1.21608635241409M3[t] -1.28121836133137M4[t] + 10.7917317668094M5[t] + 4.87747224861314M6[t] -7.95768982198349M7[t] -4.45922797316631M8[t] -3.79312308338614M9[t] + 0.925313075396341M10[t] + 6.08788829036564M11[t] -0.089662245098952t + e[t]

\begin{tabular}{lllllllll}
\hline
Multiple Linear Regression - Estimated Regression Equation \tabularnewline
Y(t)[t] =  +  17.8886662901039 +  0.593242377727027T.I.P.[t] +  0.205154983132475`Y(t-1)`[t] +  0.115152970700046`Y(t-2)`[t] +  1.45879444891351M1[t] -2.14950402416359M2[t] -1.21608635241409M3[t] -1.28121836133137M4[t] +  10.7917317668094M5[t] +  4.87747224861314M6[t] -7.95768982198349M7[t] -4.45922797316631M8[t] -3.79312308338614M9[t] +  0.925313075396341M10[t] +  6.08788829036564M11[t] -0.089662245098952t  + e[t] \tabularnewline
\hline
\end{tabular}
%Source: https://freestatistics.org/blog/index.php?pk=111859&T=1

[TABLE]
[ROW][C]Multiple Linear Regression - Estimated Regression Equation[/C][/ROW]
[ROW][C]Y(t)[t] =  +  17.8886662901039 +  0.593242377727027T.I.P.[t] +  0.205154983132475`Y(t-1)`[t] +  0.115152970700046`Y(t-2)`[t] +  1.45879444891351M1[t] -2.14950402416359M2[t] -1.21608635241409M3[t] -1.28121836133137M4[t] +  10.7917317668094M5[t] +  4.87747224861314M6[t] -7.95768982198349M7[t] -4.45922797316631M8[t] -3.79312308338614M9[t] +  0.925313075396341M10[t] +  6.08788829036564M11[t] -0.089662245098952t  + e[t][/C][/ROW]
[/TABLE]
Source: https://freestatistics.org/blog/index.php?pk=111859&T=1

Globally Unique Identifier (entire table): ba.freestatistics.org/blog/index.php?pk=111859&T=1

As an alternative you can also use a QR Code:  

The GUIDs for individual cells are displayed in the table below:

Multiple Linear Regression - Estimated Regression Equation
Y(t)[t] = + 17.8886662901039 + 0.593242377727027T.I.P.[t] + 0.205154983132475`Y(t-1)`[t] + 0.115152970700046`Y(t-2)`[t] + 1.45879444891351M1[t] -2.14950402416359M2[t] -1.21608635241409M3[t] -1.28121836133137M4[t] + 10.7917317668094M5[t] + 4.87747224861314M6[t] -7.95768982198349M7[t] -4.45922797316631M8[t] -3.79312308338614M9[t] + 0.925313075396341M10[t] + 6.08788829036564M11[t] -0.089662245098952t + e[t]


Multiple Linear Regression - Ordinary Least Squares
VariableParameterS.D.T-STATH0: parameter = 02-tail p-value1-tail p-value
(Intercept)17.888666290103911.0427921.61990.112730.056365
T.I.P.0.5932423777270270.1096495.41043e-061e-06
`Y(t-1)`0.2051549831324750.1174051.74740.0878750.043937
`Y(t-2)`0.1151529707000460.1166050.98750.3290310.164515
M11.458794448913512.8682140.50860.6136890.306844
M2-2.149504024163592.497623-0.86060.3943340.197167
M3-1.216086352414092.806613-0.43330.6670190.333509
M4-1.281218361331372.863701-0.44740.6568860.328443
M510.79173176680943.0401263.54980.0009660.000483
M64.877472248613142.7212541.79240.080280.04014
M7-7.957689821983492.744783-2.89920.0059260.002963
M8-4.459227973166312.985327-1.49370.1427250.071363
M9-3.793123083386142.56813-1.4770.1471360.073568
M100.9253130753963412.7136310.3410.7348130.367407
M116.087888290365642.7461912.21680.0321020.016051
t-0.0896622450989520.033877-2.64670.0113940.005697

\begin{tabular}{lllllllll}
\hline
Multiple Linear Regression - Ordinary Least Squares \tabularnewline
Variable & Parameter & S.D. & T-STATH0: parameter = 0 & 2-tail p-value & 1-tail p-value \tabularnewline
(Intercept) & 17.8886662901039 & 11.042792 & 1.6199 & 0.11273 & 0.056365 \tabularnewline
T.I.P. & 0.593242377727027 & 0.109649 & 5.4104 & 3e-06 & 1e-06 \tabularnewline
`Y(t-1)` & 0.205154983132475 & 0.117405 & 1.7474 & 0.087875 & 0.043937 \tabularnewline
`Y(t-2)` & 0.115152970700046 & 0.116605 & 0.9875 & 0.329031 & 0.164515 \tabularnewline
M1 & 1.45879444891351 & 2.868214 & 0.5086 & 0.613689 & 0.306844 \tabularnewline
M2 & -2.14950402416359 & 2.497623 & -0.8606 & 0.394334 & 0.197167 \tabularnewline
M3 & -1.21608635241409 & 2.806613 & -0.4333 & 0.667019 & 0.333509 \tabularnewline
M4 & -1.28121836133137 & 2.863701 & -0.4474 & 0.656886 & 0.328443 \tabularnewline
M5 & 10.7917317668094 & 3.040126 & 3.5498 & 0.000966 & 0.000483 \tabularnewline
M6 & 4.87747224861314 & 2.721254 & 1.7924 & 0.08028 & 0.04014 \tabularnewline
M7 & -7.95768982198349 & 2.744783 & -2.8992 & 0.005926 & 0.002963 \tabularnewline
M8 & -4.45922797316631 & 2.985327 & -1.4937 & 0.142725 & 0.071363 \tabularnewline
M9 & -3.79312308338614 & 2.56813 & -1.477 & 0.147136 & 0.073568 \tabularnewline
M10 & 0.925313075396341 & 2.713631 & 0.341 & 0.734813 & 0.367407 \tabularnewline
M11 & 6.08788829036564 & 2.746191 & 2.2168 & 0.032102 & 0.016051 \tabularnewline
t & -0.089662245098952 & 0.033877 & -2.6467 & 0.011394 & 0.005697 \tabularnewline
\hline
\end{tabular}
%Source: https://freestatistics.org/blog/index.php?pk=111859&T=2

[TABLE]
[ROW][C]Multiple Linear Regression - Ordinary Least Squares[/C][/ROW]
[ROW][C]Variable[/C][C]Parameter[/C][C]S.D.[/C][C]T-STATH0: parameter = 0[/C][C]2-tail p-value[/C][C]1-tail p-value[/C][/ROW]
[ROW][C](Intercept)[/C][C]17.8886662901039[/C][C]11.042792[/C][C]1.6199[/C][C]0.11273[/C][C]0.056365[/C][/ROW]
[ROW][C]T.I.P.[/C][C]0.593242377727027[/C][C]0.109649[/C][C]5.4104[/C][C]3e-06[/C][C]1e-06[/C][/ROW]
[ROW][C]`Y(t-1)`[/C][C]0.205154983132475[/C][C]0.117405[/C][C]1.7474[/C][C]0.087875[/C][C]0.043937[/C][/ROW]
[ROW][C]`Y(t-2)`[/C][C]0.115152970700046[/C][C]0.116605[/C][C]0.9875[/C][C]0.329031[/C][C]0.164515[/C][/ROW]
[ROW][C]M1[/C][C]1.45879444891351[/C][C]2.868214[/C][C]0.5086[/C][C]0.613689[/C][C]0.306844[/C][/ROW]
[ROW][C]M2[/C][C]-2.14950402416359[/C][C]2.497623[/C][C]-0.8606[/C][C]0.394334[/C][C]0.197167[/C][/ROW]
[ROW][C]M3[/C][C]-1.21608635241409[/C][C]2.806613[/C][C]-0.4333[/C][C]0.667019[/C][C]0.333509[/C][/ROW]
[ROW][C]M4[/C][C]-1.28121836133137[/C][C]2.863701[/C][C]-0.4474[/C][C]0.656886[/C][C]0.328443[/C][/ROW]
[ROW][C]M5[/C][C]10.7917317668094[/C][C]3.040126[/C][C]3.5498[/C][C]0.000966[/C][C]0.000483[/C][/ROW]
[ROW][C]M6[/C][C]4.87747224861314[/C][C]2.721254[/C][C]1.7924[/C][C]0.08028[/C][C]0.04014[/C][/ROW]
[ROW][C]M7[/C][C]-7.95768982198349[/C][C]2.744783[/C][C]-2.8992[/C][C]0.005926[/C][C]0.002963[/C][/ROW]
[ROW][C]M8[/C][C]-4.45922797316631[/C][C]2.985327[/C][C]-1.4937[/C][C]0.142725[/C][C]0.071363[/C][/ROW]
[ROW][C]M9[/C][C]-3.79312308338614[/C][C]2.56813[/C][C]-1.477[/C][C]0.147136[/C][C]0.073568[/C][/ROW]
[ROW][C]M10[/C][C]0.925313075396341[/C][C]2.713631[/C][C]0.341[/C][C]0.734813[/C][C]0.367407[/C][/ROW]
[ROW][C]M11[/C][C]6.08788829036564[/C][C]2.746191[/C][C]2.2168[/C][C]0.032102[/C][C]0.016051[/C][/ROW]
[ROW][C]t[/C][C]-0.089662245098952[/C][C]0.033877[/C][C]-2.6467[/C][C]0.011394[/C][C]0.005697[/C][/ROW]
[/TABLE]
Source: https://freestatistics.org/blog/index.php?pk=111859&T=2

Globally Unique Identifier (entire table): ba.freestatistics.org/blog/index.php?pk=111859&T=2

As an alternative you can also use a QR Code:  

The GUIDs for individual cells are displayed in the table below:

Multiple Linear Regression - Ordinary Least Squares
VariableParameterS.D.T-STATH0: parameter = 02-tail p-value1-tail p-value
(Intercept)17.888666290103911.0427921.61990.112730.056365
T.I.P.0.5932423777270270.1096495.41043e-061e-06
`Y(t-1)`0.2051549831324750.1174051.74740.0878750.043937
`Y(t-2)`0.1151529707000460.1166050.98750.3290310.164515
M11.458794448913512.8682140.50860.6136890.306844
M2-2.149504024163592.497623-0.86060.3943340.197167
M3-1.216086352414092.806613-0.43330.6670190.333509
M4-1.281218361331372.863701-0.44740.6568860.328443
M510.79173176680943.0401263.54980.0009660.000483
M64.877472248613142.7212541.79240.080280.04014
M7-7.957689821983492.744783-2.89920.0059260.002963
M8-4.459227973166312.985327-1.49370.1427250.071363
M9-3.793123083386142.56813-1.4770.1471360.073568
M100.9253130753963412.7136310.3410.7348130.367407
M116.087888290365642.7461912.21680.0321020.016051
t-0.0896622450989520.033877-2.64670.0113940.005697


Multiple Linear Regression - Regression Statistics
Multiple R0.90677540764535
R-squared0.82224163991039
Adjusted R-squared0.758756511306957
F-TEST (value)12.9517204737289
F-TEST (DF numerator)15
F-TEST (DF denominator)42
p-value3.16494608298967e-11
Multiple Linear Regression - Residual Statistics
Residual Standard Deviation3.71652920335122
Sum Squared Residuals580.128751413224

\begin{tabular}{lllllllll}
\hline
Multiple Linear Regression - Regression Statistics \tabularnewline
Multiple R & 0.90677540764535 \tabularnewline
R-squared & 0.82224163991039 \tabularnewline
Adjusted R-squared & 0.758756511306957 \tabularnewline
F-TEST (value) & 12.9517204737289 \tabularnewline
F-TEST (DF numerator) & 15 \tabularnewline
F-TEST (DF denominator) & 42 \tabularnewline
p-value & 3.16494608298967e-11 \tabularnewline
Multiple Linear Regression - Residual Statistics \tabularnewline
Residual Standard Deviation & 3.71652920335122 \tabularnewline
Sum Squared Residuals & 580.128751413224 \tabularnewline
\hline
\end{tabular}
%Source: https://freestatistics.org/blog/index.php?pk=111859&T=3

[TABLE]
[ROW][C]Multiple Linear Regression - Regression Statistics[/C][/ROW]
[ROW][C]Multiple R[/C][C]0.90677540764535[/C][/ROW]
[ROW][C]R-squared[/C][C]0.82224163991039[/C][/ROW]
[ROW][C]Adjusted R-squared[/C][C]0.758756511306957[/C][/ROW]
[ROW][C]F-TEST (value)[/C][C]12.9517204737289[/C][/ROW]
[ROW][C]F-TEST (DF numerator)[/C][C]15[/C][/ROW]
[ROW][C]F-TEST (DF denominator)[/C][C]42[/C][/ROW]
[ROW][C]p-value[/C][C]3.16494608298967e-11[/C][/ROW]
[ROW][C]Multiple Linear Regression - Residual Statistics[/C][/ROW]
[ROW][C]Residual Standard Deviation[/C][C]3.71652920335122[/C][/ROW]
[ROW][C]Sum Squared Residuals[/C][C]580.128751413224[/C][/ROW]
[/TABLE]
Source: https://freestatistics.org/blog/index.php?pk=111859&T=3

Globally Unique Identifier (entire table): ba.freestatistics.org/blog/index.php?pk=111859&T=3

As an alternative you can also use a QR Code:  

The GUIDs for individual cells are displayed in the table below:

Multiple Linear Regression - Regression Statistics
Multiple R0.90677540764535
R-squared0.82224163991039
Adjusted R-squared0.758756511306957
F-TEST (value)12.9517204737289
F-TEST (DF numerator)15
F-TEST (DF denominator)42
p-value3.16494608298967e-11
Multiple Linear Regression - Residual Statistics
Residual Standard Deviation3.71652920335122
Sum Squared Residuals580.128751413224


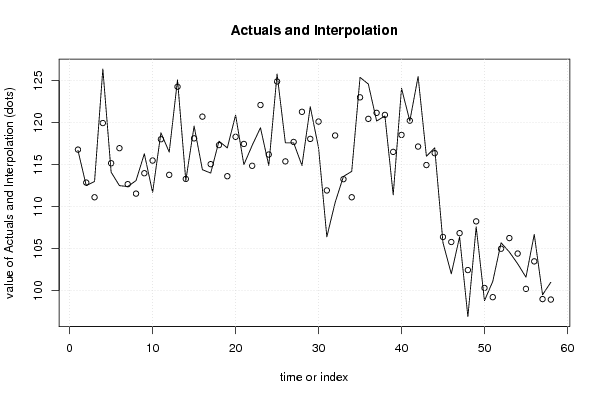
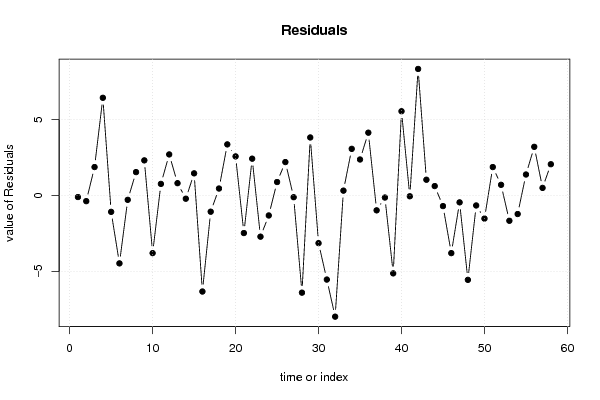
Multiple Linear Regression - Actuals, Interpolation, and Residuals
Time or IndexActualsInterpolationForecastResidualsPrediction Error
1116.7116.793696026955-0.0936960269545876
2112.5112.865685087896-0.365685087895518
3113111.1189577405131.88104225948694
4126.4119.956328069216.44367193079011
5114.1115.169270746585-1.06927074658506
6112.5116.964979688501-4.46497968850097
7112.4112.677267470406-0.277267470405825
8113.1111.5506374652831.54936253471654
9116.3113.9795761964962.32042380350423
10111.7115.489377680468-3.78937768046757
11118.8118.0293673876690.770632612330495
12116.5113.7872256093612.71277439063878
13125.1124.2820746343010.817925365698592
14113.1113.303607748095-0.203607748094534
15119.6118.1336488002641.46635119973557
16114.4120.718765463526-6.31876546352574
17114115.0610643142-1.06106431419985
18117.8117.3342450136890.46575498631052
19117113.6263144471143.37368555288624
20120.9118.3170833951222.58291660487787
21115117.465835537643-2.46583553764267
22117.3114.866949719352.43305028064981
23119.4122.105286134203-2.70528613420306
24114.9116.208143231518-1.30814323151785
25125.8124.9046713490210.895328650978765
26117.6115.3905333817062.20946661829429
27117.6117.705560936027-0.105560936026954
28114.9121.293127106314-6.39312710631384
29121.9118.069409805043.83059019495954
30117120.131595722189-3.13159572218863
31106.4111.931494519179-5.53149451917855
32110.5118.47450128476-7.9745012847599
33113.6113.2729522335480.327047766452166
34114.2111.1197101510433.08028984895724
35125.4123.0203837616422.37961623835808
36124.6120.4554698129084.14453018709216
37120.2121.170464168876-0.970464168875844
38120.8120.92701698131-0.127016981309569
39111.4116.522604829398-5.12260482939778
40124.1118.54249368495.55750631509989
41120.2120.243288612376-0.043288612376111
42125.5117.1560261781188.3439738218825
43116114.9545471086531.04545289134669
44117116.3721185018240.627881498176457
45105.7106.389912151036-0.689912151036261
46102105.790051599615-3.79005159961503
47106.4106.844962716486-0.444962716485515
4896.9102.449161346213-5.5491613462131
49107.6108.249093820847-0.649093820846925
5098.8100.313156800995-1.51315680099467
51101.199.21922769379781.88077230620222
52105.7104.989285676050.710714323949584
53104.6106.256966521799-1.65696652179852
54103.2104.413153397503-1.21315339750343
55101.6100.2103764546491.38962354535145
56106.7103.4856593530113.21434064698903
5799.598.99172388127750.508276118722536
5810198.93391084952442.06608915047556

\begin{tabular}{lllllllll}
\hline
Multiple Linear Regression - Actuals, Interpolation, and Residuals \tabularnewline
Time or Index & Actuals & InterpolationForecast & ResidualsPrediction Error \tabularnewline
1 & 116.7 & 116.793696026955 & -0.0936960269545876 \tabularnewline
2 & 112.5 & 112.865685087896 & -0.365685087895518 \tabularnewline
3 & 113 & 111.118957740513 & 1.88104225948694 \tabularnewline
4 & 126.4 & 119.95632806921 & 6.44367193079011 \tabularnewline
5 & 114.1 & 115.169270746585 & -1.06927074658506 \tabularnewline
6 & 112.5 & 116.964979688501 & -4.46497968850097 \tabularnewline
7 & 112.4 & 112.677267470406 & -0.277267470405825 \tabularnewline
8 & 113.1 & 111.550637465283 & 1.54936253471654 \tabularnewline
9 & 116.3 & 113.979576196496 & 2.32042380350423 \tabularnewline
10 & 111.7 & 115.489377680468 & -3.78937768046757 \tabularnewline
11 & 118.8 & 118.029367387669 & 0.770632612330495 \tabularnewline
12 & 116.5 & 113.787225609361 & 2.71277439063878 \tabularnewline
13 & 125.1 & 124.282074634301 & 0.817925365698592 \tabularnewline
14 & 113.1 & 113.303607748095 & -0.203607748094534 \tabularnewline
15 & 119.6 & 118.133648800264 & 1.46635119973557 \tabularnewline
16 & 114.4 & 120.718765463526 & -6.31876546352574 \tabularnewline
17 & 114 & 115.0610643142 & -1.06106431419985 \tabularnewline
18 & 117.8 & 117.334245013689 & 0.46575498631052 \tabularnewline
19 & 117 & 113.626314447114 & 3.37368555288624 \tabularnewline
20 & 120.9 & 118.317083395122 & 2.58291660487787 \tabularnewline
21 & 115 & 117.465835537643 & -2.46583553764267 \tabularnewline
22 & 117.3 & 114.86694971935 & 2.43305028064981 \tabularnewline
23 & 119.4 & 122.105286134203 & -2.70528613420306 \tabularnewline
24 & 114.9 & 116.208143231518 & -1.30814323151785 \tabularnewline
25 & 125.8 & 124.904671349021 & 0.895328650978765 \tabularnewline
26 & 117.6 & 115.390533381706 & 2.20946661829429 \tabularnewline
27 & 117.6 & 117.705560936027 & -0.105560936026954 \tabularnewline
28 & 114.9 & 121.293127106314 & -6.39312710631384 \tabularnewline
29 & 121.9 & 118.06940980504 & 3.83059019495954 \tabularnewline
30 & 117 & 120.131595722189 & -3.13159572218863 \tabularnewline
31 & 106.4 & 111.931494519179 & -5.53149451917855 \tabularnewline
32 & 110.5 & 118.47450128476 & -7.9745012847599 \tabularnewline
33 & 113.6 & 113.272952233548 & 0.327047766452166 \tabularnewline
34 & 114.2 & 111.119710151043 & 3.08028984895724 \tabularnewline
35 & 125.4 & 123.020383761642 & 2.37961623835808 \tabularnewline
36 & 124.6 & 120.455469812908 & 4.14453018709216 \tabularnewline
37 & 120.2 & 121.170464168876 & -0.970464168875844 \tabularnewline
38 & 120.8 & 120.92701698131 & -0.127016981309569 \tabularnewline
39 & 111.4 & 116.522604829398 & -5.12260482939778 \tabularnewline
40 & 124.1 & 118.5424936849 & 5.55750631509989 \tabularnewline
41 & 120.2 & 120.243288612376 & -0.043288612376111 \tabularnewline
42 & 125.5 & 117.156026178118 & 8.3439738218825 \tabularnewline
43 & 116 & 114.954547108653 & 1.04545289134669 \tabularnewline
44 & 117 & 116.372118501824 & 0.627881498176457 \tabularnewline
45 & 105.7 & 106.389912151036 & -0.689912151036261 \tabularnewline
46 & 102 & 105.790051599615 & -3.79005159961503 \tabularnewline
47 & 106.4 & 106.844962716486 & -0.444962716485515 \tabularnewline
48 & 96.9 & 102.449161346213 & -5.5491613462131 \tabularnewline
49 & 107.6 & 108.249093820847 & -0.649093820846925 \tabularnewline
50 & 98.8 & 100.313156800995 & -1.51315680099467 \tabularnewline
51 & 101.1 & 99.2192276937978 & 1.88077230620222 \tabularnewline
52 & 105.7 & 104.98928567605 & 0.710714323949584 \tabularnewline
53 & 104.6 & 106.256966521799 & -1.65696652179852 \tabularnewline
54 & 103.2 & 104.413153397503 & -1.21315339750343 \tabularnewline
55 & 101.6 & 100.210376454649 & 1.38962354535145 \tabularnewline
56 & 106.7 & 103.485659353011 & 3.21434064698903 \tabularnewline
57 & 99.5 & 98.9917238812775 & 0.508276118722536 \tabularnewline
58 & 101 & 98.9339108495244 & 2.06608915047556 \tabularnewline
\hline
\end{tabular}
%Source: https://freestatistics.org/blog/index.php?pk=111859&T=4

[TABLE]
[ROW][C]Multiple Linear Regression - Actuals, Interpolation, and Residuals[/C][/ROW]
[ROW][C]Time or Index[/C][C]Actuals[/C][C]InterpolationForecast[/C][C]ResidualsPrediction Error[/C][/ROW]
[ROW][C]1[/C][C]116.7[/C][C]116.793696026955[/C][C]-0.0936960269545876[/C][/ROW]
[ROW][C]2[/C][C]112.5[/C][C]112.865685087896[/C][C]-0.365685087895518[/C][/ROW]
[ROW][C]3[/C][C]113[/C][C]111.118957740513[/C][C]1.88104225948694[/C][/ROW]
[ROW][C]4[/C][C]126.4[/C][C]119.95632806921[/C][C]6.44367193079011[/C][/ROW]
[ROW][C]5[/C][C]114.1[/C][C]115.169270746585[/C][C]-1.06927074658506[/C][/ROW]
[ROW][C]6[/C][C]112.5[/C][C]116.964979688501[/C][C]-4.46497968850097[/C][/ROW]
[ROW][C]7[/C][C]112.4[/C][C]112.677267470406[/C][C]-0.277267470405825[/C][/ROW]
[ROW][C]8[/C][C]113.1[/C][C]111.550637465283[/C][C]1.54936253471654[/C][/ROW]
[ROW][C]9[/C][C]116.3[/C][C]113.979576196496[/C][C]2.32042380350423[/C][/ROW]
[ROW][C]10[/C][C]111.7[/C][C]115.489377680468[/C][C]-3.78937768046757[/C][/ROW]
[ROW][C]11[/C][C]118.8[/C][C]118.029367387669[/C][C]0.770632612330495[/C][/ROW]
[ROW][C]12[/C][C]116.5[/C][C]113.787225609361[/C][C]2.71277439063878[/C][/ROW]
[ROW][C]13[/C][C]125.1[/C][C]124.282074634301[/C][C]0.817925365698592[/C][/ROW]
[ROW][C]14[/C][C]113.1[/C][C]113.303607748095[/C][C]-0.203607748094534[/C][/ROW]
[ROW][C]15[/C][C]119.6[/C][C]118.133648800264[/C][C]1.46635119973557[/C][/ROW]
[ROW][C]16[/C][C]114.4[/C][C]120.718765463526[/C][C]-6.31876546352574[/C][/ROW]
[ROW][C]17[/C][C]114[/C][C]115.0610643142[/C][C]-1.06106431419985[/C][/ROW]
[ROW][C]18[/C][C]117.8[/C][C]117.334245013689[/C][C]0.46575498631052[/C][/ROW]
[ROW][C]19[/C][C]117[/C][C]113.626314447114[/C][C]3.37368555288624[/C][/ROW]
[ROW][C]20[/C][C]120.9[/C][C]118.317083395122[/C][C]2.58291660487787[/C][/ROW]
[ROW][C]21[/C][C]115[/C][C]117.465835537643[/C][C]-2.46583553764267[/C][/ROW]
[ROW][C]22[/C][C]117.3[/C][C]114.86694971935[/C][C]2.43305028064981[/C][/ROW]
[ROW][C]23[/C][C]119.4[/C][C]122.105286134203[/C][C]-2.70528613420306[/C][/ROW]
[ROW][C]24[/C][C]114.9[/C][C]116.208143231518[/C][C]-1.30814323151785[/C][/ROW]
[ROW][C]25[/C][C]125.8[/C][C]124.904671349021[/C][C]0.895328650978765[/C][/ROW]
[ROW][C]26[/C][C]117.6[/C][C]115.390533381706[/C][C]2.20946661829429[/C][/ROW]
[ROW][C]27[/C][C]117.6[/C][C]117.705560936027[/C][C]-0.105560936026954[/C][/ROW]
[ROW][C]28[/C][C]114.9[/C][C]121.293127106314[/C][C]-6.39312710631384[/C][/ROW]
[ROW][C]29[/C][C]121.9[/C][C]118.06940980504[/C][C]3.83059019495954[/C][/ROW]
[ROW][C]30[/C][C]117[/C][C]120.131595722189[/C][C]-3.13159572218863[/C][/ROW]
[ROW][C]31[/C][C]106.4[/C][C]111.931494519179[/C][C]-5.53149451917855[/C][/ROW]
[ROW][C]32[/C][C]110.5[/C][C]118.47450128476[/C][C]-7.9745012847599[/C][/ROW]
[ROW][C]33[/C][C]113.6[/C][C]113.272952233548[/C][C]0.327047766452166[/C][/ROW]
[ROW][C]34[/C][C]114.2[/C][C]111.119710151043[/C][C]3.08028984895724[/C][/ROW]
[ROW][C]35[/C][C]125.4[/C][C]123.020383761642[/C][C]2.37961623835808[/C][/ROW]
[ROW][C]36[/C][C]124.6[/C][C]120.455469812908[/C][C]4.14453018709216[/C][/ROW]
[ROW][C]37[/C][C]120.2[/C][C]121.170464168876[/C][C]-0.970464168875844[/C][/ROW]
[ROW][C]38[/C][C]120.8[/C][C]120.92701698131[/C][C]-0.127016981309569[/C][/ROW]
[ROW][C]39[/C][C]111.4[/C][C]116.522604829398[/C][C]-5.12260482939778[/C][/ROW]
[ROW][C]40[/C][C]124.1[/C][C]118.5424936849[/C][C]5.55750631509989[/C][/ROW]
[ROW][C]41[/C][C]120.2[/C][C]120.243288612376[/C][C]-0.043288612376111[/C][/ROW]
[ROW][C]42[/C][C]125.5[/C][C]117.156026178118[/C][C]8.3439738218825[/C][/ROW]
[ROW][C]43[/C][C]116[/C][C]114.954547108653[/C][C]1.04545289134669[/C][/ROW]
[ROW][C]44[/C][C]117[/C][C]116.372118501824[/C][C]0.627881498176457[/C][/ROW]
[ROW][C]45[/C][C]105.7[/C][C]106.389912151036[/C][C]-0.689912151036261[/C][/ROW]
[ROW][C]46[/C][C]102[/C][C]105.790051599615[/C][C]-3.79005159961503[/C][/ROW]
[ROW][C]47[/C][C]106.4[/C][C]106.844962716486[/C][C]-0.444962716485515[/C][/ROW]
[ROW][C]48[/C][C]96.9[/C][C]102.449161346213[/C][C]-5.5491613462131[/C][/ROW]
[ROW][C]49[/C][C]107.6[/C][C]108.249093820847[/C][C]-0.649093820846925[/C][/ROW]
[ROW][C]50[/C][C]98.8[/C][C]100.313156800995[/C][C]-1.51315680099467[/C][/ROW]
[ROW][C]51[/C][C]101.1[/C][C]99.2192276937978[/C][C]1.88077230620222[/C][/ROW]
[ROW][C]52[/C][C]105.7[/C][C]104.98928567605[/C][C]0.710714323949584[/C][/ROW]
[ROW][C]53[/C][C]104.6[/C][C]106.256966521799[/C][C]-1.65696652179852[/C][/ROW]
[ROW][C]54[/C][C]103.2[/C][C]104.413153397503[/C][C]-1.21315339750343[/C][/ROW]
[ROW][C]55[/C][C]101.6[/C][C]100.210376454649[/C][C]1.38962354535145[/C][/ROW]
[ROW][C]56[/C][C]106.7[/C][C]103.485659353011[/C][C]3.21434064698903[/C][/ROW]
[ROW][C]57[/C][C]99.5[/C][C]98.9917238812775[/C][C]0.508276118722536[/C][/ROW]
[ROW][C]58[/C][C]101[/C][C]98.9339108495244[/C][C]2.06608915047556[/C][/ROW]
[/TABLE]
Source: https://freestatistics.org/blog/index.php?pk=111859&T=4

Globally Unique Identifier (entire table): ba.freestatistics.org/blog/index.php?pk=111859&T=4

As an alternative you can also use a QR Code:  

The GUIDs for individual cells are displayed in the table below:

Multiple Linear Regression - Actuals, Interpolation, and Residuals
Time or IndexActualsInterpolationForecastResidualsPrediction Error
1116.7116.793696026955-0.0936960269545876
2112.5112.865685087896-0.365685087895518
3113111.1189577405131.88104225948694
4126.4119.956328069216.44367193079011
5114.1115.169270746585-1.06927074658506
6112.5116.964979688501-4.46497968850097
7112.4112.677267470406-0.277267470405825
8113.1111.5506374652831.54936253471654
9116.3113.9795761964962.32042380350423
10111.7115.489377680468-3.78937768046757
11118.8118.0293673876690.770632612330495
12116.5113.7872256093612.71277439063878
13125.1124.2820746343010.817925365698592
14113.1113.303607748095-0.203607748094534
15119.6118.1336488002641.46635119973557
16114.4120.718765463526-6.31876546352574
17114115.0610643142-1.06106431419985
18117.8117.3342450136890.46575498631052
19117113.6263144471143.37368555288624
20120.9118.3170833951222.58291660487787
21115117.465835537643-2.46583553764267
22117.3114.866949719352.43305028064981
23119.4122.105286134203-2.70528613420306
24114.9116.208143231518-1.30814323151785
25125.8124.9046713490210.895328650978765
26117.6115.3905333817062.20946661829429
27117.6117.705560936027-0.105560936026954
28114.9121.293127106314-6.39312710631384
29121.9118.069409805043.83059019495954
30117120.131595722189-3.13159572218863
31106.4111.931494519179-5.53149451917855
32110.5118.47450128476-7.9745012847599
33113.6113.2729522335480.327047766452166
34114.2111.1197101510433.08028984895724
35125.4123.0203837616422.37961623835808
36124.6120.4554698129084.14453018709216
37120.2121.170464168876-0.970464168875844
38120.8120.92701698131-0.127016981309569
39111.4116.522604829398-5.12260482939778
40124.1118.54249368495.55750631509989
41120.2120.243288612376-0.043288612376111
42125.5117.1560261781188.3439738218825
43116114.9545471086531.04545289134669
44117116.3721185018240.627881498176457
45105.7106.389912151036-0.689912151036261
46102105.790051599615-3.79005159961503
47106.4106.844962716486-0.444962716485515
4896.9102.449161346213-5.5491613462131
49107.6108.249093820847-0.649093820846925
5098.8100.313156800995-1.51315680099467
51101.199.21922769379781.88077230620222
52105.7104.989285676050.710714323949584
53104.6106.256966521799-1.65696652179852
54103.2104.413153397503-1.21315339750343
55101.6100.2103764546491.38962354535145
56106.7103.4856593530113.21434064698903
5799.598.99172388127750.508276118722536
5810198.93391084952442.06608915047556


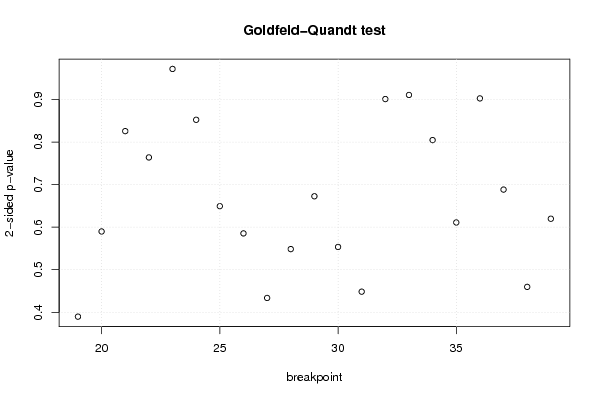
Goldfeld-Quandt test for Heteroskedasticity
p-valuesAlternative Hypothesis
breakpoint indexgreater2-sidedless
190.8051327333793450.3897345332413090.194867266620655
200.7050336050579320.5899327898841360.294966394942068
210.5871037035473560.8257925929052890.412896296452644
220.6180237729193760.7639524541612470.381976227080624
230.5140448156183470.9719103687633060.485955184381653
240.4262109615699520.8524219231399050.573789038430048
250.3247051113675810.6494102227351630.675294888632419
260.2927107875746520.5854215751493040.707289212425348
270.2168165865433260.4336331730866530.783183413456674
280.2742513418458690.5485026836917380.725748658154131
290.3363323203048310.6726646406096620.663667679695169
300.2767511704450430.5535023408900860.723248829554957
310.2242203369019020.4484406738038040.775779663098098
320.5494314599984170.9011370800031650.450568540001583
330.4553825838536710.9107651677073410.54461741614633
340.402350090750460.8047001815009190.59764990924954
350.3055331972282860.6110663944565730.694466802771714
360.451352713699890.902705427399780.54864728630011
370.3441789460235170.6883578920470330.655821053976483
380.2298648270540480.4597296541080960.770135172945952
390.3099201993602350.619840398720470.690079800639765

\begin{tabular}{lllllllll}
\hline
Goldfeld-Quandt test for Heteroskedasticity \tabularnewline
p-values & Alternative Hypothesis \tabularnewline
breakpoint index & greater & 2-sided & less \tabularnewline
19 & 0.805132733379345 & 0.389734533241309 & 0.194867266620655 \tabularnewline
20 & 0.705033605057932 & 0.589932789884136 & 0.294966394942068 \tabularnewline
21 & 0.587103703547356 & 0.825792592905289 & 0.412896296452644 \tabularnewline
22 & 0.618023772919376 & 0.763952454161247 & 0.381976227080624 \tabularnewline
23 & 0.514044815618347 & 0.971910368763306 & 0.485955184381653 \tabularnewline
24 & 0.426210961569952 & 0.852421923139905 & 0.573789038430048 \tabularnewline
25 & 0.324705111367581 & 0.649410222735163 & 0.675294888632419 \tabularnewline
26 & 0.292710787574652 & 0.585421575149304 & 0.707289212425348 \tabularnewline
27 & 0.216816586543326 & 0.433633173086653 & 0.783183413456674 \tabularnewline
28 & 0.274251341845869 & 0.548502683691738 & 0.725748658154131 \tabularnewline
29 & 0.336332320304831 & 0.672664640609662 & 0.663667679695169 \tabularnewline
30 & 0.276751170445043 & 0.553502340890086 & 0.723248829554957 \tabularnewline
31 & 0.224220336901902 & 0.448440673803804 & 0.775779663098098 \tabularnewline
32 & 0.549431459998417 & 0.901137080003165 & 0.450568540001583 \tabularnewline
33 & 0.455382583853671 & 0.910765167707341 & 0.54461741614633 \tabularnewline
34 & 0.40235009075046 & 0.804700181500919 & 0.59764990924954 \tabularnewline
35 & 0.305533197228286 & 0.611066394456573 & 0.694466802771714 \tabularnewline
36 & 0.45135271369989 & 0.90270542739978 & 0.54864728630011 \tabularnewline
37 & 0.344178946023517 & 0.688357892047033 & 0.655821053976483 \tabularnewline
38 & 0.229864827054048 & 0.459729654108096 & 0.770135172945952 \tabularnewline
39 & 0.309920199360235 & 0.61984039872047 & 0.690079800639765 \tabularnewline
\hline
\end{tabular}
%Source: https://freestatistics.org/blog/index.php?pk=111859&T=5

[TABLE]
[ROW][C]Goldfeld-Quandt test for Heteroskedasticity[/C][/ROW]
[ROW][C]p-values[/C][C]Alternative Hypothesis[/C][/ROW]
[ROW][C]breakpoint index[/C][C]greater[/C][C]2-sided[/C][C]less[/C][/ROW]
[ROW][C]19[/C][C]0.805132733379345[/C][C]0.389734533241309[/C][C]0.194867266620655[/C][/ROW]
[ROW][C]20[/C][C]0.705033605057932[/C][C]0.589932789884136[/C][C]0.294966394942068[/C][/ROW]
[ROW][C]21[/C][C]0.587103703547356[/C][C]0.825792592905289[/C][C]0.412896296452644[/C][/ROW]
[ROW][C]22[/C][C]0.618023772919376[/C][C]0.763952454161247[/C][C]0.381976227080624[/C][/ROW]
[ROW][C]23[/C][C]0.514044815618347[/C][C]0.971910368763306[/C][C]0.485955184381653[/C][/ROW]
[ROW][C]24[/C][C]0.426210961569952[/C][C]0.852421923139905[/C][C]0.573789038430048[/C][/ROW]
[ROW][C]25[/C][C]0.324705111367581[/C][C]0.649410222735163[/C][C]0.675294888632419[/C][/ROW]
[ROW][C]26[/C][C]0.292710787574652[/C][C]0.585421575149304[/C][C]0.707289212425348[/C][/ROW]
[ROW][C]27[/C][C]0.216816586543326[/C][C]0.433633173086653[/C][C]0.783183413456674[/C][/ROW]
[ROW][C]28[/C][C]0.274251341845869[/C][C]0.548502683691738[/C][C]0.725748658154131[/C][/ROW]
[ROW][C]29[/C][C]0.336332320304831[/C][C]0.672664640609662[/C][C]0.663667679695169[/C][/ROW]
[ROW][C]30[/C][C]0.276751170445043[/C][C]0.553502340890086[/C][C]0.723248829554957[/C][/ROW]
[ROW][C]31[/C][C]0.224220336901902[/C][C]0.448440673803804[/C][C]0.775779663098098[/C][/ROW]
[ROW][C]32[/C][C]0.549431459998417[/C][C]0.901137080003165[/C][C]0.450568540001583[/C][/ROW]
[ROW][C]33[/C][C]0.455382583853671[/C][C]0.910765167707341[/C][C]0.54461741614633[/C][/ROW]
[ROW][C]34[/C][C]0.40235009075046[/C][C]0.804700181500919[/C][C]0.59764990924954[/C][/ROW]
[ROW][C]35[/C][C]0.305533197228286[/C][C]0.611066394456573[/C][C]0.694466802771714[/C][/ROW]
[ROW][C]36[/C][C]0.45135271369989[/C][C]0.90270542739978[/C][C]0.54864728630011[/C][/ROW]
[ROW][C]37[/C][C]0.344178946023517[/C][C]0.688357892047033[/C][C]0.655821053976483[/C][/ROW]
[ROW][C]38[/C][C]0.229864827054048[/C][C]0.459729654108096[/C][C]0.770135172945952[/C][/ROW]
[ROW][C]39[/C][C]0.309920199360235[/C][C]0.61984039872047[/C][C]0.690079800639765[/C][/ROW]
[/TABLE]
Source: https://freestatistics.org/blog/index.php?pk=111859&T=5

Globally Unique Identifier (entire table): ba.freestatistics.org/blog/index.php?pk=111859&T=5

As an alternative you can also use a QR Code:  

The GUIDs for individual cells are displayed in the table below:

Goldfeld-Quandt test for Heteroskedasticity
p-valuesAlternative Hypothesis
breakpoint indexgreater2-sidedless
190.8051327333793450.3897345332413090.194867266620655
200.7050336050579320.5899327898841360.294966394942068
210.5871037035473560.8257925929052890.412896296452644
220.6180237729193760.7639524541612470.381976227080624
230.5140448156183470.9719103687633060.485955184381653
240.4262109615699520.8524219231399050.573789038430048
250.3247051113675810.6494102227351630.675294888632419
260.2927107875746520.5854215751493040.707289212425348
270.2168165865433260.4336331730866530.783183413456674
280.2742513418458690.5485026836917380.725748658154131
290.3363323203048310.6726646406096620.663667679695169
300.2767511704450430.5535023408900860.723248829554957
310.2242203369019020.4484406738038040.775779663098098
320.5494314599984170.9011370800031650.450568540001583
330.4553825838536710.9107651677073410.54461741614633
340.402350090750460.8047001815009190.59764990924954
350.3055331972282860.6110663944565730.694466802771714
360.451352713699890.902705427399780.54864728630011
370.3441789460235170.6883578920470330.655821053976483
380.2298648270540480.4597296541080960.770135172945952
390.3099201993602350.619840398720470.690079800639765


Meta Analysis of Goldfeld-Quandt test for Heteroskedasticity
Description# significant tests% significant testsOK/NOK
1% type I error level00OK
5% type I error level00OK
10% type I error level00OK

\begin{tabular}{lllllllll}
\hline
Meta Analysis of Goldfeld-Quandt test for Heteroskedasticity \tabularnewline
Description & # significant tests & % significant tests & OK/NOK \tabularnewline
1% type I error level & 0 & 0 & OK \tabularnewline
5% type I error level & 0 & 0 & OK \tabularnewline
10% type I error level & 0 & 0 & OK \tabularnewline
\hline
\end{tabular}
%Source: https://freestatistics.org/blog/index.php?pk=111859&T=6

[TABLE]
[ROW][C]Meta Analysis of Goldfeld-Quandt test for Heteroskedasticity[/C][/ROW]
[ROW][C]Description[/C][C]# significant tests[/C][C]% significant tests[/C][C]OK/NOK[/C][/ROW]
[ROW][C]1% type I error level[/C][C]0[/C][C]0[/C][C]OK[/C][/ROW]
[ROW][C]5% type I error level[/C][C]0[/C][C]0[/C][C]OK[/C][/ROW]
[ROW][C]10% type I error level[/C][C]0[/C][C]0[/C][C]OK[/C][/ROW]
[/TABLE]
Source: https://freestatistics.org/blog/index.php?pk=111859&T=6

Globally Unique Identifier (entire table): ba.freestatistics.org/blog/index.php?pk=111859&T=6

As an alternative you can also use a QR Code:  

The GUIDs for individual cells are displayed in the table below:

Meta Analysis of Goldfeld-Quandt test for Heteroskedasticity
Description# significant tests% significant testsOK/NOK
1% type I error level00OK
5% type I error level00OK
10% type I error level00OK


Parameters (Session):
par1 = 2 ; par2 = Include Monthly Dummies ; par3 = Linear Trend ;
Parameters (R input):
par1 = 2 ; par2 = Include Monthly Dummies ; par3 = Linear Trend ;
R code (references can be found in the software module):
library(lattice)
library(lmtest)
n25 <- 25 #minimum number of obs. for Goldfeld-Quandt test
par1 <- as.numeric(par1)
x <- t(y)
k <- length(x[1,])
n <- length(x[,1])
x1 <- cbind(x[,par1], x[,1:k!=par1])
mycolnames <- c(colnames(x)[par1], colnames(x)[1:k!=par1])
colnames(x1) <- mycolnames #colnames(x)[par1]
x <- x1
if (par3 == 'First Differences'){
x2 <- array(0, dim=c(n-1,k), dimnames=list(1:(n-1), paste('(1-B)',colnames(x),sep='')))
for (i in 1:n-1) {
for (j in 1:k) {
x2[i,j] <- x[i+1,j] - x[i,j]
}
}
x <- x2
}
if (par2 == 'Include Monthly Dummies'){
x2 <- array(0, dim=c(n,11), dimnames=list(1:n, paste('M', seq(1:11), sep ='')))
for (i in 1:11){
x2[seq(i,n,12),i] <- 1
}
x <- cbind(x, x2)
}
if (par2 == 'Include Quarterly Dummies'){
x2 <- array(0, dim=c(n,3), dimnames=list(1:n, paste('Q', seq(1:3), sep ='')))
for (i in 1:3){
x2[seq(i,n,4),i] <- 1
}
x <- cbind(x, x2)
}
k <- length(x[1,])
if (par3 == 'Linear Trend'){
x <- cbind(x, c(1:n))
colnames(x)[k+1] <- 't'
}
x
k <- length(x[1,])
df <- as.data.frame(x)
(mylm <- lm(df))
(mysum <- summary(mylm))
if (n > n25) {
kp3 <- k + 3
nmkm3 <- n - k - 3
gqarr <- array(NA, dim=c(nmkm3-kp3+1,3))
numgqtests <- 0
numsignificant1 <- 0
numsignificant5 <- 0
numsignificant10 <- 0
for (mypoint in kp3:nmkm3) {
j <- 0
numgqtests <- numgqtests + 1
for (myalt in c('greater', 'two.sided', 'less')) {
j <- j + 1
gqarr[mypoint-kp3+1,j] <- gqtest(mylm, point=mypoint, alternative=myalt)$p.value
}
if (gqarr[mypoint-kp3+1,2] < 0.01) numsignificant1 <- numsignificant1 + 1
if (gqarr[mypoint-kp3+1,2] < 0.05) numsignificant5 <- numsignificant5 + 1
if (gqarr[mypoint-kp3+1,2] < 0.10) numsignificant10 <- numsignificant10 + 1
}
gqarr
}
bitmap(file='test0.png')
plot(x[,1], type='l', main='Actuals and Interpolation', ylab='value of Actuals and Interpolation (dots)', xlab='time or index')
points(x[,1]-mysum$resid)
grid()
dev.off()
bitmap(file='test1.png')
plot(mysum$resid, type='b', pch=19, main='Residuals', ylab='value of Residuals', xlab='time or index')
grid()
dev.off()
bitmap(file='test2.png')
hist(mysum$resid, main='Residual Histogram', xlab='values of Residuals')
grid()
dev.off()
bitmap(file='test3.png')
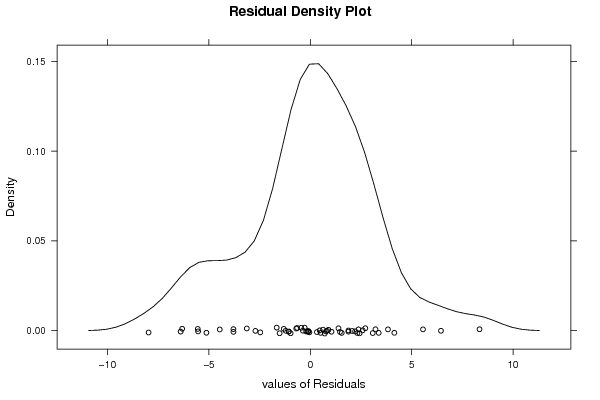
densityplot(~mysum$resid,col='black',main='Residual Density Plot', xlab='values of Residuals')
dev.off()
bitmap(file='test4.png')
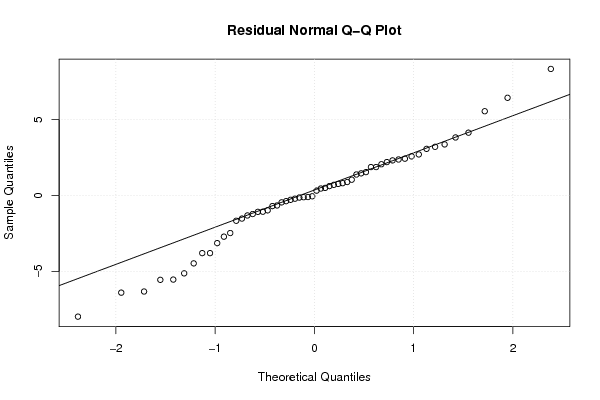
qqnorm(mysum$resid, main='Residual Normal Q-Q Plot')
qqline(mysum$resid)
grid()
dev.off()
(myerror <- as.ts(mysum$resid))
bitmap(file='test5.png')
dum <- cbind(lag(myerror,k=1),myerror)
dum
dum1 <- dum[2:length(myerror),]
dum1
z <- as.data.frame(dum1)
z
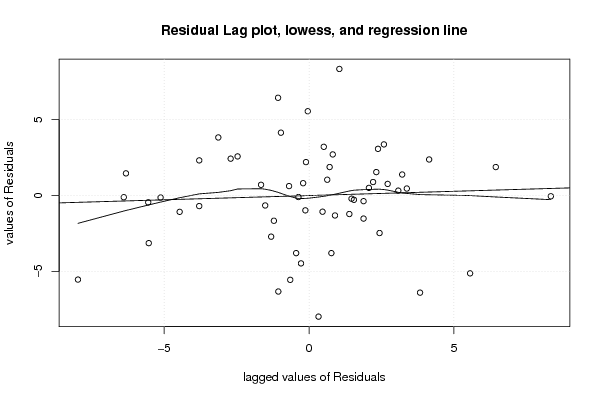
plot(z,main=paste('Residual Lag plot, lowess, and regression line'), ylab='values of Residuals', xlab='lagged values of Residuals')
lines(lowess(z))
abline(lm(z))
grid()
dev.off()
bitmap(file='test6.png')
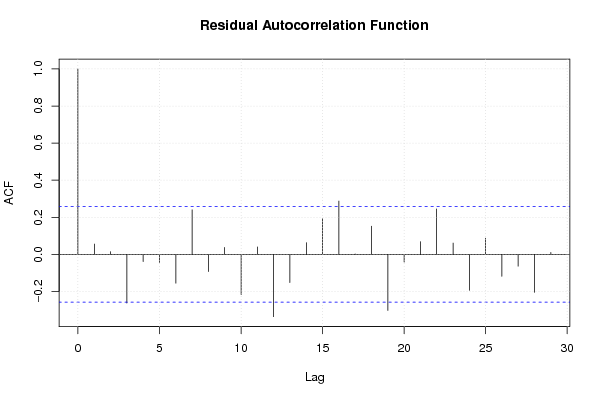
acf(mysum$resid, lag.max=length(mysum$resid)/2, main='Residual Autocorrelation Function')
grid()
dev.off()
bitmap(file='test7.png')
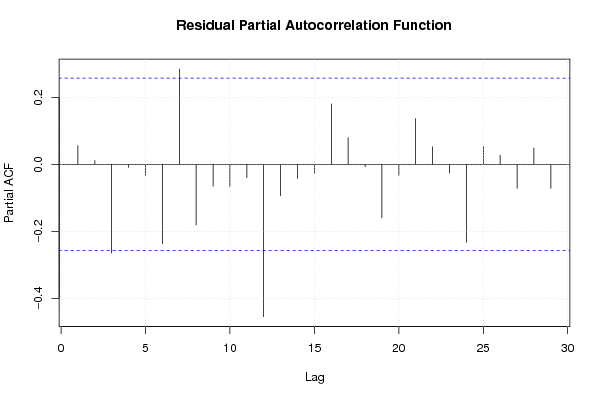
pacf(mysum$resid, lag.max=length(mysum$resid)/2, main='Residual Partial Autocorrelation Function')
grid()
dev.off()
bitmap(file='test8.png')
opar <- par(mfrow = c(2,2), oma = c(0, 0, 1.1, 0))
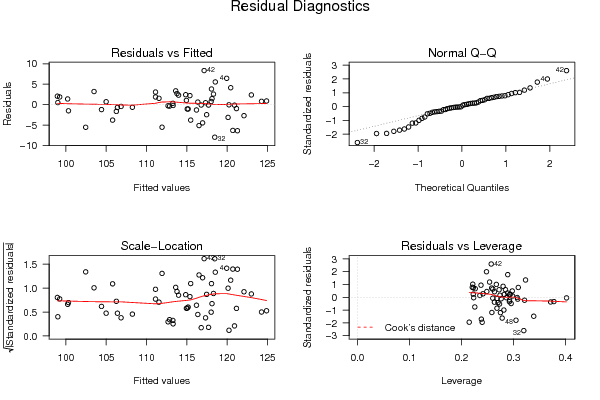
plot(mylm, las = 1, sub='Residual Diagnostics')
par(opar)
dev.off()
if (n > n25) {
bitmap(file='test9.png')
plot(kp3:nmkm3,gqarr[,2], main='Goldfeld-Quandt test',ylab='2-sided p-value',xlab='breakpoint')
grid()
dev.off()
}
load(file='createtable')
a<-table.start()
a<-table.row.start(a)
a<-table.element(a, 'Multiple Linear Regression - Estimated Regression Equation', 1, TRUE)
a<-table.row.end(a)
myeq <- colnames(x)[1]
myeq <- paste(myeq, '[t] = ', sep='')
for (i in 1:k){
if (mysum$coefficients[i,1] > 0) myeq <- paste(myeq, '+', '')
myeq <- paste(myeq, mysum$coefficients[i,1], sep=' ')
if (rownames(mysum$coefficients)[i] != '(Intercept)') {
myeq <- paste(myeq, rownames(mysum$coefficients)[i], sep='')
if (rownames(mysum$coefficients)[i] != 't') myeq <- paste(myeq, '[t]', sep='')
}
}
myeq <- paste(myeq, ' + e[t]')
a<-table.row.start(a)
a<-table.element(a, myeq)
a<-table.row.end(a)
a<-table.end(a)
table.save(a,file='mytable1.tab')
a<-table.start()
a<-table.row.start(a)
a<-table.element(a,hyperlink('ols1.htm','Multiple Linear Regression - Ordinary Least Squares',''), 6, TRUE)
a<-table.row.end(a)
a<-table.row.start(a)
a<-table.element(a,'Variable',header=TRUE)
a<-table.element(a,'Parameter',header=TRUE)
a<-table.element(a,'S.D.',header=TRUE)
a<-table.element(a,'T-STAT
H0: parameter = 0',header=TRUE)
a<-table.element(a,'2-tail p-value',header=TRUE)
a<-table.element(a,'1-tail p-value',header=TRUE)
a<-table.row.end(a)
for (i in 1:k){
a<-table.row.start(a)
a<-table.element(a,rownames(mysum$coefficients)[i],header=TRUE)
a<-table.element(a,mysum$coefficients[i,1])
a<-table.element(a, round(mysum$coefficients[i,2],6))
a<-table.element(a, round(mysum$coefficients[i,3],4))
a<-table.element(a, round(mysum$coefficients[i,4],6))
a<-table.element(a, round(mysum$coefficients[i,4]/2,6))
a<-table.row.end(a)
}
a<-table.end(a)
table.save(a,file='mytable2.tab')
a<-table.start()
a<-table.row.start(a)
a<-table.element(a, 'Multiple Linear Regression - Regression Statistics', 2, TRUE)
a<-table.row.end(a)
a<-table.row.start(a)
a<-table.element(a, 'Multiple R',1,TRUE)
a<-table.element(a, sqrt(mysum$r.squared))
a<-table.row.end(a)
a<-table.row.start(a)
a<-table.element(a, 'R-squared',1,TRUE)
a<-table.element(a, mysum$r.squared)
a<-table.row.end(a)
a<-table.row.start(a)
a<-table.element(a, 'Adjusted R-squared',1,TRUE)
a<-table.element(a, mysum$adj.r.squared)
a<-table.row.end(a)
a<-table.row.start(a)
a<-table.element(a, 'F-TEST (value)',1,TRUE)
a<-table.element(a, mysum$fstatistic[1])
a<-table.row.end(a)
a<-table.row.start(a)
a<-table.element(a, 'F-TEST (DF numerator)',1,TRUE)
a<-table.element(a, mysum$fstatistic[2])
a<-table.row.end(a)
a<-table.row.start(a)
a<-table.element(a, 'F-TEST (DF denominator)',1,TRUE)
a<-table.element(a, mysum$fstatistic[3])
a<-table.row.end(a)
a<-table.row.start(a)
a<-table.element(a, 'p-value',1,TRUE)
a<-table.element(a, 1-pf(mysum$fstatistic[1],mysum$fstatistic[2],mysum$fstatistic[3]))
a<-table.row.end(a)
a<-table.row.start(a)
a<-table.element(a, 'Multiple Linear Regression - Residual Statistics', 2, TRUE)
a<-table.row.end(a)
a<-table.row.start(a)
a<-table.element(a, 'Residual Standard Deviation',1,TRUE)
a<-table.element(a, mysum$sigma)
a<-table.row.end(a)
a<-table.row.start(a)
a<-table.element(a, 'Sum Squared Residuals',1,TRUE)
a<-table.element(a, sum(myerror*myerror))
a<-table.row.end(a)
a<-table.end(a)
table.save(a,file='mytable3.tab')
a<-table.start()
a<-table.row.start(a)
a<-table.element(a, 'Multiple Linear Regression - Actuals, Interpolation, and Residuals', 4, TRUE)
a<-table.row.end(a)
a<-table.row.start(a)
a<-table.element(a, 'Time or Index', 1, TRUE)
a<-table.element(a, 'Actuals', 1, TRUE)
a<-table.element(a, 'Interpolation
Forecast', 1, TRUE)
a<-table.element(a, 'Residuals
Prediction Error', 1, TRUE)
a<-table.row.end(a)
for (i in 1:n) {
a<-table.row.start(a)
a<-table.element(a,i, 1, TRUE)
a<-table.element(a,x[i])
a<-table.element(a,x[i]-mysum$resid[i])
a<-table.element(a,mysum$resid[i])
a<-table.row.end(a)
}
a<-table.end(a)
table.save(a,file='mytable4.tab')
if (n > n25) {
a<-table.start()
a<-table.row.start(a)
a<-table.element(a,'Goldfeld-Quandt test for Heteroskedasticity',4,TRUE)
a<-table.row.end(a)
a<-table.row.start(a)
a<-table.element(a,'p-values',header=TRUE)
a<-table.element(a,'Alternative Hypothesis',3,header=TRUE)
a<-table.row.end(a)
a<-table.row.start(a)
a<-table.element(a,'breakpoint index',header=TRUE)
a<-table.element(a,'greater',header=TRUE)
a<-table.element(a,'2-sided',header=TRUE)
a<-table.element(a,'less',header=TRUE)
a<-table.row.end(a)
for (mypoint in kp3:nmkm3) {
a<-table.row.start(a)
a<-table.element(a,mypoint,header=TRUE)
a<-table.element(a,gqarr[mypoint-kp3+1,1])
a<-table.element(a,gqarr[mypoint-kp3+1,2])
a<-table.element(a,gqarr[mypoint-kp3+1,3])
a<-table.row.end(a)
}
a<-table.end(a)
table.save(a,file='mytable5.tab')
a<-table.start()
a<-table.row.start(a)
a<-table.element(a,'Meta Analysis of Goldfeld-Quandt test for Heteroskedasticity',4,TRUE)
a<-table.row.end(a)
a<-table.row.start(a)
a<-table.element(a,'Description',header=TRUE)
a<-table.element(a,'# significant tests',header=TRUE)
a<-table.element(a,'% significant tests',header=TRUE)
a<-table.element(a,'OK/NOK',header=TRUE)
a<-table.row.end(a)
a<-table.row.start(a)
a<-table.element(a,'1% type I error level',header=TRUE)
a<-table.element(a,numsignificant1)
a<-table.element(a,numsignificant1/numgqtests)
if (numsignificant1/numgqtests < 0.01) dum <- 'OK' else dum <- 'NOK'
a<-table.element(a,dum)
a<-table.row.end(a)
a<-table.row.start(a)
a<-table.element(a,'5% type I error level',header=TRUE)
a<-table.element(a,numsignificant5)
a<-table.element(a,numsignificant5/numgqtests)
if (numsignificant5/numgqtests < 0.05) dum <- 'OK' else dum <- 'NOK'
a<-table.element(a,dum)
a<-table.row.end(a)
a<-table.row.start(a)
a<-table.element(a,'10% type I error level',header=TRUE)
a<-table.element(a,numsignificant10)
a<-table.element(a,numsignificant10/numgqtests)
if (numsignificant10/numgqtests < 0.1) dum <- 'OK' else dum <- 'NOK'
a<-table.element(a,dum)
a<-table.row.end(a)
a<-table.end(a)
table.save(a,file='mytable6.tab')
}