Free Statistics

of Irreproducible Research!

Author's title

Author*The author of this computation has been verified*
R Software Modulerwasp_multipleregression.wasp
Title produced by softwareMultiple Regression
Date of computationSat, 18 Dec 2010 10:36:49 +0000
Cite this page as followsStatistical Computations at FreeStatistics.org, Office for Research Development and Education, URL https://freestatistics.org/blog/index.php?v=date/2010/Dec/18/t1292668517m00jhtddurib7x9.htm/, Retrieved Tue, 30 Apr 2024 03:18:41 +0000
Statistical Computations at FreeStatistics.org, Office for Research Development and Education, URL https://freestatistics.org/blog/index.php?pk=111831, Retrieved Tue, 30 Apr 2024 03:18:41 +0000
QR Codes:

Original text written by user:
IsPrivate?No (this computation is public)
User-defined keywords
Estimated Impact157
Family? (F = Feedback message, R = changed R code, M = changed R Module, P = changed Parameters, D = changed Data)
-     [Multiple Regression] [Multiple Linear R...] [2010-12-18 10:17:24] [0ed8ad64bdfc801eaa95d5097964fc04]
-   PD    [Multiple Regression] [Include monthly d...] [2010-12-18 10:36:49] [19046f4a6967f3fb6f5f17d42e7d38f2] [Current]
Feedback Forum

Post a new message
Dataseries X:
94.6	116.1
95.9	107.5
104.7	116.7
102.8	112.5
98.1	113
113.9	126.4
80.9	114.1
95.7	112.5
113.2	112.4
105.9	113.1
108.8	116.3
102.3	111.7
99	118.8
100.7	116.5
115.5	125.1
100.7	113.1
109.9	119.6
114.6	114.4
85.4	114
100.5	117.8
114.8	117
116.5	120.9
112.9	115
102	117.3
106	119.4
105.3	114.9
118.8	125.8
106.1	117.6
109.3	117.6
117.2	114.9
92.5	121.9
104.2	117
112.5	106.4
122.4	110.5
113.3	113.6
100	114.2
110.7	125.4
112.8	124.6
109.8	120.2
117.3	120.8
109.1	111.4
115.9	124.1
96	120.2
99.8	125.5
116.8	116
115.7	117
99.4	105.7
94.3	102
91	106.4
93.2	96.9
103.1	107.6
94.1	98.8
91.8	101.1
102.7	105.7
82.6	104.6
89.1	103.2
104.5	101.6
105.1	106.7
95.1	99.5
88.7	101


Summary of computational transaction
Raw Inputview raw input (R code)
Raw Outputview raw output of R engine
Computing time5 seconds
R Server'RServer@AstonUniversity' @ vre.aston.ac.uk

\begin{tabular}{lllllllll}
\hline
Summary of computational transaction \tabularnewline
Raw Input & view raw input (R code)  \tabularnewline
Raw Output & view raw output of R engine  \tabularnewline
Computing time & 5 seconds \tabularnewline
R Server & 'RServer@AstonUniversity' @ vre.aston.ac.uk \tabularnewline
\hline
\end{tabular}
%Source: https://freestatistics.org/blog/index.php?pk=111831&T=0

[TABLE]
[ROW][C]Summary of computational transaction[/C][/ROW]
[ROW][C]Raw Input[/C][C]view raw input (R code) [/C][/ROW]
[ROW][C]Raw Output[/C][C]view raw output of R engine [/C][/ROW]
[ROW][C]Computing time[/C][C]5 seconds[/C][/ROW]
[ROW][C]R Server[/C][C]'RServer@AstonUniversity' @ vre.aston.ac.uk[/C][/ROW]
[/TABLE]
Source: https://freestatistics.org/blog/index.php?pk=111831&T=0

Globally Unique Identifier (entire table): ba.freestatistics.org/blog/index.php?pk=111831&T=0

As an alternative you can also use a QR Code:  

The GUIDs for individual cells are displayed in the table below:

Summary of computational transaction
Raw Inputview raw input (R code)
Raw Outputview raw output of R engine
Computing time5 seconds
R Server'RServer@AstonUniversity' @ vre.aston.ac.uk


Multiple Linear Regression - Estimated Regression Equation
I.P.C.N.[t] = + 23.6111951469457 + 0.87860460551051T.I.P.[t] + 5.51990710457055M1[t] -0.7798509747033M2[t] -1.51157150319578M3[t] -2.60179504114083M4[t] -2.12977646205495M5[t] -5.67051092486184M6[t] + 14.4884739629949M7[t] + 5.60855815779579M8[t] -11.6512086221066M9[t] -9.35894812229457M10[t] -6.6354228705087M11[t] + e[t]

\begin{tabular}{lllllllll}
\hline
Multiple Linear Regression - Estimated Regression Equation \tabularnewline
I.P.C.N.[t] =  +  23.6111951469457 +  0.87860460551051T.I.P.[t] +  5.51990710457055M1[t] -0.7798509747033M2[t] -1.51157150319578M3[t] -2.60179504114083M4[t] -2.12977646205495M5[t] -5.67051092486184M6[t] +  14.4884739629949M7[t] +  5.60855815779579M8[t] -11.6512086221066M9[t] -9.35894812229457M10[t] -6.6354228705087M11[t]  + e[t] \tabularnewline
\hline
\end{tabular}
%Source: https://freestatistics.org/blog/index.php?pk=111831&T=1

[TABLE]
[ROW][C]Multiple Linear Regression - Estimated Regression Equation[/C][/ROW]
[ROW][C]I.P.C.N.[t] =  +  23.6111951469457 +  0.87860460551051T.I.P.[t] +  5.51990710457055M1[t] -0.7798509747033M2[t] -1.51157150319578M3[t] -2.60179504114083M4[t] -2.12977646205495M5[t] -5.67051092486184M6[t] +  14.4884739629949M7[t] +  5.60855815779579M8[t] -11.6512086221066M9[t] -9.35894812229457M10[t] -6.6354228705087M11[t]  + e[t][/C][/ROW]
[/TABLE]
Source: https://freestatistics.org/blog/index.php?pk=111831&T=1

Globally Unique Identifier (entire table): ba.freestatistics.org/blog/index.php?pk=111831&T=1

As an alternative you can also use a QR Code:  

The GUIDs for individual cells are displayed in the table below:

Multiple Linear Regression - Estimated Regression Equation
I.P.C.N.[t] = + 23.6111951469457 + 0.87860460551051T.I.P.[t] + 5.51990710457055M1[t] -0.7798509747033M2[t] -1.51157150319578M3[t] -2.60179504114083M4[t] -2.12977646205495M5[t] -5.67051092486184M6[t] + 14.4884739629949M7[t] + 5.60855815779579M8[t] -11.6512086221066M9[t] -9.35894812229457M10[t] -6.6354228705087M11[t] + e[t]


Multiple Linear Regression - Ordinary Least Squares
VariableParameterS.D.T-STATH0: parameter = 02-tail p-value1-tail p-value
(Intercept)23.61119514694579.0578742.60670.012210.006105
T.I.P.0.878604605510510.0906729.689900
M15.519907104570552.823411.9550.0565390.028269
M2-0.77985097470332.836678-0.27490.7845850.392292
M3-1.511571503195783.046239-0.49620.622060.31103
M4-2.601795041140832.877615-0.90410.3705270.185264
M5-2.129776462054952.867261-0.74280.4613050.230652
M6-5.670510924861843.139585-1.80610.0773030.038652
M714.48847396299492.9539894.90471.2e-056e-06
M85.608558157795792.8122061.99440.0519310.025966
M9-11.65120862210663.119686-3.73470.0005080.000254
M10-9.358948122294573.150141-2.9710.0046660.002333
M11-6.63542287050872.914247-2.27690.0273880.013694

\begin{tabular}{lllllllll}
\hline
Multiple Linear Regression - Ordinary Least Squares \tabularnewline
Variable & Parameter & S.D. & T-STATH0: parameter = 0 & 2-tail p-value & 1-tail p-value \tabularnewline
(Intercept) & 23.6111951469457 & 9.057874 & 2.6067 & 0.01221 & 0.006105 \tabularnewline
T.I.P. & 0.87860460551051 & 0.090672 & 9.6899 & 0 & 0 \tabularnewline
M1 & 5.51990710457055 & 2.82341 & 1.955 & 0.056539 & 0.028269 \tabularnewline
M2 & -0.7798509747033 & 2.836678 & -0.2749 & 0.784585 & 0.392292 \tabularnewline
M3 & -1.51157150319578 & 3.046239 & -0.4962 & 0.62206 & 0.31103 \tabularnewline
M4 & -2.60179504114083 & 2.877615 & -0.9041 & 0.370527 & 0.185264 \tabularnewline
M5 & -2.12977646205495 & 2.867261 & -0.7428 & 0.461305 & 0.230652 \tabularnewline
M6 & -5.67051092486184 & 3.139585 & -1.8061 & 0.077303 & 0.038652 \tabularnewline
M7 & 14.4884739629949 & 2.953989 & 4.9047 & 1.2e-05 & 6e-06 \tabularnewline
M8 & 5.60855815779579 & 2.812206 & 1.9944 & 0.051931 & 0.025966 \tabularnewline
M9 & -11.6512086221066 & 3.119686 & -3.7347 & 0.000508 & 0.000254 \tabularnewline
M10 & -9.35894812229457 & 3.150141 & -2.971 & 0.004666 & 0.002333 \tabularnewline
M11 & -6.6354228705087 & 2.914247 & -2.2769 & 0.027388 & 0.013694 \tabularnewline
\hline
\end{tabular}
%Source: https://freestatistics.org/blog/index.php?pk=111831&T=2

[TABLE]
[ROW][C]Multiple Linear Regression - Ordinary Least Squares[/C][/ROW]
[ROW][C]Variable[/C][C]Parameter[/C][C]S.D.[/C][C]T-STATH0: parameter = 0[/C][C]2-tail p-value[/C][C]1-tail p-value[/C][/ROW]
[ROW][C](Intercept)[/C][C]23.6111951469457[/C][C]9.057874[/C][C]2.6067[/C][C]0.01221[/C][C]0.006105[/C][/ROW]
[ROW][C]T.I.P.[/C][C]0.87860460551051[/C][C]0.090672[/C][C]9.6899[/C][C]0[/C][C]0[/C][/ROW]
[ROW][C]M1[/C][C]5.51990710457055[/C][C]2.82341[/C][C]1.955[/C][C]0.056539[/C][C]0.028269[/C][/ROW]
[ROW][C]M2[/C][C]-0.7798509747033[/C][C]2.836678[/C][C]-0.2749[/C][C]0.784585[/C][C]0.392292[/C][/ROW]
[ROW][C]M3[/C][C]-1.51157150319578[/C][C]3.046239[/C][C]-0.4962[/C][C]0.62206[/C][C]0.31103[/C][/ROW]
[ROW][C]M4[/C][C]-2.60179504114083[/C][C]2.877615[/C][C]-0.9041[/C][C]0.370527[/C][C]0.185264[/C][/ROW]
[ROW][C]M5[/C][C]-2.12977646205495[/C][C]2.867261[/C][C]-0.7428[/C][C]0.461305[/C][C]0.230652[/C][/ROW]
[ROW][C]M6[/C][C]-5.67051092486184[/C][C]3.139585[/C][C]-1.8061[/C][C]0.077303[/C][C]0.038652[/C][/ROW]
[ROW][C]M7[/C][C]14.4884739629949[/C][C]2.953989[/C][C]4.9047[/C][C]1.2e-05[/C][C]6e-06[/C][/ROW]
[ROW][C]M8[/C][C]5.60855815779579[/C][C]2.812206[/C][C]1.9944[/C][C]0.051931[/C][C]0.025966[/C][/ROW]
[ROW][C]M9[/C][C]-11.6512086221066[/C][C]3.119686[/C][C]-3.7347[/C][C]0.000508[/C][C]0.000254[/C][/ROW]
[ROW][C]M10[/C][C]-9.35894812229457[/C][C]3.150141[/C][C]-2.971[/C][C]0.004666[/C][C]0.002333[/C][/ROW]
[ROW][C]M11[/C][C]-6.6354228705087[/C][C]2.914247[/C][C]-2.2769[/C][C]0.027388[/C][C]0.013694[/C][/ROW]
[/TABLE]
Source: https://freestatistics.org/blog/index.php?pk=111831&T=2

Globally Unique Identifier (entire table): ba.freestatistics.org/blog/index.php?pk=111831&T=2

As an alternative you can also use a QR Code:  

The GUIDs for individual cells are displayed in the table below:

Multiple Linear Regression - Ordinary Least Squares
VariableParameterS.D.T-STATH0: parameter = 02-tail p-value1-tail p-value
(Intercept)23.61119514694579.0578742.60670.012210.006105
T.I.P.0.878604605510510.0906729.689900
M15.519907104570552.823411.9550.0565390.028269
M2-0.77985097470332.836678-0.27490.7845850.392292
M3-1.511571503195783.046239-0.49620.622060.31103
M4-2.601795041140832.877615-0.90410.3705270.185264
M5-2.129776462054952.867261-0.74280.4613050.230652
M6-5.670510924861843.139585-1.80610.0773030.038652
M714.48847396299492.9539894.90471.2e-056e-06
M85.608558157795792.8122061.99440.0519310.025966
M9-11.65120862210663.119686-3.73470.0005080.000254
M10-9.358948122294573.150141-2.9710.0046660.002333
M11-6.63542287050872.914247-2.27690.0273880.013694


Multiple Linear Regression - Regression Statistics
Multiple R0.848018397496842
R-squared0.719135202493113
Adjusted R-squared0.647425041427525
F-TEST (value)10.0283584893272
F-TEST (DF numerator)12
F-TEST (DF denominator)47
p-value2.47196385583237e-09
Multiple Linear Regression - Residual Statistics
Residual Standard Deviation4.44611803875628
Sum Squared Residuals929.09438388404

\begin{tabular}{lllllllll}
\hline
Multiple Linear Regression - Regression Statistics \tabularnewline
Multiple R & 0.848018397496842 \tabularnewline
R-squared & 0.719135202493113 \tabularnewline
Adjusted R-squared & 0.647425041427525 \tabularnewline
F-TEST (value) & 10.0283584893272 \tabularnewline
F-TEST (DF numerator) & 12 \tabularnewline
F-TEST (DF denominator) & 47 \tabularnewline
p-value & 2.47196385583237e-09 \tabularnewline
Multiple Linear Regression - Residual Statistics \tabularnewline
Residual Standard Deviation & 4.44611803875628 \tabularnewline
Sum Squared Residuals & 929.09438388404 \tabularnewline
\hline
\end{tabular}
%Source: https://freestatistics.org/blog/index.php?pk=111831&T=3

[TABLE]
[ROW][C]Multiple Linear Regression - Regression Statistics[/C][/ROW]
[ROW][C]Multiple R[/C][C]0.848018397496842[/C][/ROW]
[ROW][C]R-squared[/C][C]0.719135202493113[/C][/ROW]
[ROW][C]Adjusted R-squared[/C][C]0.647425041427525[/C][/ROW]
[ROW][C]F-TEST (value)[/C][C]10.0283584893272[/C][/ROW]
[ROW][C]F-TEST (DF numerator)[/C][C]12[/C][/ROW]
[ROW][C]F-TEST (DF denominator)[/C][C]47[/C][/ROW]
[ROW][C]p-value[/C][C]2.47196385583237e-09[/C][/ROW]
[ROW][C]Multiple Linear Regression - Residual Statistics[/C][/ROW]
[ROW][C]Residual Standard Deviation[/C][C]4.44611803875628[/C][/ROW]
[ROW][C]Sum Squared Residuals[/C][C]929.09438388404[/C][/ROW]
[/TABLE]
Source: https://freestatistics.org/blog/index.php?pk=111831&T=3

Globally Unique Identifier (entire table): ba.freestatistics.org/blog/index.php?pk=111831&T=3

As an alternative you can also use a QR Code:  

The GUIDs for individual cells are displayed in the table below:

Multiple Linear Regression - Regression Statistics
Multiple R0.848018397496842
R-squared0.719135202493113
Adjusted R-squared0.647425041427525
F-TEST (value)10.0283584893272
F-TEST (DF numerator)12
F-TEST (DF denominator)47
p-value2.47196385583237e-09
Multiple Linear Regression - Residual Statistics
Residual Standard Deviation4.44611803875628
Sum Squared Residuals929.09438388404


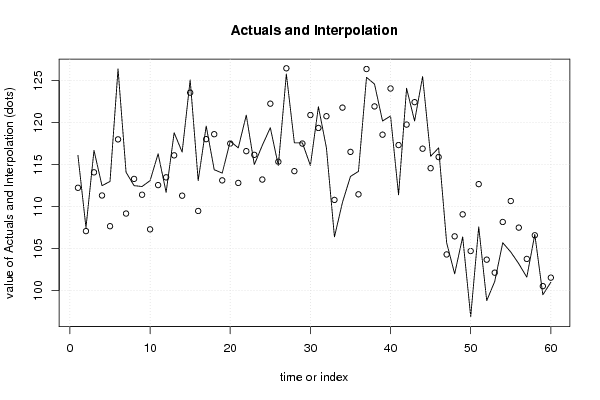
Multiple Linear Regression - Actuals, Interpolation, and Residuals
Time or IndexActualsInterpolationForecastResidualsPrediction Error
1116.1112.2470979328113.8529020671894
2107.5107.08952584070.410474159299678
3116.7114.08952584072.61047415929969
4112.5111.3299535522851.17004644771471
5113107.6725304854725.32746951452823
6126.4118.0137487897318.38625121026907
7114.1109.1787816957414.92121830425914
8112.5113.302214052097-0.802214052097304
9112.4111.4180278686290.981972131371171
10113.1107.2964747482145.80352525178587
11116.3112.567953355983.73204664401953
12111.7113.492446290671-1.79244629067086
13118.8116.1129581970572.68704180294325
14116.5111.3068279471515.19317205284925
15125.1123.5784555802141.52154441978619
16113.1109.4848838807133.61511611928678
17119.6118.0400648304961.5599351695042
18114.4118.628772013588-4.22877201358828
19114113.1325024205380.867497579461855
20117.8117.5195161585480.280483841452253
21117112.8237952374464.17620476255436
22120.9116.6096835666264.29031643337448
23115116.170232238574-1.17023223857357
24117.3113.2288649090184.07113509098228
25119.4122.26319043563-2.8631904356303
26114.9115.348409132499-0.448409132499083
27125.8126.477850778398-0.677850778398486
28117.6114.229348750473.37065124953003
29117.6117.5129020671890.087097932810516
30114.9120.913143987916-6.01314398791561
31121.9119.3705951196632.52940488033725
32117120.770353198937-3.77035319893663
33106.4110.803004644771-4.40300464477147
34110.5121.793450739138-11.2934507391375
35113.6116.521674080778-2.92167408077777
36114.2111.4716556979972.72834430200331
37125.4126.39263208153-0.992632081529695
38124.6121.9379436738282.66205632617209
39120.2118.5704093288041.6295906711961
40120.8124.069720332188-3.26972033218767
41111.4117.337181146087-5.93718114608737
42124.1119.7709580007524.32904199924804
43120.2122.44571123895-2.24571123894953
44125.5116.904492934698.59550706530962
45116114.5810044484671.41899555153334
46117115.9067998822171.09320011778288
47105.7104.3090700641821.39092993581831
48102106.463609446587-4.46360944658679
49106.4109.084121352973-2.68412135297266
5096.9104.717293405822-7.81729340582193
51107.6112.683758471883-5.0837584718835
5298.8103.686093484344-4.88609348434386
53101.1102.137321470756-1.03732147075558
54105.7108.173377208013-2.47337720801323
55104.6110.672409525109-6.07240952510871
56103.2107.503423655728-4.30342365572793
57101.6103.774167800687-2.1741678006874
58106.7106.5935910638060.106408936194294
5999.5100.531070260486-1.03107026048649
60101101.543423655728-0.543423655727943

\begin{tabular}{lllllllll}
\hline
Multiple Linear Regression - Actuals, Interpolation, and Residuals \tabularnewline
Time or Index & Actuals & InterpolationForecast & ResidualsPrediction Error \tabularnewline
1 & 116.1 & 112.247097932811 & 3.8529020671894 \tabularnewline
2 & 107.5 & 107.0895258407 & 0.410474159299678 \tabularnewline
3 & 116.7 & 114.0895258407 & 2.61047415929969 \tabularnewline
4 & 112.5 & 111.329953552285 & 1.17004644771471 \tabularnewline
5 & 113 & 107.672530485472 & 5.32746951452823 \tabularnewline
6 & 126.4 & 118.013748789731 & 8.38625121026907 \tabularnewline
7 & 114.1 & 109.178781695741 & 4.92121830425914 \tabularnewline
8 & 112.5 & 113.302214052097 & -0.802214052097304 \tabularnewline
9 & 112.4 & 111.418027868629 & 0.981972131371171 \tabularnewline
10 & 113.1 & 107.296474748214 & 5.80352525178587 \tabularnewline
11 & 116.3 & 112.56795335598 & 3.73204664401953 \tabularnewline
12 & 111.7 & 113.492446290671 & -1.79244629067086 \tabularnewline
13 & 118.8 & 116.112958197057 & 2.68704180294325 \tabularnewline
14 & 116.5 & 111.306827947151 & 5.19317205284925 \tabularnewline
15 & 125.1 & 123.578455580214 & 1.52154441978619 \tabularnewline
16 & 113.1 & 109.484883880713 & 3.61511611928678 \tabularnewline
17 & 119.6 & 118.040064830496 & 1.5599351695042 \tabularnewline
18 & 114.4 & 118.628772013588 & -4.22877201358828 \tabularnewline
19 & 114 & 113.132502420538 & 0.867497579461855 \tabularnewline
20 & 117.8 & 117.519516158548 & 0.280483841452253 \tabularnewline
21 & 117 & 112.823795237446 & 4.17620476255436 \tabularnewline
22 & 120.9 & 116.609683566626 & 4.29031643337448 \tabularnewline
23 & 115 & 116.170232238574 & -1.17023223857357 \tabularnewline
24 & 117.3 & 113.228864909018 & 4.07113509098228 \tabularnewline
25 & 119.4 & 122.26319043563 & -2.8631904356303 \tabularnewline
26 & 114.9 & 115.348409132499 & -0.448409132499083 \tabularnewline
27 & 125.8 & 126.477850778398 & -0.677850778398486 \tabularnewline
28 & 117.6 & 114.22934875047 & 3.37065124953003 \tabularnewline
29 & 117.6 & 117.512902067189 & 0.087097932810516 \tabularnewline
30 & 114.9 & 120.913143987916 & -6.01314398791561 \tabularnewline
31 & 121.9 & 119.370595119663 & 2.52940488033725 \tabularnewline
32 & 117 & 120.770353198937 & -3.77035319893663 \tabularnewline
33 & 106.4 & 110.803004644771 & -4.40300464477147 \tabularnewline
34 & 110.5 & 121.793450739138 & -11.2934507391375 \tabularnewline
35 & 113.6 & 116.521674080778 & -2.92167408077777 \tabularnewline
36 & 114.2 & 111.471655697997 & 2.72834430200331 \tabularnewline
37 & 125.4 & 126.39263208153 & -0.992632081529695 \tabularnewline
38 & 124.6 & 121.937943673828 & 2.66205632617209 \tabularnewline
39 & 120.2 & 118.570409328804 & 1.6295906711961 \tabularnewline
40 & 120.8 & 124.069720332188 & -3.26972033218767 \tabularnewline
41 & 111.4 & 117.337181146087 & -5.93718114608737 \tabularnewline
42 & 124.1 & 119.770958000752 & 4.32904199924804 \tabularnewline
43 & 120.2 & 122.44571123895 & -2.24571123894953 \tabularnewline
44 & 125.5 & 116.90449293469 & 8.59550706530962 \tabularnewline
45 & 116 & 114.581004448467 & 1.41899555153334 \tabularnewline
46 & 117 & 115.906799882217 & 1.09320011778288 \tabularnewline
47 & 105.7 & 104.309070064182 & 1.39092993581831 \tabularnewline
48 & 102 & 106.463609446587 & -4.46360944658679 \tabularnewline
49 & 106.4 & 109.084121352973 & -2.68412135297266 \tabularnewline
50 & 96.9 & 104.717293405822 & -7.81729340582193 \tabularnewline
51 & 107.6 & 112.683758471883 & -5.0837584718835 \tabularnewline
52 & 98.8 & 103.686093484344 & -4.88609348434386 \tabularnewline
53 & 101.1 & 102.137321470756 & -1.03732147075558 \tabularnewline
54 & 105.7 & 108.173377208013 & -2.47337720801323 \tabularnewline
55 & 104.6 & 110.672409525109 & -6.07240952510871 \tabularnewline
56 & 103.2 & 107.503423655728 & -4.30342365572793 \tabularnewline
57 & 101.6 & 103.774167800687 & -2.1741678006874 \tabularnewline
58 & 106.7 & 106.593591063806 & 0.106408936194294 \tabularnewline
59 & 99.5 & 100.531070260486 & -1.03107026048649 \tabularnewline
60 & 101 & 101.543423655728 & -0.543423655727943 \tabularnewline
\hline
\end{tabular}
%Source: https://freestatistics.org/blog/index.php?pk=111831&T=4

[TABLE]
[ROW][C]Multiple Linear Regression - Actuals, Interpolation, and Residuals[/C][/ROW]
[ROW][C]Time or Index[/C][C]Actuals[/C][C]InterpolationForecast[/C][C]ResidualsPrediction Error[/C][/ROW]
[ROW][C]1[/C][C]116.1[/C][C]112.247097932811[/C][C]3.8529020671894[/C][/ROW]
[ROW][C]2[/C][C]107.5[/C][C]107.0895258407[/C][C]0.410474159299678[/C][/ROW]
[ROW][C]3[/C][C]116.7[/C][C]114.0895258407[/C][C]2.61047415929969[/C][/ROW]
[ROW][C]4[/C][C]112.5[/C][C]111.329953552285[/C][C]1.17004644771471[/C][/ROW]
[ROW][C]5[/C][C]113[/C][C]107.672530485472[/C][C]5.32746951452823[/C][/ROW]
[ROW][C]6[/C][C]126.4[/C][C]118.013748789731[/C][C]8.38625121026907[/C][/ROW]
[ROW][C]7[/C][C]114.1[/C][C]109.178781695741[/C][C]4.92121830425914[/C][/ROW]
[ROW][C]8[/C][C]112.5[/C][C]113.302214052097[/C][C]-0.802214052097304[/C][/ROW]
[ROW][C]9[/C][C]112.4[/C][C]111.418027868629[/C][C]0.981972131371171[/C][/ROW]
[ROW][C]10[/C][C]113.1[/C][C]107.296474748214[/C][C]5.80352525178587[/C][/ROW]
[ROW][C]11[/C][C]116.3[/C][C]112.56795335598[/C][C]3.73204664401953[/C][/ROW]
[ROW][C]12[/C][C]111.7[/C][C]113.492446290671[/C][C]-1.79244629067086[/C][/ROW]
[ROW][C]13[/C][C]118.8[/C][C]116.112958197057[/C][C]2.68704180294325[/C][/ROW]
[ROW][C]14[/C][C]116.5[/C][C]111.306827947151[/C][C]5.19317205284925[/C][/ROW]
[ROW][C]15[/C][C]125.1[/C][C]123.578455580214[/C][C]1.52154441978619[/C][/ROW]
[ROW][C]16[/C][C]113.1[/C][C]109.484883880713[/C][C]3.61511611928678[/C][/ROW]
[ROW][C]17[/C][C]119.6[/C][C]118.040064830496[/C][C]1.5599351695042[/C][/ROW]
[ROW][C]18[/C][C]114.4[/C][C]118.628772013588[/C][C]-4.22877201358828[/C][/ROW]
[ROW][C]19[/C][C]114[/C][C]113.132502420538[/C][C]0.867497579461855[/C][/ROW]
[ROW][C]20[/C][C]117.8[/C][C]117.519516158548[/C][C]0.280483841452253[/C][/ROW]
[ROW][C]21[/C][C]117[/C][C]112.823795237446[/C][C]4.17620476255436[/C][/ROW]
[ROW][C]22[/C][C]120.9[/C][C]116.609683566626[/C][C]4.29031643337448[/C][/ROW]
[ROW][C]23[/C][C]115[/C][C]116.170232238574[/C][C]-1.17023223857357[/C][/ROW]
[ROW][C]24[/C][C]117.3[/C][C]113.228864909018[/C][C]4.07113509098228[/C][/ROW]
[ROW][C]25[/C][C]119.4[/C][C]122.26319043563[/C][C]-2.8631904356303[/C][/ROW]
[ROW][C]26[/C][C]114.9[/C][C]115.348409132499[/C][C]-0.448409132499083[/C][/ROW]
[ROW][C]27[/C][C]125.8[/C][C]126.477850778398[/C][C]-0.677850778398486[/C][/ROW]
[ROW][C]28[/C][C]117.6[/C][C]114.22934875047[/C][C]3.37065124953003[/C][/ROW]
[ROW][C]29[/C][C]117.6[/C][C]117.512902067189[/C][C]0.087097932810516[/C][/ROW]
[ROW][C]30[/C][C]114.9[/C][C]120.913143987916[/C][C]-6.01314398791561[/C][/ROW]
[ROW][C]31[/C][C]121.9[/C][C]119.370595119663[/C][C]2.52940488033725[/C][/ROW]
[ROW][C]32[/C][C]117[/C][C]120.770353198937[/C][C]-3.77035319893663[/C][/ROW]
[ROW][C]33[/C][C]106.4[/C][C]110.803004644771[/C][C]-4.40300464477147[/C][/ROW]
[ROW][C]34[/C][C]110.5[/C][C]121.793450739138[/C][C]-11.2934507391375[/C][/ROW]
[ROW][C]35[/C][C]113.6[/C][C]116.521674080778[/C][C]-2.92167408077777[/C][/ROW]
[ROW][C]36[/C][C]114.2[/C][C]111.471655697997[/C][C]2.72834430200331[/C][/ROW]
[ROW][C]37[/C][C]125.4[/C][C]126.39263208153[/C][C]-0.992632081529695[/C][/ROW]
[ROW][C]38[/C][C]124.6[/C][C]121.937943673828[/C][C]2.66205632617209[/C][/ROW]
[ROW][C]39[/C][C]120.2[/C][C]118.570409328804[/C][C]1.6295906711961[/C][/ROW]
[ROW][C]40[/C][C]120.8[/C][C]124.069720332188[/C][C]-3.26972033218767[/C][/ROW]
[ROW][C]41[/C][C]111.4[/C][C]117.337181146087[/C][C]-5.93718114608737[/C][/ROW]
[ROW][C]42[/C][C]124.1[/C][C]119.770958000752[/C][C]4.32904199924804[/C][/ROW]
[ROW][C]43[/C][C]120.2[/C][C]122.44571123895[/C][C]-2.24571123894953[/C][/ROW]
[ROW][C]44[/C][C]125.5[/C][C]116.90449293469[/C][C]8.59550706530962[/C][/ROW]
[ROW][C]45[/C][C]116[/C][C]114.581004448467[/C][C]1.41899555153334[/C][/ROW]
[ROW][C]46[/C][C]117[/C][C]115.906799882217[/C][C]1.09320011778288[/C][/ROW]
[ROW][C]47[/C][C]105.7[/C][C]104.309070064182[/C][C]1.39092993581831[/C][/ROW]
[ROW][C]48[/C][C]102[/C][C]106.463609446587[/C][C]-4.46360944658679[/C][/ROW]
[ROW][C]49[/C][C]106.4[/C][C]109.084121352973[/C][C]-2.68412135297266[/C][/ROW]
[ROW][C]50[/C][C]96.9[/C][C]104.717293405822[/C][C]-7.81729340582193[/C][/ROW]
[ROW][C]51[/C][C]107.6[/C][C]112.683758471883[/C][C]-5.0837584718835[/C][/ROW]
[ROW][C]52[/C][C]98.8[/C][C]103.686093484344[/C][C]-4.88609348434386[/C][/ROW]
[ROW][C]53[/C][C]101.1[/C][C]102.137321470756[/C][C]-1.03732147075558[/C][/ROW]
[ROW][C]54[/C][C]105.7[/C][C]108.173377208013[/C][C]-2.47337720801323[/C][/ROW]
[ROW][C]55[/C][C]104.6[/C][C]110.672409525109[/C][C]-6.07240952510871[/C][/ROW]
[ROW][C]56[/C][C]103.2[/C][C]107.503423655728[/C][C]-4.30342365572793[/C][/ROW]
[ROW][C]57[/C][C]101.6[/C][C]103.774167800687[/C][C]-2.1741678006874[/C][/ROW]
[ROW][C]58[/C][C]106.7[/C][C]106.593591063806[/C][C]0.106408936194294[/C][/ROW]
[ROW][C]59[/C][C]99.5[/C][C]100.531070260486[/C][C]-1.03107026048649[/C][/ROW]
[ROW][C]60[/C][C]101[/C][C]101.543423655728[/C][C]-0.543423655727943[/C][/ROW]
[/TABLE]
Source: https://freestatistics.org/blog/index.php?pk=111831&T=4

Globally Unique Identifier (entire table): ba.freestatistics.org/blog/index.php?pk=111831&T=4

As an alternative you can also use a QR Code:  

The GUIDs for individual cells are displayed in the table below:

Multiple Linear Regression - Actuals, Interpolation, and Residuals
Time or IndexActualsInterpolationForecastResidualsPrediction Error
1116.1112.2470979328113.8529020671894
2107.5107.08952584070.410474159299678
3116.7114.08952584072.61047415929969
4112.5111.3299535522851.17004644771471
5113107.6725304854725.32746951452823
6126.4118.0137487897318.38625121026907
7114.1109.1787816957414.92121830425914
8112.5113.302214052097-0.802214052097304
9112.4111.4180278686290.981972131371171
10113.1107.2964747482145.80352525178587
11116.3112.567953355983.73204664401953
12111.7113.492446290671-1.79244629067086
13118.8116.1129581970572.68704180294325
14116.5111.3068279471515.19317205284925
15125.1123.5784555802141.52154441978619
16113.1109.4848838807133.61511611928678
17119.6118.0400648304961.5599351695042
18114.4118.628772013588-4.22877201358828
19114113.1325024205380.867497579461855
20117.8117.5195161585480.280483841452253
21117112.8237952374464.17620476255436
22120.9116.6096835666264.29031643337448
23115116.170232238574-1.17023223857357
24117.3113.2288649090184.07113509098228
25119.4122.26319043563-2.8631904356303
26114.9115.348409132499-0.448409132499083
27125.8126.477850778398-0.677850778398486
28117.6114.229348750473.37065124953003
29117.6117.5129020671890.087097932810516
30114.9120.913143987916-6.01314398791561
31121.9119.3705951196632.52940488033725
32117120.770353198937-3.77035319893663
33106.4110.803004644771-4.40300464477147
34110.5121.793450739138-11.2934507391375
35113.6116.521674080778-2.92167408077777
36114.2111.4716556979972.72834430200331
37125.4126.39263208153-0.992632081529695
38124.6121.9379436738282.66205632617209
39120.2118.5704093288041.6295906711961
40120.8124.069720332188-3.26972033218767
41111.4117.337181146087-5.93718114608737
42124.1119.7709580007524.32904199924804
43120.2122.44571123895-2.24571123894953
44125.5116.904492934698.59550706530962
45116114.5810044484671.41899555153334
46117115.9067998822171.09320011778288
47105.7104.3090700641821.39092993581831
48102106.463609446587-4.46360944658679
49106.4109.084121352973-2.68412135297266
5096.9104.717293405822-7.81729340582193
51107.6112.683758471883-5.0837584718835
5298.8103.686093484344-4.88609348434386
53101.1102.137321470756-1.03732147075558
54105.7108.173377208013-2.47337720801323
55104.6110.672409525109-6.07240952510871
56103.2107.503423655728-4.30342365572793
57101.6103.774167800687-2.1741678006874
58106.7106.5935910638060.106408936194294
5999.5100.531070260486-1.03107026048649
60101101.543423655728-0.543423655727943


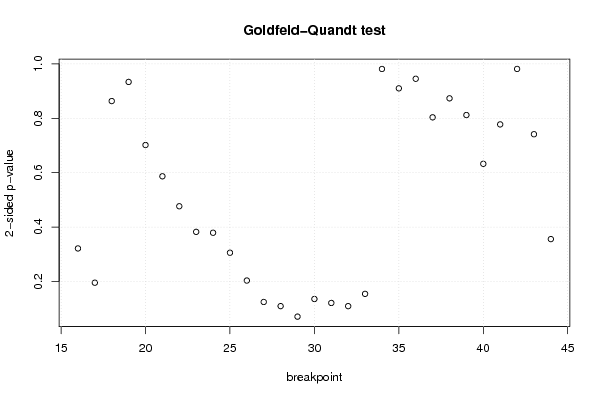
Goldfeld-Quandt test for Heteroskedasticity
p-valuesAlternative Hypothesis
breakpoint indexgreater2-sidedless
160.1607488388259280.3214976776518560.839251161174072
170.09773836324967680.1954767264993540.902261636750323
180.5684131782904790.8631736434190420.431586821709521
190.4667873122819430.9335746245638870.533212687718057
200.3507894080034710.7015788160069420.649210591996529
210.2933411172593450.5866822345186890.706658882740655
220.2382872885034470.4765745770068940.761712711496553
230.1912115934276640.3824231868553290.808788406572336
240.1895716823528870.3791433647057740.810428317647113
250.152855586765550.3057111735310990.84714441323445
260.1017694869971310.2035389739942620.898230513002869
270.0623725974013670.1247451948027340.937627402598633
280.05471231033380280.1094246206676060.945287689666197
290.03538156791604480.07076313583208950.964618432083955
300.06786518703471390.1357303740694280.932134812965286
310.06053697944852440.1210739588970490.939463020551476
320.05467455441525720.1093491088305140.945325445584743
330.07724949096931070.1544989819386210.92275050903069
340.5094429891823520.9811140216352970.490557010817648
350.5450575267224860.9098849465550280.454942473277514
360.4725768620240490.9451537240480980.527423137975951
370.4017022659057480.8034045318114960.598297734094252
380.4366381156476440.8732762312952870.563361884352356
390.4058755744287010.8117511488574020.594124425571299
400.3162658531555340.6325317063110690.683734146844466
410.6112871351895910.7774257296208180.388712864810409
420.5093813118572860.9812373762854290.490618688142714
430.3706656073847180.7413312147694370.629334392615282
440.8220681126978680.3558637746042640.177931887302132

\begin{tabular}{lllllllll}
\hline
Goldfeld-Quandt test for Heteroskedasticity \tabularnewline
p-values & Alternative Hypothesis \tabularnewline
breakpoint index & greater & 2-sided & less \tabularnewline
16 & 0.160748838825928 & 0.321497677651856 & 0.839251161174072 \tabularnewline
17 & 0.0977383632496768 & 0.195476726499354 & 0.902261636750323 \tabularnewline
18 & 0.568413178290479 & 0.863173643419042 & 0.431586821709521 \tabularnewline
19 & 0.466787312281943 & 0.933574624563887 & 0.533212687718057 \tabularnewline
20 & 0.350789408003471 & 0.701578816006942 & 0.649210591996529 \tabularnewline
21 & 0.293341117259345 & 0.586682234518689 & 0.706658882740655 \tabularnewline
22 & 0.238287288503447 & 0.476574577006894 & 0.761712711496553 \tabularnewline
23 & 0.191211593427664 & 0.382423186855329 & 0.808788406572336 \tabularnewline
24 & 0.189571682352887 & 0.379143364705774 & 0.810428317647113 \tabularnewline
25 & 0.15285558676555 & 0.305711173531099 & 0.84714441323445 \tabularnewline
26 & 0.101769486997131 & 0.203538973994262 & 0.898230513002869 \tabularnewline
27 & 0.062372597401367 & 0.124745194802734 & 0.937627402598633 \tabularnewline
28 & 0.0547123103338028 & 0.109424620667606 & 0.945287689666197 \tabularnewline
29 & 0.0353815679160448 & 0.0707631358320895 & 0.964618432083955 \tabularnewline
30 & 0.0678651870347139 & 0.135730374069428 & 0.932134812965286 \tabularnewline
31 & 0.0605369794485244 & 0.121073958897049 & 0.939463020551476 \tabularnewline
32 & 0.0546745544152572 & 0.109349108830514 & 0.945325445584743 \tabularnewline
33 & 0.0772494909693107 & 0.154498981938621 & 0.92275050903069 \tabularnewline
34 & 0.509442989182352 & 0.981114021635297 & 0.490557010817648 \tabularnewline
35 & 0.545057526722486 & 0.909884946555028 & 0.454942473277514 \tabularnewline
36 & 0.472576862024049 & 0.945153724048098 & 0.527423137975951 \tabularnewline
37 & 0.401702265905748 & 0.803404531811496 & 0.598297734094252 \tabularnewline
38 & 0.436638115647644 & 0.873276231295287 & 0.563361884352356 \tabularnewline
39 & 0.405875574428701 & 0.811751148857402 & 0.594124425571299 \tabularnewline
40 & 0.316265853155534 & 0.632531706311069 & 0.683734146844466 \tabularnewline
41 & 0.611287135189591 & 0.777425729620818 & 0.388712864810409 \tabularnewline
42 & 0.509381311857286 & 0.981237376285429 & 0.490618688142714 \tabularnewline
43 & 0.370665607384718 & 0.741331214769437 & 0.629334392615282 \tabularnewline
44 & 0.822068112697868 & 0.355863774604264 & 0.177931887302132 \tabularnewline
\hline
\end{tabular}
%Source: https://freestatistics.org/blog/index.php?pk=111831&T=5

[TABLE]
[ROW][C]Goldfeld-Quandt test for Heteroskedasticity[/C][/ROW]
[ROW][C]p-values[/C][C]Alternative Hypothesis[/C][/ROW]
[ROW][C]breakpoint index[/C][C]greater[/C][C]2-sided[/C][C]less[/C][/ROW]
[ROW][C]16[/C][C]0.160748838825928[/C][C]0.321497677651856[/C][C]0.839251161174072[/C][/ROW]
[ROW][C]17[/C][C]0.0977383632496768[/C][C]0.195476726499354[/C][C]0.902261636750323[/C][/ROW]
[ROW][C]18[/C][C]0.568413178290479[/C][C]0.863173643419042[/C][C]0.431586821709521[/C][/ROW]
[ROW][C]19[/C][C]0.466787312281943[/C][C]0.933574624563887[/C][C]0.533212687718057[/C][/ROW]
[ROW][C]20[/C][C]0.350789408003471[/C][C]0.701578816006942[/C][C]0.649210591996529[/C][/ROW]
[ROW][C]21[/C][C]0.293341117259345[/C][C]0.586682234518689[/C][C]0.706658882740655[/C][/ROW]
[ROW][C]22[/C][C]0.238287288503447[/C][C]0.476574577006894[/C][C]0.761712711496553[/C][/ROW]
[ROW][C]23[/C][C]0.191211593427664[/C][C]0.382423186855329[/C][C]0.808788406572336[/C][/ROW]
[ROW][C]24[/C][C]0.189571682352887[/C][C]0.379143364705774[/C][C]0.810428317647113[/C][/ROW]
[ROW][C]25[/C][C]0.15285558676555[/C][C]0.305711173531099[/C][C]0.84714441323445[/C][/ROW]
[ROW][C]26[/C][C]0.101769486997131[/C][C]0.203538973994262[/C][C]0.898230513002869[/C][/ROW]
[ROW][C]27[/C][C]0.062372597401367[/C][C]0.124745194802734[/C][C]0.937627402598633[/C][/ROW]
[ROW][C]28[/C][C]0.0547123103338028[/C][C]0.109424620667606[/C][C]0.945287689666197[/C][/ROW]
[ROW][C]29[/C][C]0.0353815679160448[/C][C]0.0707631358320895[/C][C]0.964618432083955[/C][/ROW]
[ROW][C]30[/C][C]0.0678651870347139[/C][C]0.135730374069428[/C][C]0.932134812965286[/C][/ROW]
[ROW][C]31[/C][C]0.0605369794485244[/C][C]0.121073958897049[/C][C]0.939463020551476[/C][/ROW]
[ROW][C]32[/C][C]0.0546745544152572[/C][C]0.109349108830514[/C][C]0.945325445584743[/C][/ROW]
[ROW][C]33[/C][C]0.0772494909693107[/C][C]0.154498981938621[/C][C]0.92275050903069[/C][/ROW]
[ROW][C]34[/C][C]0.509442989182352[/C][C]0.981114021635297[/C][C]0.490557010817648[/C][/ROW]
[ROW][C]35[/C][C]0.545057526722486[/C][C]0.909884946555028[/C][C]0.454942473277514[/C][/ROW]
[ROW][C]36[/C][C]0.472576862024049[/C][C]0.945153724048098[/C][C]0.527423137975951[/C][/ROW]
[ROW][C]37[/C][C]0.401702265905748[/C][C]0.803404531811496[/C][C]0.598297734094252[/C][/ROW]
[ROW][C]38[/C][C]0.436638115647644[/C][C]0.873276231295287[/C][C]0.563361884352356[/C][/ROW]
[ROW][C]39[/C][C]0.405875574428701[/C][C]0.811751148857402[/C][C]0.594124425571299[/C][/ROW]
[ROW][C]40[/C][C]0.316265853155534[/C][C]0.632531706311069[/C][C]0.683734146844466[/C][/ROW]
[ROW][C]41[/C][C]0.611287135189591[/C][C]0.777425729620818[/C][C]0.388712864810409[/C][/ROW]
[ROW][C]42[/C][C]0.509381311857286[/C][C]0.981237376285429[/C][C]0.490618688142714[/C][/ROW]
[ROW][C]43[/C][C]0.370665607384718[/C][C]0.741331214769437[/C][C]0.629334392615282[/C][/ROW]
[ROW][C]44[/C][C]0.822068112697868[/C][C]0.355863774604264[/C][C]0.177931887302132[/C][/ROW]
[/TABLE]
Source: https://freestatistics.org/blog/index.php?pk=111831&T=5

Globally Unique Identifier (entire table): ba.freestatistics.org/blog/index.php?pk=111831&T=5

As an alternative you can also use a QR Code:  

The GUIDs for individual cells are displayed in the table below:

Goldfeld-Quandt test for Heteroskedasticity
p-valuesAlternative Hypothesis
breakpoint indexgreater2-sidedless
160.1607488388259280.3214976776518560.839251161174072
170.09773836324967680.1954767264993540.902261636750323
180.5684131782904790.8631736434190420.431586821709521
190.4667873122819430.9335746245638870.533212687718057
200.3507894080034710.7015788160069420.649210591996529
210.2933411172593450.5866822345186890.706658882740655
220.2382872885034470.4765745770068940.761712711496553
230.1912115934276640.3824231868553290.808788406572336
240.1895716823528870.3791433647057740.810428317647113
250.152855586765550.3057111735310990.84714441323445
260.1017694869971310.2035389739942620.898230513002869
270.0623725974013670.1247451948027340.937627402598633
280.05471231033380280.1094246206676060.945287689666197
290.03538156791604480.07076313583208950.964618432083955
300.06786518703471390.1357303740694280.932134812965286
310.06053697944852440.1210739588970490.939463020551476
320.05467455441525720.1093491088305140.945325445584743
330.07724949096931070.1544989819386210.92275050903069
340.5094429891823520.9811140216352970.490557010817648
350.5450575267224860.9098849465550280.454942473277514
360.4725768620240490.9451537240480980.527423137975951
370.4017022659057480.8034045318114960.598297734094252
380.4366381156476440.8732762312952870.563361884352356
390.4058755744287010.8117511488574020.594124425571299
400.3162658531555340.6325317063110690.683734146844466
410.6112871351895910.7774257296208180.388712864810409
420.5093813118572860.9812373762854290.490618688142714
430.3706656073847180.7413312147694370.629334392615282
440.8220681126978680.3558637746042640.177931887302132


Meta Analysis of Goldfeld-Quandt test for Heteroskedasticity
Description# significant tests% significant testsOK/NOK
1% type I error level00OK
5% type I error level00OK
10% type I error level10.0344827586206897OK

\begin{tabular}{lllllllll}
\hline
Meta Analysis of Goldfeld-Quandt test for Heteroskedasticity \tabularnewline
Description & # significant tests & % significant tests & OK/NOK \tabularnewline
1% type I error level & 0 & 0 & OK \tabularnewline
5% type I error level & 0 & 0 & OK \tabularnewline
10% type I error level & 1 & 0.0344827586206897 & OK \tabularnewline
\hline
\end{tabular}
%Source: https://freestatistics.org/blog/index.php?pk=111831&T=6

[TABLE]
[ROW][C]Meta Analysis of Goldfeld-Quandt test for Heteroskedasticity[/C][/ROW]
[ROW][C]Description[/C][C]# significant tests[/C][C]% significant tests[/C][C]OK/NOK[/C][/ROW]
[ROW][C]1% type I error level[/C][C]0[/C][C]0[/C][C]OK[/C][/ROW]
[ROW][C]5% type I error level[/C][C]0[/C][C]0[/C][C]OK[/C][/ROW]
[ROW][C]10% type I error level[/C][C]1[/C][C]0.0344827586206897[/C][C]OK[/C][/ROW]
[/TABLE]
Source: https://freestatistics.org/blog/index.php?pk=111831&T=6

Globally Unique Identifier (entire table): ba.freestatistics.org/blog/index.php?pk=111831&T=6

As an alternative you can also use a QR Code:  

The GUIDs for individual cells are displayed in the table below:

Meta Analysis of Goldfeld-Quandt test for Heteroskedasticity
Description# significant tests% significant testsOK/NOK
1% type I error level00OK
5% type I error level00OK
10% type I error level10.0344827586206897OK


Parameters (Session):
par1 = 2 ; par2 = Include Monthly Dummies ; par3 = No Linear Trend ;
Parameters (R input):
par1 = 2 ; par2 = Include Monthly Dummies ; par3 = No Linear Trend ;
R code (references can be found in the software module):
library(lattice)
library(lmtest)
n25 <- 25 #minimum number of obs. for Goldfeld-Quandt test
par1 <- as.numeric(par1)
x <- t(y)
k <- length(x[1,])
n <- length(x[,1])
x1 <- cbind(x[,par1], x[,1:k!=par1])
mycolnames <- c(colnames(x)[par1], colnames(x)[1:k!=par1])
colnames(x1) <- mycolnames #colnames(x)[par1]
x <- x1
if (par3 == 'First Differences'){
x2 <- array(0, dim=c(n-1,k), dimnames=list(1:(n-1), paste('(1-B)',colnames(x),sep='')))
for (i in 1:n-1) {
for (j in 1:k) {
x2[i,j] <- x[i+1,j] - x[i,j]
}
}
x <- x2
}
if (par2 == 'Include Monthly Dummies'){
x2 <- array(0, dim=c(n,11), dimnames=list(1:n, paste('M', seq(1:11), sep ='')))
for (i in 1:11){
x2[seq(i,n,12),i] <- 1
}
x <- cbind(x, x2)
}
if (par2 == 'Include Quarterly Dummies'){
x2 <- array(0, dim=c(n,3), dimnames=list(1:n, paste('Q', seq(1:3), sep ='')))
for (i in 1:3){
x2[seq(i,n,4),i] <- 1
}
x <- cbind(x, x2)
}
k <- length(x[1,])
if (par3 == 'Linear Trend'){
x <- cbind(x, c(1:n))
colnames(x)[k+1] <- 't'
}
x
k <- length(x[1,])
df <- as.data.frame(x)
(mylm <- lm(df))
(mysum <- summary(mylm))
if (n > n25) {
kp3 <- k + 3
nmkm3 <- n - k - 3
gqarr <- array(NA, dim=c(nmkm3-kp3+1,3))
numgqtests <- 0
numsignificant1 <- 0
numsignificant5 <- 0
numsignificant10 <- 0
for (mypoint in kp3:nmkm3) {
j <- 0
numgqtests <- numgqtests + 1
for (myalt in c('greater', 'two.sided', 'less')) {
j <- j + 1
gqarr[mypoint-kp3+1,j] <- gqtest(mylm, point=mypoint, alternative=myalt)$p.value
}
if (gqarr[mypoint-kp3+1,2] < 0.01) numsignificant1 <- numsignificant1 + 1
if (gqarr[mypoint-kp3+1,2] < 0.05) numsignificant5 <- numsignificant5 + 1
if (gqarr[mypoint-kp3+1,2] < 0.10) numsignificant10 <- numsignificant10 + 1
}
gqarr
}
bitmap(file='test0.png')
plot(x[,1], type='l', main='Actuals and Interpolation', ylab='value of Actuals and Interpolation (dots)', xlab='time or index')
points(x[,1]-mysum$resid)
grid()
dev.off()
bitmap(file='test1.png')
plot(mysum$resid, type='b', pch=19, main='Residuals', ylab='value of Residuals', xlab='time or index')
grid()
dev.off()
bitmap(file='test2.png')
hist(mysum$resid, main='Residual Histogram', xlab='values of Residuals')
grid()
dev.off()
bitmap(file='test3.png')
densityplot(~mysum$resid,col='black',main='Residual Density Plot', xlab='values of Residuals')
dev.off()
bitmap(file='test4.png')
qqnorm(mysum$resid, main='Residual Normal Q-Q Plot')
qqline(mysum$resid)
grid()
dev.off()
(myerror <- as.ts(mysum$resid))
bitmap(file='test5.png')
dum <- cbind(lag(myerror,k=1),myerror)
dum
dum1 <- dum[2:length(myerror),]
dum1
z <- as.data.frame(dum1)
z
plot(z,main=paste('Residual Lag plot, lowess, and regression line'), ylab='values of Residuals', xlab='lagged values of Residuals')
lines(lowess(z))
abline(lm(z))
grid()
dev.off()
bitmap(file='test6.png')
acf(mysum$resid, lag.max=length(mysum$resid)/2, main='Residual Autocorrelation Function')
grid()
dev.off()
bitmap(file='test7.png')
pacf(mysum$resid, lag.max=length(mysum$resid)/2, main='Residual Partial Autocorrelation Function')
grid()
dev.off()
bitmap(file='test8.png')
opar <- par(mfrow = c(2,2), oma = c(0, 0, 1.1, 0))
plot(mylm, las = 1, sub='Residual Diagnostics')
par(opar)
dev.off()
if (n > n25) {
bitmap(file='test9.png')
plot(kp3:nmkm3,gqarr[,2], main='Goldfeld-Quandt test',ylab='2-sided p-value',xlab='breakpoint')
grid()
dev.off()
}
load(file='createtable')
a<-table.start()
a<-table.row.start(a)
a<-table.element(a, 'Multiple Linear Regression - Estimated Regression Equation', 1, TRUE)
a<-table.row.end(a)
myeq <- colnames(x)[1]
myeq <- paste(myeq, '[t] = ', sep='')
for (i in 1:k){
if (mysum$coefficients[i,1] > 0) myeq <- paste(myeq, '+', '')
myeq <- paste(myeq, mysum$coefficients[i,1], sep=' ')
if (rownames(mysum$coefficients)[i] != '(Intercept)') {
myeq <- paste(myeq, rownames(mysum$coefficients)[i], sep='')
if (rownames(mysum$coefficients)[i] != 't') myeq <- paste(myeq, '[t]', sep='')
}
}
myeq <- paste(myeq, ' + e[t]')
a<-table.row.start(a)
a<-table.element(a, myeq)
a<-table.row.end(a)
a<-table.end(a)
table.save(a,file='mytable1.tab')
a<-table.start()
a<-table.row.start(a)
a<-table.element(a,hyperlink('ols1.htm','Multiple Linear Regression - Ordinary Least Squares',''), 6, TRUE)
a<-table.row.end(a)
a<-table.row.start(a)
a<-table.element(a,'Variable',header=TRUE)
a<-table.element(a,'Parameter',header=TRUE)
a<-table.element(a,'S.D.',header=TRUE)
a<-table.element(a,'T-STAT
H0: parameter = 0',header=TRUE)
a<-table.element(a,'2-tail p-value',header=TRUE)
a<-table.element(a,'1-tail p-value',header=TRUE)
a<-table.row.end(a)
for (i in 1:k){
a<-table.row.start(a)
a<-table.element(a,rownames(mysum$coefficients)[i],header=TRUE)
a<-table.element(a,mysum$coefficients[i,1])
a<-table.element(a, round(mysum$coefficients[i,2],6))
a<-table.element(a, round(mysum$coefficients[i,3],4))
a<-table.element(a, round(mysum$coefficients[i,4],6))
a<-table.element(a, round(mysum$coefficients[i,4]/2,6))
a<-table.row.end(a)
}
a<-table.end(a)
table.save(a,file='mytable2.tab')
a<-table.start()
a<-table.row.start(a)
a<-table.element(a, 'Multiple Linear Regression - Regression Statistics', 2, TRUE)
a<-table.row.end(a)
a<-table.row.start(a)
a<-table.element(a, 'Multiple R',1,TRUE)
a<-table.element(a, sqrt(mysum$r.squared))
a<-table.row.end(a)
a<-table.row.start(a)
a<-table.element(a, 'R-squared',1,TRUE)
a<-table.element(a, mysum$r.squared)
a<-table.row.end(a)
a<-table.row.start(a)
a<-table.element(a, 'Adjusted R-squared',1,TRUE)
a<-table.element(a, mysum$adj.r.squared)
a<-table.row.end(a)
a<-table.row.start(a)
a<-table.element(a, 'F-TEST (value)',1,TRUE)
a<-table.element(a, mysum$fstatistic[1])
a<-table.row.end(a)
a<-table.row.start(a)
a<-table.element(a, 'F-TEST (DF numerator)',1,TRUE)
a<-table.element(a, mysum$fstatistic[2])
a<-table.row.end(a)
a<-table.row.start(a)
a<-table.element(a, 'F-TEST (DF denominator)',1,TRUE)
a<-table.element(a, mysum$fstatistic[3])
a<-table.row.end(a)
a<-table.row.start(a)
a<-table.element(a, 'p-value',1,TRUE)
a<-table.element(a, 1-pf(mysum$fstatistic[1],mysum$fstatistic[2],mysum$fstatistic[3]))
a<-table.row.end(a)
a<-table.row.start(a)
a<-table.element(a, 'Multiple Linear Regression - Residual Statistics', 2, TRUE)
a<-table.row.end(a)
a<-table.row.start(a)
a<-table.element(a, 'Residual Standard Deviation',1,TRUE)
a<-table.element(a, mysum$sigma)
a<-table.row.end(a)
a<-table.row.start(a)
a<-table.element(a, 'Sum Squared Residuals',1,TRUE)
a<-table.element(a, sum(myerror*myerror))
a<-table.row.end(a)
a<-table.end(a)
table.save(a,file='mytable3.tab')
a<-table.start()
a<-table.row.start(a)
a<-table.element(a, 'Multiple Linear Regression - Actuals, Interpolation, and Residuals', 4, TRUE)
a<-table.row.end(a)
a<-table.row.start(a)
a<-table.element(a, 'Time or Index', 1, TRUE)
a<-table.element(a, 'Actuals', 1, TRUE)
a<-table.element(a, 'Interpolation
Forecast', 1, TRUE)
a<-table.element(a, 'Residuals
Prediction Error', 1, TRUE)
a<-table.row.end(a)
for (i in 1:n) {
a<-table.row.start(a)
a<-table.element(a,i, 1, TRUE)
a<-table.element(a,x[i])
a<-table.element(a,x[i]-mysum$resid[i])
a<-table.element(a,mysum$resid[i])
a<-table.row.end(a)
}
a<-table.end(a)
table.save(a,file='mytable4.tab')
if (n > n25) {
a<-table.start()
a<-table.row.start(a)
a<-table.element(a,'Goldfeld-Quandt test for Heteroskedasticity',4,TRUE)
a<-table.row.end(a)
a<-table.row.start(a)
a<-table.element(a,'p-values',header=TRUE)
a<-table.element(a,'Alternative Hypothesis',3,header=TRUE)
a<-table.row.end(a)
a<-table.row.start(a)
a<-table.element(a,'breakpoint index',header=TRUE)
a<-table.element(a,'greater',header=TRUE)
a<-table.element(a,'2-sided',header=TRUE)
a<-table.element(a,'less',header=TRUE)
a<-table.row.end(a)
for (mypoint in kp3:nmkm3) {
a<-table.row.start(a)
a<-table.element(a,mypoint,header=TRUE)
a<-table.element(a,gqarr[mypoint-kp3+1,1])
a<-table.element(a,gqarr[mypoint-kp3+1,2])
a<-table.element(a,gqarr[mypoint-kp3+1,3])
a<-table.row.end(a)
}
a<-table.end(a)
table.save(a,file='mytable5.tab')
a<-table.start()
a<-table.row.start(a)
a<-table.element(a,'Meta Analysis of Goldfeld-Quandt test for Heteroskedasticity',4,TRUE)
a<-table.row.end(a)
a<-table.row.start(a)
a<-table.element(a,'Description',header=TRUE)
a<-table.element(a,'# significant tests',header=TRUE)
a<-table.element(a,'% significant tests',header=TRUE)
a<-table.element(a,'OK/NOK',header=TRUE)
a<-table.row.end(a)
a<-table.row.start(a)
a<-table.element(a,'1% type I error level',header=TRUE)
a<-table.element(a,numsignificant1)
a<-table.element(a,numsignificant1/numgqtests)
if (numsignificant1/numgqtests < 0.01) dum <- 'OK' else dum <- 'NOK'
a<-table.element(a,dum)
a<-table.row.end(a)
a<-table.row.start(a)
a<-table.element(a,'5% type I error level',header=TRUE)
a<-table.element(a,numsignificant5)
a<-table.element(a,numsignificant5/numgqtests)
if (numsignificant5/numgqtests < 0.05) dum <- 'OK' else dum <- 'NOK'
a<-table.element(a,dum)
a<-table.row.end(a)
a<-table.row.start(a)
a<-table.element(a,'10% type I error level',header=TRUE)
a<-table.element(a,numsignificant10)
a<-table.element(a,numsignificant10/numgqtests)
if (numsignificant10/numgqtests < 0.1) dum <- 'OK' else dum <- 'NOK'
a<-table.element(a,dum)
a<-table.row.end(a)
a<-table.end(a)
table.save(a,file='mytable6.tab')
}