Free Statistics
of Irreproducible Research!
Description of Statistical Computation | |||||||||||||||||||||||||||||||||||||||||
|---|---|---|---|---|---|---|---|---|---|---|---|---|---|---|---|---|---|---|---|---|---|---|---|---|---|---|---|---|---|---|---|---|---|---|---|---|---|---|---|---|---|
| Author's title | |||||||||||||||||||||||||||||||||||||||||
| Author | *The author of this computation has been verified* | ||||||||||||||||||||||||||||||||||||||||
| R Software Module | rwasp_univariatedataseries.wasp | ||||||||||||||||||||||||||||||||||||||||
| Title produced by software | Univariate Data Series | ||||||||||||||||||||||||||||||||||||||||
| Date of computation | Sat, 18 Dec 2010 10:26:42 +0000 | ||||||||||||||||||||||||||||||||||||||||
| Cite this page as follows | Statistical Computations at FreeStatistics.org, Office for Research Development and Education, URL https://freestatistics.org/blog/index.php?v=date/2010/Dec/18/t1292667870rpvxb6a5ckdir8k.htm/, Retrieved Tue, 30 Apr 2024 02:27:42 +0000 | ||||||||||||||||||||||||||||||||||||||||
| Statistical Computations at FreeStatistics.org, Office for Research Development and Education, URL https://freestatistics.org/blog/index.php?pk=111825, Retrieved Tue, 30 Apr 2024 02:27:42 +0000 | |||||||||||||||||||||||||||||||||||||||||
| QR Codes: | |||||||||||||||||||||||||||||||||||||||||
|
| |||||||||||||||||||||||||||||||||||||||||
| Original text written by user: | |||||||||||||||||||||||||||||||||||||||||
| IsPrivate? | No (this computation is public) | ||||||||||||||||||||||||||||||||||||||||
| User-defined keywords | |||||||||||||||||||||||||||||||||||||||||
| Estimated Impact | 159 | ||||||||||||||||||||||||||||||||||||||||
Tree of Dependent Computations | |||||||||||||||||||||||||||||||||||||||||
| Family? (F = Feedback message, R = changed R code, M = changed R Module, P = changed Parameters, D = changed Data) | |||||||||||||||||||||||||||||||||||||||||
| - [Univariate Data Series] [Organisation] [2010-12-18 10:26:42] [303f3b5c313268114bcf87589378f503] [Current] - PD [Univariate Data Series] [] [2010-12-18 10:45:29] [f72e5115d7374b3b3f29ba3966e5379d] - PD [Univariate Data Series] [] [2010-12-19 16:57:58] [f72e5115d7374b3b3f29ba3966e5379d] - PD [Univariate Data Series] [] [2010-12-19 16:59:23] [f72e5115d7374b3b3f29ba3966e5379d] - RMP [Univariate Explorative Data Analysis] [] [2010-12-18 10:56:19] [f72e5115d7374b3b3f29ba3966e5379d] | |||||||||||||||||||||||||||||||||||||||||
| Feedback Forum | |||||||||||||||||||||||||||||||||||||||||
Post a new message | |||||||||||||||||||||||||||||||||||||||||
Dataset | |||||||||||||||||||||||||||||||||||||||||
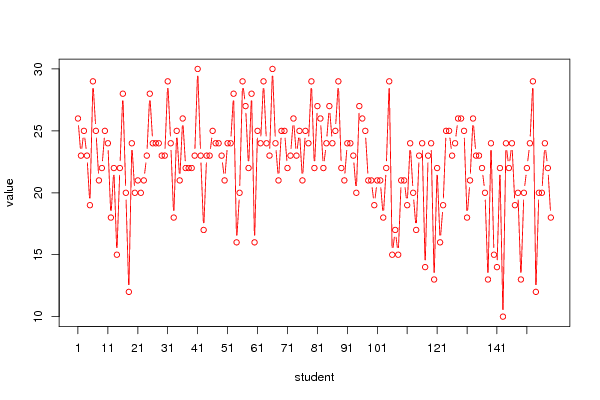
| Dataseries X: | |||||||||||||||||||||||||||||||||||||||||
26 23 25 23 19 29 25 21 22 25 24 18 22 15 22 28 20 12 24 20 21 20 21 23 28 24 24 24 23 23 29 24 18 25 21 26 22 22 22 23 30 23 17 23 23 25 24 24 23 21 24 24 28 16 20 29 27 22 28 16 25 24 29 24 23 30 24 21 25 25 22 23 26 23 25 21 25 24 29 22 27 26 22 24 27 24 25 29 22 21 24 24 23 20 27 26 25 21 21 19 21 21 18 22 29 15 17 15 21 21 19 24 20 17 23 24 14 23 24 13 22 16 19 25 25 23 24 26 26 25 18 21 26 23 23 22 20 13 24 15 14 22 10 24 22 24 19 20 13 20 22 24 29 12 20 20 24 22 18 | |||||||||||||||||||||||||||||||||||||||||
Tables (Output of Computation) | |||||||||||||||||||||||||||||||||||||||||
| |||||||||||||||||||||||||||||||||||||||||
Figures (Output of Computation) | |||||||||||||||||||||||||||||||||||||||||
Input Parameters & R Code | |||||||||||||||||||||||||||||||||||||||||
| Parameters (Session): | |||||||||||||||||||||||||||||||||||||||||
| par1 = Organisation ; par4 = No season ; | |||||||||||||||||||||||||||||||||||||||||
| Parameters (R input): | |||||||||||||||||||||||||||||||||||||||||
| par1 = Organisation ; par2 = ; par3 = ; par4 = No season ; | |||||||||||||||||||||||||||||||||||||||||
| R code (references can be found in the software module): | |||||||||||||||||||||||||||||||||||||||||
if (par4 != 'No season') { | |||||||||||||||||||||||||||||||||||||||||