| Multiple Linear Regression - Estimated Regression Equation |
| I.P.C.N.[t] = + 72.839181298607 + 0.393111879092869T.I.P.[t] + e[t] |
| Multiple Linear Regression - Ordinary Least Squares | |||||
| Variable | Parameter | S.D. | T-STAT H0: parameter = 0 | 2-tail p-value | 1-tail p-value |
| (Intercept) | 72.839181298607 | 8.996611 | 8.0963 | 0 | 0 |
| T.I.P. | 0.393111879092869 | 0.086193 | 4.5608 | 2.7e-05 | 1.3e-05 |
| Multiple Linear Regression - Regression Statistics | |
| Multiple R | 0.513779201282127 |
| R-squared | 0.263969067670101 |
| Adjusted R-squared | 0.251278879181654 |
| F-TEST (value) | 20.801036005921 |
| F-TEST (DF numerator) | 1 |
| F-TEST (DF denominator) | 58 |
| p-value | 2.68695476206560e-05 |
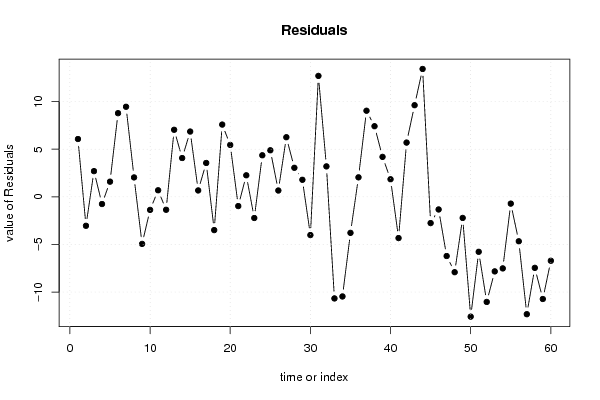
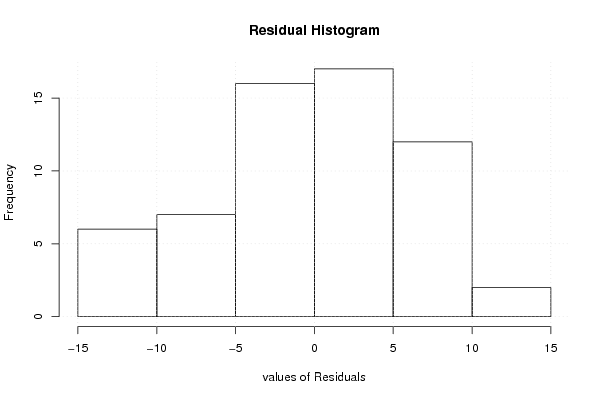
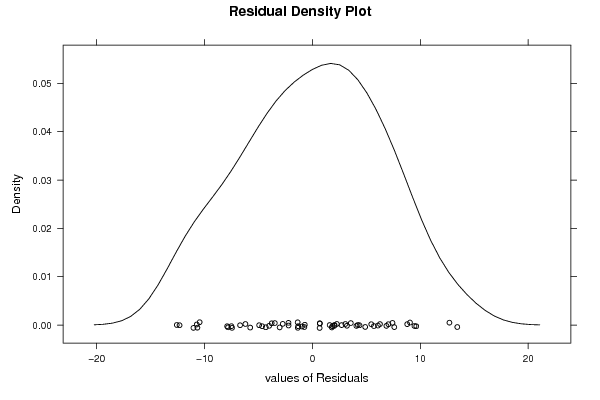
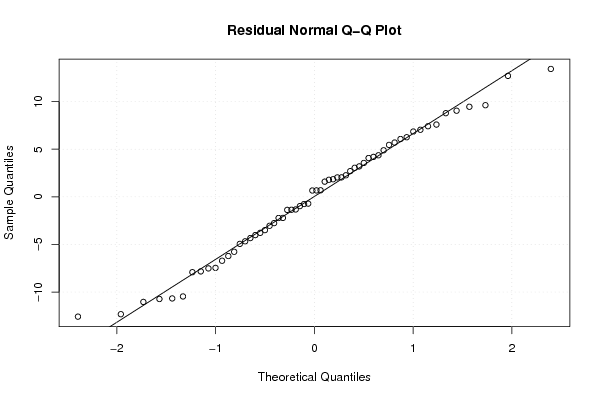
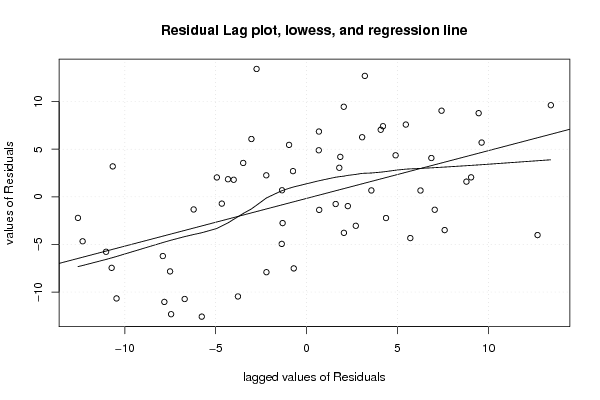
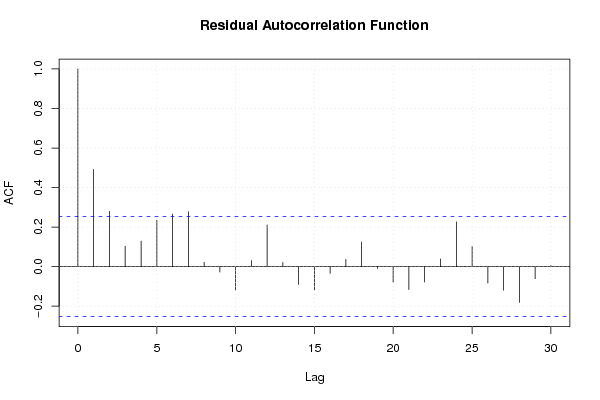
| Multiple Linear Regression - Residual Statistics | |
| Residual Standard Deviation | 6.47910918842311 |
| Sum Squared Residuals | 2434.77364077951 |
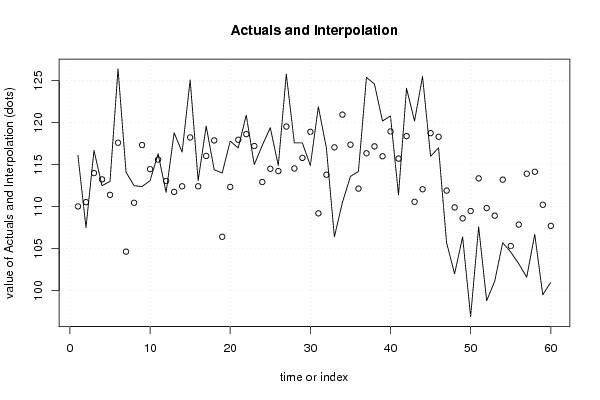
| Multiple Linear Regression - Actuals, Interpolation, and Residuals | |||
| Time or Index | Actuals | Interpolation Forecast | Residuals Prediction Error |
| 1 | 116.1 | 110.027565060792 | 6.0724349392077 |
| 2 | 107.5 | 110.538610503613 | -3.03861050361307 |
| 3 | 116.7 | 113.997995039630 | 2.70200496036969 |
| 4 | 112.5 | 113.251082469354 | -0.751082469353855 |
| 5 | 113 | 111.403456637617 | 1.59654336238263 |
| 6 | 126.4 | 117.614624327285 | 8.7853756727153 |
| 7 | 114.1 | 104.64193231722 | 9.45806768277997 |
| 8 | 112.5 | 110.459988127794 | 2.04001187220551 |
| 9 | 112.4 | 117.339446011920 | -4.93944601191969 |
| 10 | 113.1 | 114.469729294542 | -1.36972929454176 |
| 11 | 116.3 | 115.609753743911 | 0.690246256088929 |
| 12 | 111.7 | 113.054526529807 | -1.35452652980742 |
| 13 | 118.8 | 111.757257328801 | 7.04274267119904 |
| 14 | 116.5 | 112.425547523259 | 4.07445247674117 |
| 15 | 125.1 | 118.243603333833 | 6.8563966661667 |
| 16 | 113.1 | 112.425547523259 | 0.674452476741162 |
| 17 | 119.6 | 116.042176810913 | 3.55782318908677 |
| 18 | 114.4 | 117.889802642650 | -3.4898026426497 |
| 19 | 114 | 106.410935773138 | 7.58906422686206 |
| 20 | 117.8 | 112.346925147440 | 5.45307485255974 |
| 21 | 117 | 117.968425018468 | -0.968425018468282 |
| 22 | 120.9 | 118.636715212926 | 2.26328478707385 |
| 23 | 115 | 117.221512448192 | -2.22151244819183 |
| 24 | 117.3 | 112.936592966080 | 4.36340703392044 |
| 25 | 119.4 | 114.509040482451 | 4.89095951754897 |
| 26 | 114.9 | 114.233862167086 | 0.666137832913978 |
| 27 | 125.8 | 119.540872534840 | 6.25912746516024 |
| 28 | 117.6 | 114.548351670360 | 3.05164832963967 |
| 29 | 117.6 | 115.806309683457 | 1.79369031654249 |
| 30 | 114.9 | 118.911893528291 | -4.01189352829116 |
| 31 | 121.9 | 109.202030114697 | 12.6979698853027 |
| 32 | 117 | 113.801439100084 | 3.19856089991613 |
| 33 | 106.4 | 117.064267696555 | -10.6642676965547 |
| 34 | 110.5 | 120.956075299574 | -10.4560752995741 |
| 35 | 113.6 | 117.378757199829 | -3.77875719982898 |
| 36 | 114.2 | 112.150369207894 | 2.04963079210618 |
| 37 | 125.4 | 116.356666314188 | 9.04333368581248 |
| 38 | 124.6 | 117.182201260283 | 7.41779873971745 |
| 39 | 120.2 | 116.002865623004 | 4.19713437699607 |
| 40 | 120.8 | 118.951204716200 | 1.84879528379954 |
| 41 | 111.4 | 115.727687307639 | -4.32768730763892 |
| 42 | 124.1 | 118.400848085470 | 5.69915191452955 |
| 43 | 120.2 | 110.577921691522 | 9.62207830847765 |
| 44 | 125.5 | 112.071746832075 | 13.4282531679248 |
| 45 | 116 | 118.754648776654 | -2.75464877665402 |
| 46 | 117 | 118.322225709652 | -1.32222570965187 |
| 47 | 105.7 | 111.914502080438 | -6.2145020804381 |
| 48 | 102 | 109.909631497064 | -7.90963149706447 |
| 49 | 106.4 | 108.612362296058 | -2.21236229605800 |
| 50 | 96.9 | 109.477208430062 | -12.5772084300623 |
| 51 | 107.6 | 113.369016033082 | -5.76901603308172 |
| 52 | 98.8 | 109.831009121246 | -11.0310091212459 |
| 53 | 101.1 | 108.926851799332 | -7.8268517993323 |
| 54 | 105.7 | 113.211771281445 | -7.51177128144457 |
| 55 | 104.6 | 105.310222511678 | -0.710222511677907 |
| 56 | 103.2 | 107.865449725782 | -4.66544972578155 |
| 57 | 101.6 | 113.919372663812 | -12.3193726638117 |
| 58 | 106.7 | 114.155239791267 | -7.45523979126745 |
| 59 | 99.5 | 110.224121000339 | -10.7241210003388 |
| 60 | 101 | 107.708204974144 | -6.7082049741444 |
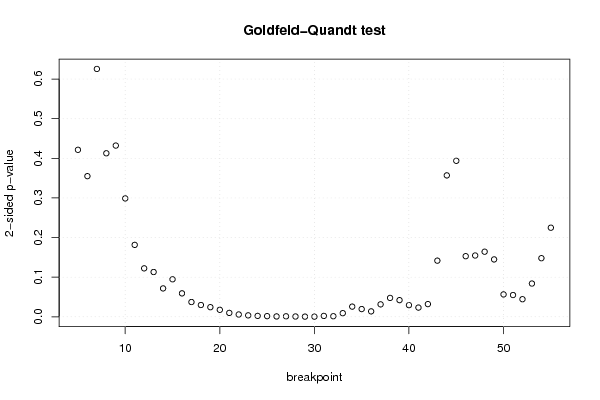
| Goldfeld-Quandt test for Heteroskedasticity | |||
| p-values | Alternative Hypothesis | ||
| breakpoint index | greater | 2-sided | less |
| 5 | 0.210720654013049 | 0.421441308026098 | 0.789279345986951 |
| 6 | 0.177464261642847 | 0.354928523285694 | 0.822535738357153 |
| 7 | 0.312803064400155 | 0.62560612880031 | 0.687196935599845 |
| 8 | 0.206346295454725 | 0.41269259090945 | 0.793653704545275 |
| 9 | 0.216098523567857 | 0.432197047135714 | 0.783901476432143 |
| 10 | 0.149384320224055 | 0.29876864044811 | 0.850615679775945 |
| 11 | 0.090727999210081 | 0.181455998420162 | 0.909272000789919 |
| 12 | 0.0611007152597041 | 0.122201430519408 | 0.938899284740296 |
| 13 | 0.0564593635084676 | 0.112918727016935 | 0.943540636491532 |
| 14 | 0.0357852850890879 | 0.0715705701781759 | 0.964214714910912 |
| 15 | 0.0472756128728817 | 0.0945512257457633 | 0.952724387127118 |
| 16 | 0.0295378298019811 | 0.0590756596039622 | 0.970462170198019 |
| 17 | 0.01856133931403 | 0.03712267862806 | 0.98143866068597 |
| 18 | 0.0148125966505389 | 0.0296251933010779 | 0.98518740334946 |
| 19 | 0.0120800528443884 | 0.0241601056887768 | 0.987919947155612 |
| 20 | 0.00875933748316333 | 0.0175186749663267 | 0.991240662516837 |
| 21 | 0.00486368025503348 | 0.00972736051006695 | 0.995136319744967 |
| 22 | 0.00285760178155233 | 0.00571520356310465 | 0.997142398218448 |
| 23 | 0.00176212577008145 | 0.00352425154016289 | 0.998237874229918 |
| 24 | 0.00108612534552317 | 0.00217225069104634 | 0.998913874654477 |
| 25 | 0.000767118666466525 | 0.00153423733293305 | 0.999232881333533 |
| 26 | 0.000395953556412454 | 0.000791907112824908 | 0.999604046443588 |
| 27 | 0.00057006977366842 | 0.00114013954733684 | 0.999429930226332 |
| 28 | 0.000313850182687613 | 0.000627700365375225 | 0.999686149817312 |
| 29 | 0.000157334499624379 | 0.000314668999248759 | 0.999842665500376 |
| 30 | 0.000122791541724234 | 0.000245583083448469 | 0.999877208458276 |
| 31 | 0.00103801594199871 | 0.00207603188399742 | 0.998961984058001 |
| 32 | 0.000662178703632911 | 0.00132435740726582 | 0.999337821296367 |
| 33 | 0.00450326406319998 | 0.00900652812639996 | 0.9954967359368 |
| 34 | 0.0127959862360739 | 0.0255919724721479 | 0.987204013763926 |
| 35 | 0.00969458807065116 | 0.0193891761413023 | 0.990305411929349 |
| 36 | 0.0067925513682854 | 0.0135851027365708 | 0.993207448631715 |
| 37 | 0.0156558424491415 | 0.0313116848982831 | 0.984344157550858 |
| 38 | 0.0237527691143980 | 0.0475055382287959 | 0.976247230885602 |
| 39 | 0.0209721525907927 | 0.0419443051815854 | 0.979027847409207 |
| 40 | 0.0146720057327009 | 0.0293440114654017 | 0.9853279942673 |
| 41 | 0.0115628557045015 | 0.0231257114090029 | 0.988437144295499 |
| 42 | 0.0159863891703456 | 0.0319727783406911 | 0.984013610829654 |
| 43 | 0.0708195603094888 | 0.141639120618978 | 0.929180439690511 |
| 44 | 0.821554255070212 | 0.356891489859577 | 0.178445744929788 |
| 45 | 0.803158892897666 | 0.393682214204667 | 0.196841107102334 |
| 46 | 0.92355270383289 | 0.152894592334219 | 0.0764472961671095 |
| 47 | 0.922687710888008 | 0.154624578223984 | 0.0773122891119922 |
| 48 | 0.917898668315098 | 0.164202663369805 | 0.0821013316849024 |
| 49 | 0.927630904758388 | 0.144738190483223 | 0.0723690952416116 |
| 50 | 0.971803898439624 | 0.0563922031207515 | 0.0281961015603758 |
| 51 | 0.972578129972113 | 0.054843740055775 | 0.0274218700278875 |
| 52 | 0.9778629206443 | 0.0442741587114013 | 0.0221370793557007 |
| 53 | 0.958082610129438 | 0.083834779741123 | 0.0419173898705616 |
| 54 | 0.926074780480197 | 0.147850439039605 | 0.0739252195198025 |
| 55 | 0.887604339292053 | 0.224791321415895 | 0.112395660707947 |
| Meta Analysis of Goldfeld-Quandt test for Heteroskedasticity | |||
| Description | # significant tests | % significant tests | OK/NOK |
| 1% type I error level | 13 | 0.254901960784314 | NOK |
| 5% type I error level | 27 | 0.529411764705882 | NOK |
| 10% type I error level | 33 | 0.647058823529412 | NOK |