Free Statistics

of Irreproducible Research!

Author's title

Author*The author of this computation has been verified*
R Software Modulerwasp_autocorrelation.wasp
Title produced by software(Partial) Autocorrelation Function
Date of computationSat, 18 Dec 2010 10:09:58 +0000
Cite this page as followsStatistical Computations at FreeStatistics.org, Office for Research Development and Education, URL https://freestatistics.org/blog/index.php?v=date/2010/Dec/18/t1292666893k2rgw4xmm12itns.htm/, Retrieved Tue, 30 Apr 2024 02:58:59 +0000
Statistical Computations at FreeStatistics.org, Office for Research Development and Education, URL https://freestatistics.org/blog/index.php?pk=111817, Retrieved Tue, 30 Apr 2024 02:58:59 +0000
QR Codes:

Original text written by user:
IsPrivate?No (this computation is public)
User-defined keywordsPaper-gas
Estimated Impact180
Family? (F = Feedback message, R = changed R code, M = changed R Module, P = changed Parameters, D = changed Data)
-     [Univariate Data Series] [] [2008-12-08 19:22:39] [d2d412c7f4d35ffbf5ee5ee89db327d4]
- RMPD    [(Partial) Autocorrelation Function] [Paper-gas] [2010-12-18 10:09:58] [c2514e24605d0513c6bae17788e1fef3] [Current]
Feedback Forum

Post a new message
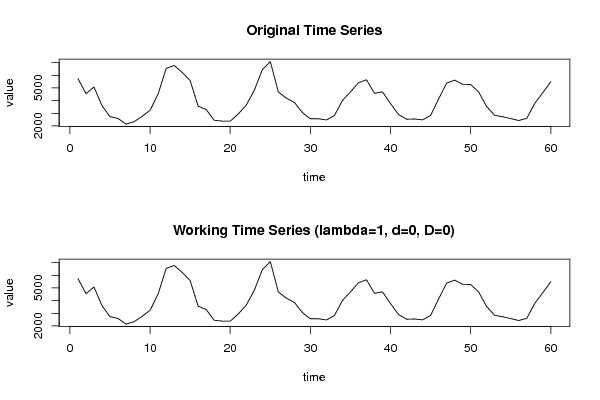
Dataseries X:
5745
4549
5074
3602
2732
2589
2148
2330
2752
3241
4517
6550
6778
6240
5570
3558
3299
2447
2380
2378
2947
3651
4816
6436
7090
4682
4198
3860
3056
2563
2568
2472
2821
4015
4686
5418
5649
4572
4695
3766
2900
2528
2549
2478
2828
4139
5390
5621
5291
5272
4677
3520
2842
2723
2581
2429
2606
3787
4630
5505


Summary of computational transaction
Raw Inputview raw input (R code)
Raw Outputview raw output of R engine
Computing time2 seconds
R Server'RServer@AstonUniversity' @ vre.aston.ac.uk

\begin{tabular}{lllllllll}
\hline
Summary of computational transaction \tabularnewline
Raw Input & view raw input (R code)  \tabularnewline
Raw Output & view raw output of R engine  \tabularnewline
Computing time & 2 seconds \tabularnewline
R Server & 'RServer@AstonUniversity' @ vre.aston.ac.uk \tabularnewline
\hline
\end{tabular}
%Source: https://freestatistics.org/blog/index.php?pk=111817&T=0

[TABLE]
[ROW][C]Summary of computational transaction[/C][/ROW]
[ROW][C]Raw Input[/C][C]view raw input (R code) [/C][/ROW]
[ROW][C]Raw Output[/C][C]view raw output of R engine [/C][/ROW]
[ROW][C]Computing time[/C][C]2 seconds[/C][/ROW]
[ROW][C]R Server[/C][C]'RServer@AstonUniversity' @ vre.aston.ac.uk[/C][/ROW]
[/TABLE]
Source: https://freestatistics.org/blog/index.php?pk=111817&T=0

Globally Unique Identifier (entire table): ba.freestatistics.org/blog/index.php?pk=111817&T=0

As an alternative you can also use a QR Code:  

The GUIDs for individual cells are displayed in the table below:

Summary of computational transaction
Raw Inputview raw input (R code)
Raw Outputview raw output of R engine
Computing time2 seconds
R Server'RServer@AstonUniversity' @ vre.aston.ac.uk


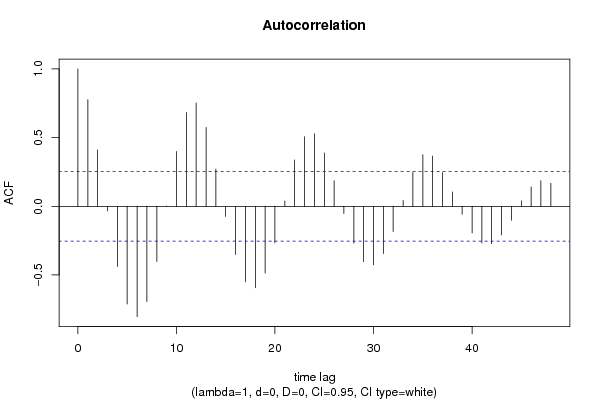
Autocorrelation Function
Time lag kACF(k)T-STATP-value
10.7765636.01520
20.4096093.17280.00119
3-0.034394-0.26640.395417
4-0.439654-3.40550.000592
5-0.712553-5.51940
6-0.804014-6.22790
7-0.693994-5.37571e-06
8-0.401795-3.11230.001421
90.0004380.00340.498651
100.3990663.09120.001511
110.6828515.28931e-06
120.7521735.82630
130.5740994.4471.9e-05
140.2704932.09520.02019
15-0.074436-0.57660.28319
16-0.350626-2.71590.00431
17-0.549558-4.25693.7e-05
18-0.59339-4.59641.1e-05
19-0.485999-3.76450.000191
20-0.266276-2.06260.021745
210.038690.29970.382723
220.3368722.60940.005717
230.5070413.92750.000112
240.527244.0846.7e-05
250.3874613.00130.001957
260.1860061.44080.07742
27-0.053288-0.41280.340623
28-0.268819-2.08230.020795
29-0.403592-3.12620.001365
30-0.426774-3.30580.000801
31-0.34479-2.67070.004863
32-0.184403-1.42840.079184
330.0428240.33170.370631
340.2467191.91110.030388
350.375572.90920.002538
360.3654782.8310.003153
370.2452591.89980.031136
380.104160.80680.211479
39-0.057932-0.44870.327617
40-0.19418-1.50410.0689
41-0.266862-2.06710.021523
42-0.273966-2.12210.018982
43-0.209409-1.62210.055015
44-0.101581-0.78680.217235
450.039470.30570.380434
460.1405191.08850.140373
470.1862191.44240.077188
480.1670611.2940.100304

\begin{tabular}{lllllllll}
\hline
Autocorrelation Function \tabularnewline
Time lag k & ACF(k) & T-STAT & P-value \tabularnewline
1 & 0.776563 & 6.0152 & 0 \tabularnewline
2 & 0.409609 & 3.1728 & 0.00119 \tabularnewline
3 & -0.034394 & -0.2664 & 0.395417 \tabularnewline
4 & -0.439654 & -3.4055 & 0.000592 \tabularnewline
5 & -0.712553 & -5.5194 & 0 \tabularnewline
6 & -0.804014 & -6.2279 & 0 \tabularnewline
7 & -0.693994 & -5.3757 & 1e-06 \tabularnewline
8 & -0.401795 & -3.1123 & 0.001421 \tabularnewline
9 & 0.000438 & 0.0034 & 0.498651 \tabularnewline
10 & 0.399066 & 3.0912 & 0.001511 \tabularnewline
11 & 0.682851 & 5.2893 & 1e-06 \tabularnewline
12 & 0.752173 & 5.8263 & 0 \tabularnewline
13 & 0.574099 & 4.447 & 1.9e-05 \tabularnewline
14 & 0.270493 & 2.0952 & 0.02019 \tabularnewline
15 & -0.074436 & -0.5766 & 0.28319 \tabularnewline
16 & -0.350626 & -2.7159 & 0.00431 \tabularnewline
17 & -0.549558 & -4.2569 & 3.7e-05 \tabularnewline
18 & -0.59339 & -4.5964 & 1.1e-05 \tabularnewline
19 & -0.485999 & -3.7645 & 0.000191 \tabularnewline
20 & -0.266276 & -2.0626 & 0.021745 \tabularnewline
21 & 0.03869 & 0.2997 & 0.382723 \tabularnewline
22 & 0.336872 & 2.6094 & 0.005717 \tabularnewline
23 & 0.507041 & 3.9275 & 0.000112 \tabularnewline
24 & 0.52724 & 4.084 & 6.7e-05 \tabularnewline
25 & 0.387461 & 3.0013 & 0.001957 \tabularnewline
26 & 0.186006 & 1.4408 & 0.07742 \tabularnewline
27 & -0.053288 & -0.4128 & 0.340623 \tabularnewline
28 & -0.268819 & -2.0823 & 0.020795 \tabularnewline
29 & -0.403592 & -3.1262 & 0.001365 \tabularnewline
30 & -0.426774 & -3.3058 & 0.000801 \tabularnewline
31 & -0.34479 & -2.6707 & 0.004863 \tabularnewline
32 & -0.184403 & -1.4284 & 0.079184 \tabularnewline
33 & 0.042824 & 0.3317 & 0.370631 \tabularnewline
34 & 0.246719 & 1.9111 & 0.030388 \tabularnewline
35 & 0.37557 & 2.9092 & 0.002538 \tabularnewline
36 & 0.365478 & 2.831 & 0.003153 \tabularnewline
37 & 0.245259 & 1.8998 & 0.031136 \tabularnewline
38 & 0.10416 & 0.8068 & 0.211479 \tabularnewline
39 & -0.057932 & -0.4487 & 0.327617 \tabularnewline
40 & -0.19418 & -1.5041 & 0.0689 \tabularnewline
41 & -0.266862 & -2.0671 & 0.021523 \tabularnewline
42 & -0.273966 & -2.1221 & 0.018982 \tabularnewline
43 & -0.209409 & -1.6221 & 0.055015 \tabularnewline
44 & -0.101581 & -0.7868 & 0.217235 \tabularnewline
45 & 0.03947 & 0.3057 & 0.380434 \tabularnewline
46 & 0.140519 & 1.0885 & 0.140373 \tabularnewline
47 & 0.186219 & 1.4424 & 0.077188 \tabularnewline
48 & 0.167061 & 1.294 & 0.100304 \tabularnewline
\hline
\end{tabular}
%Source: https://freestatistics.org/blog/index.php?pk=111817&T=1

[TABLE]
[ROW][C]Autocorrelation Function[/C][/ROW]
[ROW][C]Time lag k[/C][C]ACF(k)[/C][C]T-STAT[/C][C]P-value[/C][/ROW]
[ROW][C]1[/C][C]0.776563[/C][C]6.0152[/C][C]0[/C][/ROW]
[ROW][C]2[/C][C]0.409609[/C][C]3.1728[/C][C]0.00119[/C][/ROW]
[ROW][C]3[/C][C]-0.034394[/C][C]-0.2664[/C][C]0.395417[/C][/ROW]
[ROW][C]4[/C][C]-0.439654[/C][C]-3.4055[/C][C]0.000592[/C][/ROW]
[ROW][C]5[/C][C]-0.712553[/C][C]-5.5194[/C][C]0[/C][/ROW]
[ROW][C]6[/C][C]-0.804014[/C][C]-6.2279[/C][C]0[/C][/ROW]
[ROW][C]7[/C][C]-0.693994[/C][C]-5.3757[/C][C]1e-06[/C][/ROW]
[ROW][C]8[/C][C]-0.401795[/C][C]-3.1123[/C][C]0.001421[/C][/ROW]
[ROW][C]9[/C][C]0.000438[/C][C]0.0034[/C][C]0.498651[/C][/ROW]
[ROW][C]10[/C][C]0.399066[/C][C]3.0912[/C][C]0.001511[/C][/ROW]
[ROW][C]11[/C][C]0.682851[/C][C]5.2893[/C][C]1e-06[/C][/ROW]
[ROW][C]12[/C][C]0.752173[/C][C]5.8263[/C][C]0[/C][/ROW]
[ROW][C]13[/C][C]0.574099[/C][C]4.447[/C][C]1.9e-05[/C][/ROW]
[ROW][C]14[/C][C]0.270493[/C][C]2.0952[/C][C]0.02019[/C][/ROW]
[ROW][C]15[/C][C]-0.074436[/C][C]-0.5766[/C][C]0.28319[/C][/ROW]
[ROW][C]16[/C][C]-0.350626[/C][C]-2.7159[/C][C]0.00431[/C][/ROW]
[ROW][C]17[/C][C]-0.549558[/C][C]-4.2569[/C][C]3.7e-05[/C][/ROW]
[ROW][C]18[/C][C]-0.59339[/C][C]-4.5964[/C][C]1.1e-05[/C][/ROW]
[ROW][C]19[/C][C]-0.485999[/C][C]-3.7645[/C][C]0.000191[/C][/ROW]
[ROW][C]20[/C][C]-0.266276[/C][C]-2.0626[/C][C]0.021745[/C][/ROW]
[ROW][C]21[/C][C]0.03869[/C][C]0.2997[/C][C]0.382723[/C][/ROW]
[ROW][C]22[/C][C]0.336872[/C][C]2.6094[/C][C]0.005717[/C][/ROW]
[ROW][C]23[/C][C]0.507041[/C][C]3.9275[/C][C]0.000112[/C][/ROW]
[ROW][C]24[/C][C]0.52724[/C][C]4.084[/C][C]6.7e-05[/C][/ROW]
[ROW][C]25[/C][C]0.387461[/C][C]3.0013[/C][C]0.001957[/C][/ROW]
[ROW][C]26[/C][C]0.186006[/C][C]1.4408[/C][C]0.07742[/C][/ROW]
[ROW][C]27[/C][C]-0.053288[/C][C]-0.4128[/C][C]0.340623[/C][/ROW]
[ROW][C]28[/C][C]-0.268819[/C][C]-2.0823[/C][C]0.020795[/C][/ROW]
[ROW][C]29[/C][C]-0.403592[/C][C]-3.1262[/C][C]0.001365[/C][/ROW]
[ROW][C]30[/C][C]-0.426774[/C][C]-3.3058[/C][C]0.000801[/C][/ROW]
[ROW][C]31[/C][C]-0.34479[/C][C]-2.6707[/C][C]0.004863[/C][/ROW]
[ROW][C]32[/C][C]-0.184403[/C][C]-1.4284[/C][C]0.079184[/C][/ROW]
[ROW][C]33[/C][C]0.042824[/C][C]0.3317[/C][C]0.370631[/C][/ROW]
[ROW][C]34[/C][C]0.246719[/C][C]1.9111[/C][C]0.030388[/C][/ROW]
[ROW][C]35[/C][C]0.37557[/C][C]2.9092[/C][C]0.002538[/C][/ROW]
[ROW][C]36[/C][C]0.365478[/C][C]2.831[/C][C]0.003153[/C][/ROW]
[ROW][C]37[/C][C]0.245259[/C][C]1.8998[/C][C]0.031136[/C][/ROW]
[ROW][C]38[/C][C]0.10416[/C][C]0.8068[/C][C]0.211479[/C][/ROW]
[ROW][C]39[/C][C]-0.057932[/C][C]-0.4487[/C][C]0.327617[/C][/ROW]
[ROW][C]40[/C][C]-0.19418[/C][C]-1.5041[/C][C]0.0689[/C][/ROW]
[ROW][C]41[/C][C]-0.266862[/C][C]-2.0671[/C][C]0.021523[/C][/ROW]
[ROW][C]42[/C][C]-0.273966[/C][C]-2.1221[/C][C]0.018982[/C][/ROW]
[ROW][C]43[/C][C]-0.209409[/C][C]-1.6221[/C][C]0.055015[/C][/ROW]
[ROW][C]44[/C][C]-0.101581[/C][C]-0.7868[/C][C]0.217235[/C][/ROW]
[ROW][C]45[/C][C]0.03947[/C][C]0.3057[/C][C]0.380434[/C][/ROW]
[ROW][C]46[/C][C]0.140519[/C][C]1.0885[/C][C]0.140373[/C][/ROW]
[ROW][C]47[/C][C]0.186219[/C][C]1.4424[/C][C]0.077188[/C][/ROW]
[ROW][C]48[/C][C]0.167061[/C][C]1.294[/C][C]0.100304[/C][/ROW]
[/TABLE]
Source: https://freestatistics.org/blog/index.php?pk=111817&T=1

Globally Unique Identifier (entire table): ba.freestatistics.org/blog/index.php?pk=111817&T=1

As an alternative you can also use a QR Code:  

The GUIDs for individual cells are displayed in the table below:

Autocorrelation Function
Time lag kACF(k)T-STATP-value
10.7765636.01520
20.4096093.17280.00119
3-0.034394-0.26640.395417
4-0.439654-3.40550.000592
5-0.712553-5.51940
6-0.804014-6.22790
7-0.693994-5.37571e-06
8-0.401795-3.11230.001421
90.0004380.00340.498651
100.3990663.09120.001511
110.6828515.28931e-06
120.7521735.82630
130.5740994.4471.9e-05
140.2704932.09520.02019
15-0.074436-0.57660.28319
16-0.350626-2.71590.00431
17-0.549558-4.25693.7e-05
18-0.59339-4.59641.1e-05
19-0.485999-3.76450.000191
20-0.266276-2.06260.021745
210.038690.29970.382723
220.3368722.60940.005717
230.5070413.92750.000112
240.527244.0846.7e-05
250.3874613.00130.001957
260.1860061.44080.07742
27-0.053288-0.41280.340623
28-0.268819-2.08230.020795
29-0.403592-3.12620.001365
30-0.426774-3.30580.000801
31-0.34479-2.67070.004863
32-0.184403-1.42840.079184
330.0428240.33170.370631
340.2467191.91110.030388
350.375572.90920.002538
360.3654782.8310.003153
370.2452591.89980.031136
380.104160.80680.211479
39-0.057932-0.44870.327617
40-0.19418-1.50410.0689
41-0.266862-2.06710.021523
42-0.273966-2.12210.018982
43-0.209409-1.62210.055015
44-0.101581-0.78680.217235
450.039470.30570.380434
460.1405191.08850.140373
470.1862191.44240.077188
480.1670611.2940.100304


Partial Autocorrelation Function
Time lag kPACF(k)T-STATP-value
10.7765636.01520
2-0.487322-3.77480.000185
3-0.426375-3.30270.000809
4-0.315255-2.4420.008786
5-0.259245-2.00810.02457
6-0.263719-2.04280.022739
7-0.214013-1.65770.051295
8-0.091333-0.70750.241008
90.0266270.20630.418646
100.0681740.52810.299697
110.0716310.55480.29053
12-0.073493-0.56930.285647
13-0.280133-2.16990.016992
14-0.059571-0.46140.323078
150.0315950.24470.403747
160.1919211.48660.071177
17-0.041575-0.3220.374272
180.0212450.16460.43492
19-0.045371-0.35140.363245
20-0.168184-1.30270.09882
21-0.016844-0.13050.448316
220.1120360.86780.194474
23-0.018236-0.14130.444072
240.0500110.38740.349922
25-0.047215-0.36570.357928
260.088960.68910.246713
27-0.082307-0.63760.263096
28-0.094283-0.73030.234021
290.0835460.64710.260004
300.0796240.61680.26986
310.0290020.22460.411509
32-0.092339-0.71530.238614
330.0404030.3130.377697
34-0.016915-0.1310.448097
350.0594830.46080.32332
36-0.075033-0.58120.281639
37-0.13254-1.02670.154353
380.0385790.29880.38305
390.0688740.53350.29783
400.0013970.01080.495702
410.0756130.58570.280137
42-0.036788-0.2850.388327
43-0.011897-0.09220.463442
44-0.118209-0.91560.18176
45-0.076625-0.59350.277528
46-0.137003-1.06120.146422
47-0.06006-0.46520.321729
480.0209770.16250.435734

\begin{tabular}{lllllllll}
\hline
Partial Autocorrelation Function \tabularnewline
Time lag k & PACF(k) & T-STAT & P-value \tabularnewline
1 & 0.776563 & 6.0152 & 0 \tabularnewline
2 & -0.487322 & -3.7748 & 0.000185 \tabularnewline
3 & -0.426375 & -3.3027 & 0.000809 \tabularnewline
4 & -0.315255 & -2.442 & 0.008786 \tabularnewline
5 & -0.259245 & -2.0081 & 0.02457 \tabularnewline
6 & -0.263719 & -2.0428 & 0.022739 \tabularnewline
7 & -0.214013 & -1.6577 & 0.051295 \tabularnewline
8 & -0.091333 & -0.7075 & 0.241008 \tabularnewline
9 & 0.026627 & 0.2063 & 0.418646 \tabularnewline
10 & 0.068174 & 0.5281 & 0.299697 \tabularnewline
11 & 0.071631 & 0.5548 & 0.29053 \tabularnewline
12 & -0.073493 & -0.5693 & 0.285647 \tabularnewline
13 & -0.280133 & -2.1699 & 0.016992 \tabularnewline
14 & -0.059571 & -0.4614 & 0.323078 \tabularnewline
15 & 0.031595 & 0.2447 & 0.403747 \tabularnewline
16 & 0.191921 & 1.4866 & 0.071177 \tabularnewline
17 & -0.041575 & -0.322 & 0.374272 \tabularnewline
18 & 0.021245 & 0.1646 & 0.43492 \tabularnewline
19 & -0.045371 & -0.3514 & 0.363245 \tabularnewline
20 & -0.168184 & -1.3027 & 0.09882 \tabularnewline
21 & -0.016844 & -0.1305 & 0.448316 \tabularnewline
22 & 0.112036 & 0.8678 & 0.194474 \tabularnewline
23 & -0.018236 & -0.1413 & 0.444072 \tabularnewline
24 & 0.050011 & 0.3874 & 0.349922 \tabularnewline
25 & -0.047215 & -0.3657 & 0.357928 \tabularnewline
26 & 0.08896 & 0.6891 & 0.246713 \tabularnewline
27 & -0.082307 & -0.6376 & 0.263096 \tabularnewline
28 & -0.094283 & -0.7303 & 0.234021 \tabularnewline
29 & 0.083546 & 0.6471 & 0.260004 \tabularnewline
30 & 0.079624 & 0.6168 & 0.26986 \tabularnewline
31 & 0.029002 & 0.2246 & 0.411509 \tabularnewline
32 & -0.092339 & -0.7153 & 0.238614 \tabularnewline
33 & 0.040403 & 0.313 & 0.377697 \tabularnewline
34 & -0.016915 & -0.131 & 0.448097 \tabularnewline
35 & 0.059483 & 0.4608 & 0.32332 \tabularnewline
36 & -0.075033 & -0.5812 & 0.281639 \tabularnewline
37 & -0.13254 & -1.0267 & 0.154353 \tabularnewline
38 & 0.038579 & 0.2988 & 0.38305 \tabularnewline
39 & 0.068874 & 0.5335 & 0.29783 \tabularnewline
40 & 0.001397 & 0.0108 & 0.495702 \tabularnewline
41 & 0.075613 & 0.5857 & 0.280137 \tabularnewline
42 & -0.036788 & -0.285 & 0.388327 \tabularnewline
43 & -0.011897 & -0.0922 & 0.463442 \tabularnewline
44 & -0.118209 & -0.9156 & 0.18176 \tabularnewline
45 & -0.076625 & -0.5935 & 0.277528 \tabularnewline
46 & -0.137003 & -1.0612 & 0.146422 \tabularnewline
47 & -0.06006 & -0.4652 & 0.321729 \tabularnewline
48 & 0.020977 & 0.1625 & 0.435734 \tabularnewline
\hline
\end{tabular}
%Source: https://freestatistics.org/blog/index.php?pk=111817&T=2

[TABLE]
[ROW][C]Partial Autocorrelation Function[/C][/ROW]
[ROW][C]Time lag k[/C][C]PACF(k)[/C][C]T-STAT[/C][C]P-value[/C][/ROW]
[ROW][C]1[/C][C]0.776563[/C][C]6.0152[/C][C]0[/C][/ROW]
[ROW][C]2[/C][C]-0.487322[/C][C]-3.7748[/C][C]0.000185[/C][/ROW]
[ROW][C]3[/C][C]-0.426375[/C][C]-3.3027[/C][C]0.000809[/C][/ROW]
[ROW][C]4[/C][C]-0.315255[/C][C]-2.442[/C][C]0.008786[/C][/ROW]
[ROW][C]5[/C][C]-0.259245[/C][C]-2.0081[/C][C]0.02457[/C][/ROW]
[ROW][C]6[/C][C]-0.263719[/C][C]-2.0428[/C][C]0.022739[/C][/ROW]
[ROW][C]7[/C][C]-0.214013[/C][C]-1.6577[/C][C]0.051295[/C][/ROW]
[ROW][C]8[/C][C]-0.091333[/C][C]-0.7075[/C][C]0.241008[/C][/ROW]
[ROW][C]9[/C][C]0.026627[/C][C]0.2063[/C][C]0.418646[/C][/ROW]
[ROW][C]10[/C][C]0.068174[/C][C]0.5281[/C][C]0.299697[/C][/ROW]
[ROW][C]11[/C][C]0.071631[/C][C]0.5548[/C][C]0.29053[/C][/ROW]
[ROW][C]12[/C][C]-0.073493[/C][C]-0.5693[/C][C]0.285647[/C][/ROW]
[ROW][C]13[/C][C]-0.280133[/C][C]-2.1699[/C][C]0.016992[/C][/ROW]
[ROW][C]14[/C][C]-0.059571[/C][C]-0.4614[/C][C]0.323078[/C][/ROW]
[ROW][C]15[/C][C]0.031595[/C][C]0.2447[/C][C]0.403747[/C][/ROW]
[ROW][C]16[/C][C]0.191921[/C][C]1.4866[/C][C]0.071177[/C][/ROW]
[ROW][C]17[/C][C]-0.041575[/C][C]-0.322[/C][C]0.374272[/C][/ROW]
[ROW][C]18[/C][C]0.021245[/C][C]0.1646[/C][C]0.43492[/C][/ROW]
[ROW][C]19[/C][C]-0.045371[/C][C]-0.3514[/C][C]0.363245[/C][/ROW]
[ROW][C]20[/C][C]-0.168184[/C][C]-1.3027[/C][C]0.09882[/C][/ROW]
[ROW][C]21[/C][C]-0.016844[/C][C]-0.1305[/C][C]0.448316[/C][/ROW]
[ROW][C]22[/C][C]0.112036[/C][C]0.8678[/C][C]0.194474[/C][/ROW]
[ROW][C]23[/C][C]-0.018236[/C][C]-0.1413[/C][C]0.444072[/C][/ROW]
[ROW][C]24[/C][C]0.050011[/C][C]0.3874[/C][C]0.349922[/C][/ROW]
[ROW][C]25[/C][C]-0.047215[/C][C]-0.3657[/C][C]0.357928[/C][/ROW]
[ROW][C]26[/C][C]0.08896[/C][C]0.6891[/C][C]0.246713[/C][/ROW]
[ROW][C]27[/C][C]-0.082307[/C][C]-0.6376[/C][C]0.263096[/C][/ROW]
[ROW][C]28[/C][C]-0.094283[/C][C]-0.7303[/C][C]0.234021[/C][/ROW]
[ROW][C]29[/C][C]0.083546[/C][C]0.6471[/C][C]0.260004[/C][/ROW]
[ROW][C]30[/C][C]0.079624[/C][C]0.6168[/C][C]0.26986[/C][/ROW]
[ROW][C]31[/C][C]0.029002[/C][C]0.2246[/C][C]0.411509[/C][/ROW]
[ROW][C]32[/C][C]-0.092339[/C][C]-0.7153[/C][C]0.238614[/C][/ROW]
[ROW][C]33[/C][C]0.040403[/C][C]0.313[/C][C]0.377697[/C][/ROW]
[ROW][C]34[/C][C]-0.016915[/C][C]-0.131[/C][C]0.448097[/C][/ROW]
[ROW][C]35[/C][C]0.059483[/C][C]0.4608[/C][C]0.32332[/C][/ROW]
[ROW][C]36[/C][C]-0.075033[/C][C]-0.5812[/C][C]0.281639[/C][/ROW]
[ROW][C]37[/C][C]-0.13254[/C][C]-1.0267[/C][C]0.154353[/C][/ROW]
[ROW][C]38[/C][C]0.038579[/C][C]0.2988[/C][C]0.38305[/C][/ROW]
[ROW][C]39[/C][C]0.068874[/C][C]0.5335[/C][C]0.29783[/C][/ROW]
[ROW][C]40[/C][C]0.001397[/C][C]0.0108[/C][C]0.495702[/C][/ROW]
[ROW][C]41[/C][C]0.075613[/C][C]0.5857[/C][C]0.280137[/C][/ROW]
[ROW][C]42[/C][C]-0.036788[/C][C]-0.285[/C][C]0.388327[/C][/ROW]
[ROW][C]43[/C][C]-0.011897[/C][C]-0.0922[/C][C]0.463442[/C][/ROW]
[ROW][C]44[/C][C]-0.118209[/C][C]-0.9156[/C][C]0.18176[/C][/ROW]
[ROW][C]45[/C][C]-0.076625[/C][C]-0.5935[/C][C]0.277528[/C][/ROW]
[ROW][C]46[/C][C]-0.137003[/C][C]-1.0612[/C][C]0.146422[/C][/ROW]
[ROW][C]47[/C][C]-0.06006[/C][C]-0.4652[/C][C]0.321729[/C][/ROW]
[ROW][C]48[/C][C]0.020977[/C][C]0.1625[/C][C]0.435734[/C][/ROW]
[/TABLE]
Source: https://freestatistics.org/blog/index.php?pk=111817&T=2

Globally Unique Identifier (entire table): ba.freestatistics.org/blog/index.php?pk=111817&T=2

As an alternative you can also use a QR Code:  

The GUIDs for individual cells are displayed in the table below:

Partial Autocorrelation Function
Time lag kPACF(k)T-STATP-value
10.7765636.01520
2-0.487322-3.77480.000185
3-0.426375-3.30270.000809
4-0.315255-2.4420.008786
5-0.259245-2.00810.02457
6-0.263719-2.04280.022739
7-0.214013-1.65770.051295
8-0.091333-0.70750.241008
90.0266270.20630.418646
100.0681740.52810.299697
110.0716310.55480.29053
12-0.073493-0.56930.285647
13-0.280133-2.16990.016992
14-0.059571-0.46140.323078
150.0315950.24470.403747
160.1919211.48660.071177
17-0.041575-0.3220.374272
180.0212450.16460.43492
19-0.045371-0.35140.363245
20-0.168184-1.30270.09882
21-0.016844-0.13050.448316
220.1120360.86780.194474
23-0.018236-0.14130.444072
240.0500110.38740.349922
25-0.047215-0.36570.357928
260.088960.68910.246713
27-0.082307-0.63760.263096
28-0.094283-0.73030.234021
290.0835460.64710.260004
300.0796240.61680.26986
310.0290020.22460.411509
32-0.092339-0.71530.238614
330.0404030.3130.377697
34-0.016915-0.1310.448097
350.0594830.46080.32332
36-0.075033-0.58120.281639
37-0.13254-1.02670.154353
380.0385790.29880.38305
390.0688740.53350.29783
400.0013970.01080.495702
410.0756130.58570.280137
42-0.036788-0.2850.388327
43-0.011897-0.09220.463442
44-0.118209-0.91560.18176
45-0.076625-0.59350.277528
46-0.137003-1.06120.146422
47-0.06006-0.46520.321729
480.0209770.16250.435734


Parameters (Session):
par1 = 48 ; par2 = 1 ; par3 = 0 ; par4 = 0 ; par5 = 12 ; par6 = White Noise ; par7 = 0.95 ;
Parameters (R input):
par1 = 48 ; par2 = 1 ; par3 = 0 ; par4 = 0 ; par5 = 12 ; par6 = White Noise ; par7 = 0.95 ; par8 = ;
R code (references can be found in the software module):
if (par1 == 'Default') {
par1 = 10*log10(length(x))
} else {
par1 <- as.numeric(par1)
}
par2 <- as.numeric(par2)
par3 <- as.numeric(par3)
par4 <- as.numeric(par4)
par5 <- as.numeric(par5)
if (par6 == 'White Noise') par6 <- 'white' else par6 <- 'ma'
par7 <- as.numeric(par7)
if (par8 != '') par8 <- as.numeric(par8)
ox <- x
if (par8 == '') {
if (par2 == 0) {
x <- log(x)
} else {
x <- (x ^ par2 - 1) / par2
}
} else {
x <- log(x,base=par8)
}
if (par3 > 0) x <- diff(x,lag=1,difference=par3)
if (par4 > 0) x <- diff(x,lag=par5,difference=par4)
bitmap(file='picts.png')
op <- par(mfrow=c(2,1))
plot(ox,type='l',main='Original Time Series',xlab='time',ylab='value')
if (par8=='') {
mytitle <- paste('Working Time Series (lambda=',par2,', d=',par3,', D=',par4,')',sep='')
mysub <- paste('(lambda=',par2,', d=',par3,', D=',par4,', CI=', par7, ', CI type=',par6,')',sep='')
} else {
mytitle <- paste('Working Time Series (base=',par8,', d=',par3,', D=',par4,')',sep='')
mysub <- paste('(base=',par8,', d=',par3,', D=',par4,', CI=', par7, ', CI type=',par6,')',sep='')
}
plot(x,type='l', main=mytitle,xlab='time',ylab='value')
par(op)
dev.off()
bitmap(file='pic1.png')
racf <- acf(x, par1, main='Autocorrelation', xlab='time lag', ylab='ACF', ci.type=par6, ci=par7, sub=mysub)
dev.off()
bitmap(file='pic2.png')
rpacf <- pacf(x,par1,main='Partial Autocorrelation',xlab='lags',ylab='PACF',sub=mysub)
dev.off()
(myacf <- c(racf$acf))
(mypacf <- c(rpacf$acf))
lengthx <- length(x)
sqrtn <- sqrt(lengthx)
load(file='createtable')
a<-table.start()
a<-table.row.start(a)
a<-table.element(a,'Autocorrelation Function',4,TRUE)
a<-table.row.end(a)
a<-table.row.start(a)
a<-table.element(a,'Time lag k',header=TRUE)
a<-table.element(a,hyperlink('basics.htm','ACF(k)','click here for more information about the Autocorrelation Function'),header=TRUE)
a<-table.element(a,'T-STAT',header=TRUE)
a<-table.element(a,'P-value',header=TRUE)
a<-table.row.end(a)
for (i in 2:(par1+1)) {
a<-table.row.start(a)
a<-table.element(a,i-1,header=TRUE)
a<-table.element(a,round(myacf[i],6))
mytstat <- myacf[i]*sqrtn
a<-table.element(a,round(mytstat,4))
a<-table.element(a,round(1-pt(abs(mytstat),lengthx),6))
a<-table.row.end(a)
}
a<-table.end(a)
table.save(a,file='mytable.tab')
a<-table.start()
a<-table.row.start(a)
a<-table.element(a,'Partial Autocorrelation Function',4,TRUE)
a<-table.row.end(a)
a<-table.row.start(a)
a<-table.element(a,'Time lag k',header=TRUE)
a<-table.element(a,hyperlink('basics.htm','PACF(k)','click here for more information about the Partial Autocorrelation Function'),header=TRUE)
a<-table.element(a,'T-STAT',header=TRUE)
a<-table.element(a,'P-value',header=TRUE)
a<-table.row.end(a)
for (i in 1:par1) {
a<-table.row.start(a)
a<-table.element(a,i,header=TRUE)
a<-table.element(a,round(mypacf[i],6))
mytstat <- mypacf[i]*sqrtn
a<-table.element(a,round(mytstat,4))
a<-table.element(a,round(1-pt(abs(mytstat),lengthx),6))
a<-table.row.end(a)
}
a<-table.end(a)
table.save(a,file='mytable1.tab')