Free Statistics

of Irreproducible Research!

Author's title

Author*The author of this computation has been verified*
R Software Modulerwasp_autocorrelation.wasp
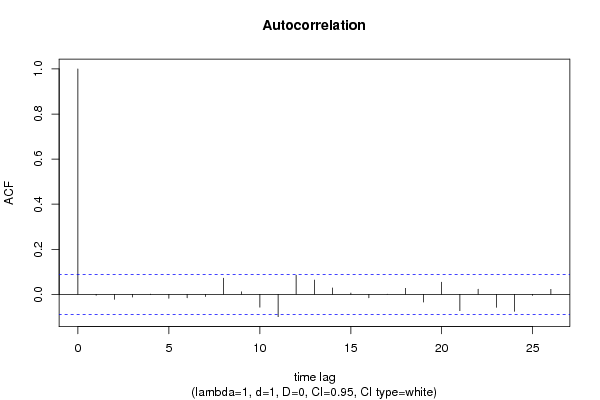
Title produced by software(Partial) Autocorrelation Function
Date of computationFri, 17 Dec 2010 20:36:18 +0000
Cite this page as followsStatistical Computations at FreeStatistics.org, Office for Research Development and Education, URL https://freestatistics.org/blog/index.php?v=date/2010/Dec/17/t1292618128e3he985avik9hgw.htm/, Retrieved Tue, 07 May 2024 01:17:12 +0000
Statistical Computations at FreeStatistics.org, Office for Research Development and Education, URL https://freestatistics.org/blog/index.php?pk=111715, Retrieved Tue, 07 May 2024 01:17:12 +0000
QR Codes:

Original text written by user:
IsPrivate?No (this computation is public)
User-defined keywords
Estimated Impact119
Family? (F = Feedback message, R = changed R code, M = changed R Module, P = changed Parameters, D = changed Data)
-     [Univariate Data Series] [data set] [2008-12-01 19:54:57] [b98453cac15ba1066b407e146608df68]
- RMP   [Spectral Analysis] [Unemployment] [2010-11-29 09:21:38] [b98453cac15ba1066b407e146608df68]
- RMPD    [(Partial) Autocorrelation Function] [tutorial] [2010-12-13 19:38:16] [2db53827eae1799a3d605fb62e1e92dc]
- R PD      [(Partial) Autocorrelation Function] [tutorial 9d1] [2010-12-15 16:44:23] [8b2514d8f13517d765015fc185a22b4b]
-   PD          [(Partial) Autocorrelation Function] [ACF stationair] [2010-12-17 20:36:18] [109f5cd2d2b7c934778912c55604f6f1] [Current]
Feedback Forum

Post a new message
Dataseries X:
126,64
126,81
125,84
126,77
124,34
124,4
120,48
118,54
117,66
116,97
120,11
119,16
116,9
116,11
114,98
113,65
115,82
117,59
118,57
118,07
114,98
114,04
115,02
114,28
115,04
116,7
119,21
118,39
116,5
115,46
117,59
117,33
116,2
116,83
118,99
118,62
121,09
122,4
123,76
125,33
123,23
122,52
123,64
124,67
124,71
122,53
124,4
125,45
125,35
124,3
127,03
128,51
128,1
128,94
129,67
129,87
131,12
132,68
132,24
133,63
129,91
127,93
131,17
130,86
133,48
134,08
136,02
132,8
132,37
133,05
132,57
130,7
130,5
129,67
127,8
126,82
126,85
128,28
128,3
126,82
125,08
128,53
130,34
131,52
132,59
131,17
132,72
133,36
132,82
132,9
130,9
129,41
128,67
129,28
130,91
131,06
130,84
131,41
133,22
132,06
132,48
134,38
135,22
134,89
136,09
136,33
136,32
137,48
136,53
136,8
138,03
137,39
137,55
136,08
134,78
133,28
133,57
134,84
133,02
133,49
133,77
134,34
134,5
134,03
135,51
136,53
135,95
134,32
132,44
133,61
131,02
130,05
128,21
129,03
130,34
131,57
132,63
132,06
134,44
134,1
132,49
134,23
134,92
135,61
134,53
133,86
133,89
135,33
135,86
136,22
137,38
137,31
136,89
138,01
136,72
135,77
137,52
135,61
132,94
134,12
132,55
134,11
134,19
135,57
135,05
134,32
133,61
134,75
133,1
133,26
131,63
132,47
132,45
133,33
133,57
134,13
133,92
132,62
132,3
133,26
132,6
134,38
134,17
135,46
135,09
134,96
133,85
132,59
131,15
130,91
131,07
130,78
129,95
131,41
131,21
130,68
130,46
131,12
132,99
133,02
133,39
134,07
135,6
135,66
135,53
135,82
136,9
137,97
138,09
136,91
134,76
135,13
134,66
132,95
132,25
134,3
134,3
134,76
134,81
134,51
135,11
134,32
133,51
134,02
132,76
133,39
132,05
131,87
133,03
132,57
132,1
130,7
129,2
129,77
131,02
131,55
133,17
133,08
133,24
130,74
129,91
130,03
131,13
129,55
130,22
130,61
129,27
129,68
130,1
130,83
130,95
131,73
131,86
132,44
132,35
133,16
133,62
132,54
132,69
133,5
133,36
134,23
132,41
133,02
132,88
130,76
130,33
129,79
128,65
129,14
127,35
127,74
126,31
125,95
126,36
126,15
125,6
126,2
126,73
125,68
122,49
122,07
123,4
123,01
123,03
122,33
122,42
122,68
124,69
123,3
124,17
124,38
123,19
122,16
120,66
120,92
120,67
120,68
121,1
120,86
121,48
123,48
121,72
123,16
123,84
124,57
124,3
124,22
124,43
123,33
122,86
121,25
122,16
122,62
123,44
124
124,75
124,8
125,93
126,28
126,04
125,04
123,76
125,34
126,99
126,34
127,42
126,18
125,3
123,5
125,32
124,65
124,03
125,11
125,46
124,7
124,48
124,76
125,81
124,95
123,66
122,66
119,34
117,84
120,97
117,38
118,06
116,99
115,55
114,17
115,32
112,49
111,93
112,08
111,63
109,53
111,35
110,79
113,06
112,62
110,65
112,36
113,74
111,73
109,86
109,32
109,99
109,84
111,13
112,43
111,77
112,15
112,89
112,12
113,1
111,09
110,76
109,59
109,99
110,25
108,31
108,79
108,14
109,88
109,93
110,46
109,56
111,49
111,85
111,35
110,95
112,49
113,11
112,54
112,84
111,5
111,52
111,57
112,48
112,31
113,79
114,01
113,64
112,62
113,27
113,51
112,92
113,66
113,14
113,48
113,23
110,56
109,5
109,78
109,49
109,66
109,93
109,82
108,54
108,23
106,19
106,49
107,15
107,74
107,54
107,07
107,54
107,81
108,38
108,42
106,86
106,41
106,46
106,84
107,69
107,04
111,04
111,93
111,98
112,07
112,05
113,14
112,49
113,2
113,52
113,22
113,85
113,68
114,26
114,1
114,8
114,98
115,1
114,21
114,24
113,35
114,23
114,43
114,28
113
113,16
112,59
113,65
113,18
113,21
113,11
112,78
112,57
111,87
111,94
113,18
113,67
115,15
114,41
112,88
112,44
113,48
112,78
112,59
113,31
113,21
112,5
113,72
114,09
113,97
112,5
111,28
111,35
110,92
110,73
109


Summary of computational transaction
Raw Inputview raw input (R code)
Raw Outputview raw output of R engine
Computing time3 seconds
R Server'RServer@AstonUniversity' @ vre.aston.ac.uk

\begin{tabular}{lllllllll}
\hline
Summary of computational transaction \tabularnewline
Raw Input & view raw input (R code)  \tabularnewline
Raw Output & view raw output of R engine  \tabularnewline
Computing time & 3 seconds \tabularnewline
R Server & 'RServer@AstonUniversity' @ vre.aston.ac.uk \tabularnewline
\hline
\end{tabular}
%Source: https://freestatistics.org/blog/index.php?pk=111715&T=0

[TABLE]
[ROW][C]Summary of computational transaction[/C][/ROW]
[ROW][C]Raw Input[/C][C]view raw input (R code) [/C][/ROW]
[ROW][C]Raw Output[/C][C]view raw output of R engine [/C][/ROW]
[ROW][C]Computing time[/C][C]3 seconds[/C][/ROW]
[ROW][C]R Server[/C][C]'RServer@AstonUniversity' @ vre.aston.ac.uk[/C][/ROW]
[/TABLE]
Source: https://freestatistics.org/blog/index.php?pk=111715&T=0

Globally Unique Identifier (entire table): ba.freestatistics.org/blog/index.php?pk=111715&T=0

As an alternative you can also use a QR Code:  

The GUIDs for individual cells are displayed in the table below:

Summary of computational transaction
Raw Inputview raw input (R code)
Raw Outputview raw output of R engine
Computing time3 seconds
R Server'RServer@AstonUniversity' @ vre.aston.ac.uk


Autocorrelation Function
Time lag kACF(k)T-STATP-value
1-0.004123-0.09130.463655
2-0.021808-0.48270.31475
3-0.011411-0.25260.400346
40.0009130.02020.491943
5-0.017655-0.39080.348052
6-0.014971-0.33140.370242
7-0.009918-0.21950.413158
80.0718121.58960.056281
90.0111230.24620.402806
10-0.056739-1.2560.104861
11-0.098829-2.18770.014583
120.0849631.88070.030301
130.0632621.40040.08102
140.0285970.6330.26351
150.0057970.12830.44897
16-0.01544-0.34180.366334
171e-040.00220.499113
180.0267420.5920.277075
19-0.033872-0.74980.226871
200.0540051.19550.116243
21-0.072159-1.59730.055422
220.0226340.5010.308292
23-0.057666-1.27650.101193
24-0.07528-1.66640.048136
25-0.004612-0.10210.459364
260.0224090.49610.310041

\begin{tabular}{lllllllll}
\hline
Autocorrelation Function \tabularnewline
Time lag k & ACF(k) & T-STAT & P-value \tabularnewline
1 & -0.004123 & -0.0913 & 0.463655 \tabularnewline
2 & -0.021808 & -0.4827 & 0.31475 \tabularnewline
3 & -0.011411 & -0.2526 & 0.400346 \tabularnewline
4 & 0.000913 & 0.0202 & 0.491943 \tabularnewline
5 & -0.017655 & -0.3908 & 0.348052 \tabularnewline
6 & -0.014971 & -0.3314 & 0.370242 \tabularnewline
7 & -0.009918 & -0.2195 & 0.413158 \tabularnewline
8 & 0.071812 & 1.5896 & 0.056281 \tabularnewline
9 & 0.011123 & 0.2462 & 0.402806 \tabularnewline
10 & -0.056739 & -1.256 & 0.104861 \tabularnewline
11 & -0.098829 & -2.1877 & 0.014583 \tabularnewline
12 & 0.084963 & 1.8807 & 0.030301 \tabularnewline
13 & 0.063262 & 1.4004 & 0.08102 \tabularnewline
14 & 0.028597 & 0.633 & 0.26351 \tabularnewline
15 & 0.005797 & 0.1283 & 0.44897 \tabularnewline
16 & -0.01544 & -0.3418 & 0.366334 \tabularnewline
17 & 1e-04 & 0.0022 & 0.499113 \tabularnewline
18 & 0.026742 & 0.592 & 0.277075 \tabularnewline
19 & -0.033872 & -0.7498 & 0.226871 \tabularnewline
20 & 0.054005 & 1.1955 & 0.116243 \tabularnewline
21 & -0.072159 & -1.5973 & 0.055422 \tabularnewline
22 & 0.022634 & 0.501 & 0.308292 \tabularnewline
23 & -0.057666 & -1.2765 & 0.101193 \tabularnewline
24 & -0.07528 & -1.6664 & 0.048136 \tabularnewline
25 & -0.004612 & -0.1021 & 0.459364 \tabularnewline
26 & 0.022409 & 0.4961 & 0.310041 \tabularnewline
\hline
\end{tabular}
%Source: https://freestatistics.org/blog/index.php?pk=111715&T=1

[TABLE]
[ROW][C]Autocorrelation Function[/C][/ROW]
[ROW][C]Time lag k[/C][C]ACF(k)[/C][C]T-STAT[/C][C]P-value[/C][/ROW]
[ROW][C]1[/C][C]-0.004123[/C][C]-0.0913[/C][C]0.463655[/C][/ROW]
[ROW][C]2[/C][C]-0.021808[/C][C]-0.4827[/C][C]0.31475[/C][/ROW]
[ROW][C]3[/C][C]-0.011411[/C][C]-0.2526[/C][C]0.400346[/C][/ROW]
[ROW][C]4[/C][C]0.000913[/C][C]0.0202[/C][C]0.491943[/C][/ROW]
[ROW][C]5[/C][C]-0.017655[/C][C]-0.3908[/C][C]0.348052[/C][/ROW]
[ROW][C]6[/C][C]-0.014971[/C][C]-0.3314[/C][C]0.370242[/C][/ROW]
[ROW][C]7[/C][C]-0.009918[/C][C]-0.2195[/C][C]0.413158[/C][/ROW]
[ROW][C]8[/C][C]0.071812[/C][C]1.5896[/C][C]0.056281[/C][/ROW]
[ROW][C]9[/C][C]0.011123[/C][C]0.2462[/C][C]0.402806[/C][/ROW]
[ROW][C]10[/C][C]-0.056739[/C][C]-1.256[/C][C]0.104861[/C][/ROW]
[ROW][C]11[/C][C]-0.098829[/C][C]-2.1877[/C][C]0.014583[/C][/ROW]
[ROW][C]12[/C][C]0.084963[/C][C]1.8807[/C][C]0.030301[/C][/ROW]
[ROW][C]13[/C][C]0.063262[/C][C]1.4004[/C][C]0.08102[/C][/ROW]
[ROW][C]14[/C][C]0.028597[/C][C]0.633[/C][C]0.26351[/C][/ROW]
[ROW][C]15[/C][C]0.005797[/C][C]0.1283[/C][C]0.44897[/C][/ROW]
[ROW][C]16[/C][C]-0.01544[/C][C]-0.3418[/C][C]0.366334[/C][/ROW]
[ROW][C]17[/C][C]1e-04[/C][C]0.0022[/C][C]0.499113[/C][/ROW]
[ROW][C]18[/C][C]0.026742[/C][C]0.592[/C][C]0.277075[/C][/ROW]
[ROW][C]19[/C][C]-0.033872[/C][C]-0.7498[/C][C]0.226871[/C][/ROW]
[ROW][C]20[/C][C]0.054005[/C][C]1.1955[/C][C]0.116243[/C][/ROW]
[ROW][C]21[/C][C]-0.072159[/C][C]-1.5973[/C][C]0.055422[/C][/ROW]
[ROW][C]22[/C][C]0.022634[/C][C]0.501[/C][C]0.308292[/C][/ROW]
[ROW][C]23[/C][C]-0.057666[/C][C]-1.2765[/C][C]0.101193[/C][/ROW]
[ROW][C]24[/C][C]-0.07528[/C][C]-1.6664[/C][C]0.048136[/C][/ROW]
[ROW][C]25[/C][C]-0.004612[/C][C]-0.1021[/C][C]0.459364[/C][/ROW]
[ROW][C]26[/C][C]0.022409[/C][C]0.4961[/C][C]0.310041[/C][/ROW]
[/TABLE]
Source: https://freestatistics.org/blog/index.php?pk=111715&T=1

Globally Unique Identifier (entire table): ba.freestatistics.org/blog/index.php?pk=111715&T=1

As an alternative you can also use a QR Code:  

The GUIDs for individual cells are displayed in the table below:

Autocorrelation Function
Time lag kACF(k)T-STATP-value
1-0.004123-0.09130.463655
2-0.021808-0.48270.31475
3-0.011411-0.25260.400346
40.0009130.02020.491943
5-0.017655-0.39080.348052
6-0.014971-0.33140.370242
7-0.009918-0.21950.413158
80.0718121.58960.056281
90.0111230.24620.402806
10-0.056739-1.2560.104861
11-0.098829-2.18770.014583
120.0849631.88070.030301
130.0632621.40040.08102
140.0285970.6330.26351
150.0057970.12830.44897
16-0.01544-0.34180.366334
171e-040.00220.499113
180.0267420.5920.277075
19-0.033872-0.74980.226871
200.0540051.19550.116243
21-0.072159-1.59730.055422
220.0226340.5010.308292
23-0.057666-1.27650.101193
24-0.07528-1.66640.048136
25-0.004612-0.10210.459364
260.0224090.49610.310041


Partial Autocorrelation Function
Time lag kPACF(k)T-STATP-value
1-0.004123-0.09130.463655
2-0.021825-0.48310.314613
3-0.011598-0.25670.398743
40.0003370.00750.497023
5-0.018164-0.40210.343904
6-0.01525-0.33760.367912
7-0.010842-0.240.405217
80.0707191.56540.059064
90.0110350.24430.403559
10-0.054454-1.20540.114315
11-0.098708-2.1850.014681
120.0826561.82970.033954
130.0635521.40680.080062
140.0332170.73530.231258
150.0079620.17620.430088
16-0.024628-0.54520.292943
17-0.001597-0.03530.485909
180.0388870.86080.194882
19-0.013757-0.30450.38043
200.0449980.99610.159853
21-0.097064-2.14860.016077
220.0168420.37280.354725
23-0.038008-0.84130.200282
24-0.06562-1.45260.073494
25-0.008445-0.18690.425891
260.003340.07390.470544

\begin{tabular}{lllllllll}
\hline
Partial Autocorrelation Function \tabularnewline
Time lag k & PACF(k) & T-STAT & P-value \tabularnewline
1 & -0.004123 & -0.0913 & 0.463655 \tabularnewline
2 & -0.021825 & -0.4831 & 0.314613 \tabularnewline
3 & -0.011598 & -0.2567 & 0.398743 \tabularnewline
4 & 0.000337 & 0.0075 & 0.497023 \tabularnewline
5 & -0.018164 & -0.4021 & 0.343904 \tabularnewline
6 & -0.01525 & -0.3376 & 0.367912 \tabularnewline
7 & -0.010842 & -0.24 & 0.405217 \tabularnewline
8 & 0.070719 & 1.5654 & 0.059064 \tabularnewline
9 & 0.011035 & 0.2443 & 0.403559 \tabularnewline
10 & -0.054454 & -1.2054 & 0.114315 \tabularnewline
11 & -0.098708 & -2.185 & 0.014681 \tabularnewline
12 & 0.082656 & 1.8297 & 0.033954 \tabularnewline
13 & 0.063552 & 1.4068 & 0.080062 \tabularnewline
14 & 0.033217 & 0.7353 & 0.231258 \tabularnewline
15 & 0.007962 & 0.1762 & 0.430088 \tabularnewline
16 & -0.024628 & -0.5452 & 0.292943 \tabularnewline
17 & -0.001597 & -0.0353 & 0.485909 \tabularnewline
18 & 0.038887 & 0.8608 & 0.194882 \tabularnewline
19 & -0.013757 & -0.3045 & 0.38043 \tabularnewline
20 & 0.044998 & 0.9961 & 0.159853 \tabularnewline
21 & -0.097064 & -2.1486 & 0.016077 \tabularnewline
22 & 0.016842 & 0.3728 & 0.354725 \tabularnewline
23 & -0.038008 & -0.8413 & 0.200282 \tabularnewline
24 & -0.06562 & -1.4526 & 0.073494 \tabularnewline
25 & -0.008445 & -0.1869 & 0.425891 \tabularnewline
26 & 0.00334 & 0.0739 & 0.470544 \tabularnewline
\hline
\end{tabular}
%Source: https://freestatistics.org/blog/index.php?pk=111715&T=2

[TABLE]
[ROW][C]Partial Autocorrelation Function[/C][/ROW]
[ROW][C]Time lag k[/C][C]PACF(k)[/C][C]T-STAT[/C][C]P-value[/C][/ROW]
[ROW][C]1[/C][C]-0.004123[/C][C]-0.0913[/C][C]0.463655[/C][/ROW]
[ROW][C]2[/C][C]-0.021825[/C][C]-0.4831[/C][C]0.314613[/C][/ROW]
[ROW][C]3[/C][C]-0.011598[/C][C]-0.2567[/C][C]0.398743[/C][/ROW]
[ROW][C]4[/C][C]0.000337[/C][C]0.0075[/C][C]0.497023[/C][/ROW]
[ROW][C]5[/C][C]-0.018164[/C][C]-0.4021[/C][C]0.343904[/C][/ROW]
[ROW][C]6[/C][C]-0.01525[/C][C]-0.3376[/C][C]0.367912[/C][/ROW]
[ROW][C]7[/C][C]-0.010842[/C][C]-0.24[/C][C]0.405217[/C][/ROW]
[ROW][C]8[/C][C]0.070719[/C][C]1.5654[/C][C]0.059064[/C][/ROW]
[ROW][C]9[/C][C]0.011035[/C][C]0.2443[/C][C]0.403559[/C][/ROW]
[ROW][C]10[/C][C]-0.054454[/C][C]-1.2054[/C][C]0.114315[/C][/ROW]
[ROW][C]11[/C][C]-0.098708[/C][C]-2.185[/C][C]0.014681[/C][/ROW]
[ROW][C]12[/C][C]0.082656[/C][C]1.8297[/C][C]0.033954[/C][/ROW]
[ROW][C]13[/C][C]0.063552[/C][C]1.4068[/C][C]0.080062[/C][/ROW]
[ROW][C]14[/C][C]0.033217[/C][C]0.7353[/C][C]0.231258[/C][/ROW]
[ROW][C]15[/C][C]0.007962[/C][C]0.1762[/C][C]0.430088[/C][/ROW]
[ROW][C]16[/C][C]-0.024628[/C][C]-0.5452[/C][C]0.292943[/C][/ROW]
[ROW][C]17[/C][C]-0.001597[/C][C]-0.0353[/C][C]0.485909[/C][/ROW]
[ROW][C]18[/C][C]0.038887[/C][C]0.8608[/C][C]0.194882[/C][/ROW]
[ROW][C]19[/C][C]-0.013757[/C][C]-0.3045[/C][C]0.38043[/C][/ROW]
[ROW][C]20[/C][C]0.044998[/C][C]0.9961[/C][C]0.159853[/C][/ROW]
[ROW][C]21[/C][C]-0.097064[/C][C]-2.1486[/C][C]0.016077[/C][/ROW]
[ROW][C]22[/C][C]0.016842[/C][C]0.3728[/C][C]0.354725[/C][/ROW]
[ROW][C]23[/C][C]-0.038008[/C][C]-0.8413[/C][C]0.200282[/C][/ROW]
[ROW][C]24[/C][C]-0.06562[/C][C]-1.4526[/C][C]0.073494[/C][/ROW]
[ROW][C]25[/C][C]-0.008445[/C][C]-0.1869[/C][C]0.425891[/C][/ROW]
[ROW][C]26[/C][C]0.00334[/C][C]0.0739[/C][C]0.470544[/C][/ROW]
[/TABLE]
Source: https://freestatistics.org/blog/index.php?pk=111715&T=2

Globally Unique Identifier (entire table): ba.freestatistics.org/blog/index.php?pk=111715&T=2

As an alternative you can also use a QR Code:  

The GUIDs for individual cells are displayed in the table below:

Partial Autocorrelation Function
Time lag kPACF(k)T-STATP-value
1-0.004123-0.09130.463655
2-0.021825-0.48310.314613
3-0.011598-0.25670.398743
40.0003370.00750.497023
5-0.018164-0.40210.343904
6-0.01525-0.33760.367912
7-0.010842-0.240.405217
80.0707191.56540.059064
90.0110350.24430.403559
10-0.054454-1.20540.114315
11-0.098708-2.1850.014681
120.0826561.82970.033954
130.0635521.40680.080062
140.0332170.73530.231258
150.0079620.17620.430088
16-0.024628-0.54520.292943
17-0.001597-0.03530.485909
180.0388870.86080.194882
19-0.013757-0.30450.38043
200.0449980.99610.159853
21-0.097064-2.14860.016077
220.0168420.37280.354725
23-0.038008-0.84130.200282
24-0.06562-1.45260.073494
25-0.008445-0.18690.425891
260.003340.07390.470544


Parameters (Session):
par1 = additive ; par2 = 12 ;
Parameters (R input):
par1 = Default ; par2 = 1 ; par3 = 1 ; par4 = 0 ; par5 = 12 ; par6 = White Noise ; par7 = 0.95 ; par8 = ;
R code (references can be found in the software module):
if (par1 == 'Default') {
par1 = 10*log10(length(x))
} else {
par1 <- as.numeric(par1)
}
par2 <- as.numeric(par2)
par3 <- as.numeric(par3)
par4 <- as.numeric(par4)
par5 <- 5
if (par6 == 'White Noise') par6 <- 'white' else par6 <- 'ma'
par7 <- as.numeric(par7)
if (par8 != '') par8 <- as.numeric(par8)
ox <- x
if (par8 == '') {
if (par2 == 0) {
x <- log(x)
} else {
x <- (x ^ par2 - 1) / par2
}
} else {
x <- log(x,base=par8)
}
if (par3 > 0) x <- diff(x,lag=1,difference=par3)
if (par4 > 0) x <- diff(x,lag=par5,difference=par4)
bitmap(file='picts.png')
op <- par(mfrow=c(2,1))
plot(ox,type='l',main='Original Time Series',xlab='time',ylab='value')
if (par8=='') {
mytitle <- paste('Working Time Series (lambda=',par2,', d=',par3,', D=',par4,')',sep='')
mysub <- paste('(lambda=',par2,', d=',par3,', D=',par4,', CI=', par7, ', CI type=',par6,')',sep='')
} else {
mytitle <- paste('Working Time Series (base=',par8,', d=',par3,', D=',par4,')',sep='')
mysub <- paste('(base=',par8,', d=',par3,', D=',par4,', CI=', par7, ', CI type=',par6,')',sep='')
}
plot(x,type='l', main=mytitle,xlab='time',ylab='value')
par(op)
dev.off()
bitmap(file='pic1.png')
racf <- acf(x, par1, main='Autocorrelation', xlab='time lag', ylab='ACF', ci.type=par6, ci=par7, sub=mysub)
dev.off()
bitmap(file='pic2.png')
rpacf <- pacf(x,par1,main='Partial Autocorrelation',xlab='lags',ylab='PACF',sub=mysub)
dev.off()
(myacf <- c(racf$acf))
(mypacf <- c(rpacf$acf))
lengthx <- length(x)
sqrtn <- sqrt(lengthx)
load(file='createtable')
a<-table.start()
a<-table.row.start(a)
a<-table.element(a,'Autocorrelation Function',4,TRUE)
a<-table.row.end(a)
a<-table.row.start(a)
a<-table.element(a,'Time lag k',header=TRUE)
a<-table.element(a,hyperlink('basics.htm','ACF(k)','click here for more information about the Autocorrelation Function'),header=TRUE)
a<-table.element(a,'T-STAT',header=TRUE)
a<-table.element(a,'P-value',header=TRUE)
a<-table.row.end(a)
for (i in 2:(par1+1)) {
a<-table.row.start(a)
a<-table.element(a,i-1,header=TRUE)
a<-table.element(a,round(myacf[i],6))
mytstat <- myacf[i]*sqrtn
a<-table.element(a,round(mytstat,4))
a<-table.element(a,round(1-pt(abs(mytstat),lengthx),6))
a<-table.row.end(a)
}
a<-table.end(a)
table.save(a,file='mytable.tab')
a<-table.start()
a<-table.row.start(a)
a<-table.element(a,'Partial Autocorrelation Function',4,TRUE)
a<-table.row.end(a)
a<-table.row.start(a)
a<-table.element(a,'Time lag k',header=TRUE)
a<-table.element(a,hyperlink('basics.htm','PACF(k)','click here for more information about the Partial Autocorrelation Function'),header=TRUE)
a<-table.element(a,'T-STAT',header=TRUE)
a<-table.element(a,'P-value',header=TRUE)
a<-table.row.end(a)
for (i in 1:par1) {
a<-table.row.start(a)
a<-table.element(a,i,header=TRUE)
a<-table.element(a,round(mypacf[i],6))
mytstat <- mypacf[i]*sqrtn
a<-table.element(a,round(mytstat,4))
a<-table.element(a,round(1-pt(abs(mytstat),lengthx),6))
a<-table.row.end(a)
}
a<-table.end(a)
table.save(a,file='mytable1.tab')