Free Statistics

of Irreproducible Research!

Author's title

Author*The author of this computation has been verified*
R Software Modulerwasp_smp.wasp
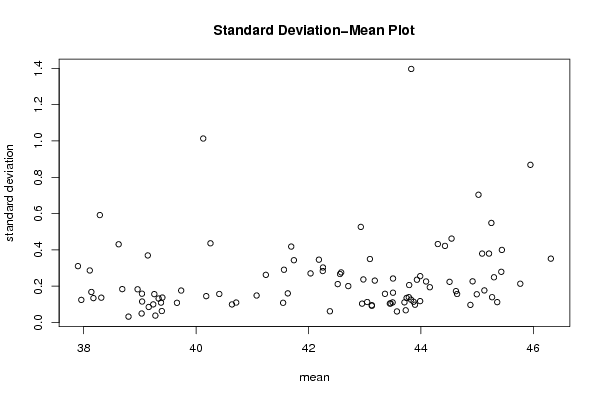
Title produced by softwareStandard Deviation-Mean Plot
Date of computationFri, 17 Dec 2010 20:13:38 +0000
Cite this page as followsStatistical Computations at FreeStatistics.org, Office for Research Development and Education, URL https://freestatistics.org/blog/index.php?v=date/2010/Dec/17/t1292616732fyfawn08kvhdbig.htm/, Retrieved Mon, 06 May 2024 17:28:05 +0000
Statistical Computations at FreeStatistics.org, Office for Research Development and Education, URL https://freestatistics.org/blog/index.php?pk=111704, Retrieved Mon, 06 May 2024 17:28:05 +0000
QR Codes:

Original text written by user:
IsPrivate?No (this computation is public)
User-defined keywords
Estimated Impact142
Family? (F = Feedback message, R = changed R code, M = changed R Module, P = changed Parameters, D = changed Data)
-     [Univariate Data Series] [data set] [2008-12-01 19:54:57] [b98453cac15ba1066b407e146608df68]
- RMP   [Standard Deviation-Mean Plot] [Unemployment] [2010-11-29 10:34:47] [b98453cac15ba1066b407e146608df68]
- R PD    [Standard Deviation-Mean Plot] [tutorial] [2010-12-13 19:55:01] [2db53827eae1799a3d605fb62e1e92dc]
-    D      [Standard Deviation-Mean Plot] [tutorial9SMP] [2010-12-15 16:56:05] [8b2514d8f13517d765015fc185a22b4b]
- R  D          [Standard Deviation-Mean Plot] [workshop9] [2010-12-17 20:13:38] [6e19356a8195a048e2417405f21c29e8] [Current]
Feedback Forum

Post a new message
Dataseries X:
40.7819
39.5915
38.8859
39.9068
41.47
41.5613
41.6005
41.4113
41.84
42.2892
43.1521
43.5998
43.116
42.4185
42.3687
42.2975
42.8528
43.535
44.7265
45.7293
45.7585
46.1685
46.5075
46.527
46.601
46.4607
46.7135
46.4113
45.55
44.6081
44.4395
44.9847
45.7558
45.3942
45.697
45.5664
46.0205
45.9195
45.8005
45.535
45.4977
45.5782
45.7697
45.2445
45.0615
45.2865
44.791
44.7625
44.7644
44.9973
44.7265
45.1465
44.7465
45.1795
45.6515
45.492
45.2775
45.2115
45.411
45.4005
44.7692
44.8913
45.032
44.879
44.833
44.8257
44.7815
44.479
44.6317
44.5043
44.3217
44.1005
44.047
43.6835
43.7864
44.1807
43.9595
43.937
43.991
43.865
43.671
43.93
43.863
43.7095
43.9435
43.736
43.6295
43.598
43.8726
43.8935
43.5957
43.7155
43.528
43.3415
43.3374
43.332
43.3869
43.5016
43.4875
43.6023
43.3886
43.3105
43.4455
43.5185
43.5755
43.6217
43.644
43.5789
43.5215
43.5033
43.632
43.263
43.3717
43.2745
43.2647
43.324
43.4455
43.4098
43.41
43.93
43.8104
43.54
43.858
43.8375
43.881
43.887
43.8009
43.7877
43.811
44.0625
44.125
44.52
45.4005
45.89
45.189
44.9035
44.9351
44.801
43.98
44.11
44.2661
44.361
44.099
43.8435
43.8914
44.217
44.506
44.54
44.4465
44.842
44.8946
44.951
45.445
45.0035
45.769
46.09
45.412
45.12
45.48
45.105
45.056
45.22
45.39
45.041
44.9399
44.9315
45.1935
45.3466
45.4645
45.5685
45.3921
45.34
45.1308
45.1005
45.37
45.2
44.9614
44.8015
44.9152
45.095
44.9271
44.6026
44.5
44.54
44.5532
44.407
44.259
44.1365
44.112
43.8814
43.98
43.7294
43.9119
43.955
43.9
43.7065
43.6939
43.6587
43.5885
43.8885
43.8216
43.751
43.699
43.7425
43.639
43.589
43.606
43.5325
43.385
43.3745
43.236
43.1957
43.01
43.1401
43.0487
43.1972
43.2461
43.0866
43.0865
43.0194
43.08
43.007
42.9278
42.9545
42.7995
42.9048
42.9468
43.08
43.1274
43.1625
43.45
43.831
43.7769
43.98
43.92
44.11
44.03
44.1582
44.14
45.07
44.8737
44.8505
44.373
44.075
43.9725
44.094
44.191
43.9685
43.79
43.6041
43.1707
42.71
42.755
43.3316
43.5
43.154
43.16
43.1
42.85
42.6175
42.5
42.6285
42.6974
43.04
42.673
42.5015
42.538
42.3735
42.014
41.8618
42.1824
42.605
42.7345
42.615
42.465
42.34
42.251
42.0475
41.86
41.685
41.735
41.706
41.764
41.58
41.373
41.088
41.137
41.1587
41.185
40.819
40.633
40.858
40.794
40.69
40.595
40.7305
40.5471
40.5145
40.7
40.7
40.522
40.6165
40.3985
40.2815
40.245
40.3055
40.2696
40.251
40.127
39.95
39.675
39.954
39.8828
39.62
39.5415
39.525
39.8145
39.6675
39.695
39.5985
39.2735
39.1435
39.1742
39.2025
39.3946
39.5025
39.4845
39.33
39.295
39.2675
39.2535
38.9845
38.9285
38.8592
38.77
38.79
38.8205
38.7577
38.839
38.78
38.54
38.511
38.615
38.898
38.8691
38.384
38.0277
37.72
37.7325
37.626
37.603
37.78
38.559
39.0459
38.45
38.505
38.2885
37.795
37.92
38.034
38.029
38.063
37.9828
37.745
37.969
38.007
38.0615
38.0912
38.091
38.431
38.48
38.35
38.214
38.384
38.1375
38.0075
38.0524
38.235
38.31
38.2615
38.13
38.282
38.581
39.0801
39.0387
39.1015
39.1503
39.14
39.0275
38.7665
38.691
38.849
39.1644
39.4907
39.5095
39.2795
39.0437
39.1355
39.143
39.185
39.355
39.297
39.4514
39.4173
39.4305
39.384
39.3261
39.301
39.35
39.64
39.4723
39.3685
39.1906
39.1183
39.1325
39.1144
39.1614
39.0908
38.9199
38.913
38.9655
39.029
39.089
39.07
39.0046
39.1038
39.3572
39.388
39.382
39.4398
39.2537
39.2301
39.2763
39.282
39.3325
39.557
40.1
40.5875
40.485
40.55
40.7955
41.456
41.3557
41.374
41.2235
41.15
41.3725
41.6923
41.8
41.8045
41.64
41.36
41.5745
41.593
41.575
41.68
42.0055
42.3188
42.565
42.3575
42.29
42.695
43.0028
42.4507
42.4705
42.2875
42.3172
42.55
42.7523
42.8993
43.1555
43.1885
43.43
43.31
42.815
42.7017
42.28
41.922
42.17
42.1962
42.3215
42.3173
42.391
42.463
42.4125
42.304
41.813
41.651
41.539
41.1575
40.9545


Summary of computational transaction
Raw Inputview raw input (R code)
Raw Outputview raw output of R engine
Computing time3 seconds
R Server'George Udny Yule' @ 72.249.76.132

\begin{tabular}{lllllllll}
\hline
Summary of computational transaction \tabularnewline
Raw Input & view raw input (R code)  \tabularnewline
Raw Output & view raw output of R engine  \tabularnewline
Computing time & 3 seconds \tabularnewline
R Server & 'George Udny Yule' @ 72.249.76.132 \tabularnewline
\hline
\end{tabular}
%Source: https://freestatistics.org/blog/index.php?pk=111704&T=0

[TABLE]
[ROW][C]Summary of computational transaction[/C][/ROW]
[ROW][C]Raw Input[/C][C]view raw input (R code) [/C][/ROW]
[ROW][C]Raw Output[/C][C]view raw output of R engine [/C][/ROW]
[ROW][C]Computing time[/C][C]3 seconds[/C][/ROW]
[ROW][C]R Server[/C][C]'George Udny Yule' @ 72.249.76.132[/C][/ROW]
[/TABLE]
Source: https://freestatistics.org/blog/index.php?pk=111704&T=0

Globally Unique Identifier (entire table): ba.freestatistics.org/blog/index.php?pk=111704&T=0

As an alternative you can also use a QR Code:  

The GUIDs for individual cells are displayed in the table below:

Summary of computational transaction
Raw Inputview raw input (R code)
Raw Outputview raw output of R engine
Computing time3 seconds
R Server'George Udny Yule' @ 72.249.76.132


Standard Deviation-Mean Plot
SectionMeanStandard DeviationRange
140.127221.013424919271282.5841
241.740460.3431680390129610.877900000000004
342.931020.5266025987402651.23110000000000
443.828221.396561669601453.4318
546.31250.3517525763942610.842500000000001
645.948720.868509045433612.10540000000000
745.254240.5485528078498921.31630000000000
845.768380.2137145222019320.485500000000002
945.430320.2793495158399240.708199999999998
1044.920340.2269116413937360.523999999999994
1145.09010.3796739390582390.924999999999997
1245.35850.1123749304782860.280499999999996
1344.88090.0971008238893980.262799999999999
1444.644440.1571723194458870.346699999999998
1543.987820.2553701176723690.638199999999998
1643.986640.1179780615199290.315700000000000
1743.82340.1260502875839640.272500000000001
1843.745920.1354252819823540.295500000000004
1943.503620.1642241060258800.378099999999996
2043.462060.1054069399992240.270299999999999
2143.447720.1044832139628190.265000000000001
2243.573880.06114320894424560.140699999999995
2343.361180.1580468822849720.369
2443.503860.2423880112546830.606000000000002
2543.785380.1396161595231730.341000000000001
2643.869820.1144270378887790.274799999999999
2745.02490.703765976728061.765
2844.545920.4622450724453440.955100000000002
2944.09220.2262262252701930.517499999999998
3044.51030.2241767160077070.625
3145.212620.3797604797763980.874400000000001
3245.44140.3998434693727060.985000000000007
3345.129380.1769414366393580.450099999999999
3445.300920.2492259657419350.637
3545.266680.1395171924889550.291600000000003
3644.994620.1556948361378780.398500000000006
3744.624580.1730393943586270.427100000000003
3844.159180.1944741936607520.525599999999997
3943.895260.09818176001681770.250599999999999
4043.707220.1112306252791910.299999999999997
4143.730620.06750534793629110.182599999999994
4243.49740.1108542962631590.231500000000004
4343.12610.09564013278953630.225999999999999
4443.127160.09214511924133670.226700000000001
4542.953760.1039731359534750.280499999999996
4643.04430.1130462737112540.2577
4743.791580.2064219755743060.529999999999994
4844.301640.4323175314511311.04
4944.428940.4219788418866510.901200000000003
5043.929520.2357482279890990.5869
5143.093460.3498386027870560.789999999999999
5242.97630.2373361540094560.542499999999997
5342.707780.2007145784441170.539999999999999
5442.257760.3031264802025690.676199999999994
5542.520380.2116945252008170.552099999999996
5642.03670.2706232621191310.655000000000001
5741.63160.1606962974060090.391000000000005
5841.077540.1488475999134680.366
5940.7140.1100386295807050.262999999999998
6040.638420.0996975777037750.216000000000001
6140.41270.1573366613348590.371500000000005
6240.180620.1453671971250720.355499999999999
6339.734660.1761196411533950.412500000000001
6439.66010.1085802698467830.289500000000004
6539.237660.1000551997649280.251099999999994
6639.37590.1097994763193330.234999999999999
6738.959140.1830243781576650.483499999999999
6838.797440.03239510765532350.0812999999999988
6938.686620.1840174502594800.387000000000000
7037.898040.3106752049971170.758000000000003
7138.287580.5919006521368261.44290000000000
7238.10850.2867825831531620.710000000000001
7337.957760.1246703172371050.318000000000005
7438.136340.1682614869778570.423999999999999
7538.31310.1368395045299400.342499999999994
7638.173280.1345171624737900.302500000000002
7738.622360.430940498212920.950099999999999
7839.037160.1587974433043560.383800000000001
7939.140920.3695922983504930.8185
8039.157340.08556402865690630.235799999999998
8139.390240.06330326215922990.154400000000003
8239.400220.1374936071241130.338999999999999
8339.256440.1564701824629840.353999999999999
8439.03990.1155496862825710.248400000000004
8539.031620.04968472602319510.1235
8639.334160.1322344433194310.335999999999999
8739.274920.03816611062186000.102400000000003
8840.25590.4363789064563031.03050000000000
8941.240940.2626054892800250.660500000000006
9041.563860.2907169121327470.654499999999999
9141.54850.1087002759886110.280000000000001
9242.185360.3461586673766820.884999999999998
9342.58180.2760332316950270.712800000000001
9442.561260.2671160478144270.611799999999995
9543.17980.230920603238430.615000000000002
9642.253980.2836071790346660.779700000000005
9742.381060.06207691197216520.145699999999998
9841.69290.4183184193888681.14650000000000

\begin{tabular}{lllllllll}
\hline
Standard Deviation-Mean Plot \tabularnewline
Section & Mean & Standard Deviation & Range \tabularnewline
1 & 40.12722 & 1.01342491927128 & 2.5841 \tabularnewline
2 & 41.74046 & 0.343168039012961 & 0.877900000000004 \tabularnewline
3 & 42.93102 & 0.526602598740265 & 1.23110000000000 \tabularnewline
4 & 43.82822 & 1.39656166960145 & 3.4318 \tabularnewline
5 & 46.3125 & 0.351752576394261 & 0.842500000000001 \tabularnewline
6 & 45.94872 & 0.86850904543361 & 2.10540000000000 \tabularnewline
7 & 45.25424 & 0.548552807849892 & 1.31630000000000 \tabularnewline
8 & 45.76838 & 0.213714522201932 & 0.485500000000002 \tabularnewline
9 & 45.43032 & 0.279349515839924 & 0.708199999999998 \tabularnewline
10 & 44.92034 & 0.226911641393736 & 0.523999999999994 \tabularnewline
11 & 45.0901 & 0.379673939058239 & 0.924999999999997 \tabularnewline
12 & 45.3585 & 0.112374930478286 & 0.280499999999996 \tabularnewline
13 & 44.8809 & 0.097100823889398 & 0.262799999999999 \tabularnewline
14 & 44.64444 & 0.157172319445887 & 0.346699999999998 \tabularnewline
15 & 43.98782 & 0.255370117672369 & 0.638199999999998 \tabularnewline
16 & 43.98664 & 0.117978061519929 & 0.315700000000000 \tabularnewline
17 & 43.8234 & 0.126050287583964 & 0.272500000000001 \tabularnewline
18 & 43.74592 & 0.135425281982354 & 0.295500000000004 \tabularnewline
19 & 43.50362 & 0.164224106025880 & 0.378099999999996 \tabularnewline
20 & 43.46206 & 0.105406939999224 & 0.270299999999999 \tabularnewline
21 & 43.44772 & 0.104483213962819 & 0.265000000000001 \tabularnewline
22 & 43.57388 & 0.0611432089442456 & 0.140699999999995 \tabularnewline
23 & 43.36118 & 0.158046882284972 & 0.369 \tabularnewline
24 & 43.50386 & 0.242388011254683 & 0.606000000000002 \tabularnewline
25 & 43.78538 & 0.139616159523173 & 0.341000000000001 \tabularnewline
26 & 43.86982 & 0.114427037888779 & 0.274799999999999 \tabularnewline
27 & 45.0249 & 0.70376597672806 & 1.765 \tabularnewline
28 & 44.54592 & 0.462245072445344 & 0.955100000000002 \tabularnewline
29 & 44.0922 & 0.226226225270193 & 0.517499999999998 \tabularnewline
30 & 44.5103 & 0.224176716007707 & 0.625 \tabularnewline
31 & 45.21262 & 0.379760479776398 & 0.874400000000001 \tabularnewline
32 & 45.4414 & 0.399843469372706 & 0.985000000000007 \tabularnewline
33 & 45.12938 & 0.176941436639358 & 0.450099999999999 \tabularnewline
34 & 45.30092 & 0.249225965741935 & 0.637 \tabularnewline
35 & 45.26668 & 0.139517192488955 & 0.291600000000003 \tabularnewline
36 & 44.99462 & 0.155694836137878 & 0.398500000000006 \tabularnewline
37 & 44.62458 & 0.173039394358627 & 0.427100000000003 \tabularnewline
38 & 44.15918 & 0.194474193660752 & 0.525599999999997 \tabularnewline
39 & 43.89526 & 0.0981817600168177 & 0.250599999999999 \tabularnewline
40 & 43.70722 & 0.111230625279191 & 0.299999999999997 \tabularnewline
41 & 43.73062 & 0.0675053479362911 & 0.182599999999994 \tabularnewline
42 & 43.4974 & 0.110854296263159 & 0.231500000000004 \tabularnewline
43 & 43.1261 & 0.0956401327895363 & 0.225999999999999 \tabularnewline
44 & 43.12716 & 0.0921451192413367 & 0.226700000000001 \tabularnewline
45 & 42.95376 & 0.103973135953475 & 0.280499999999996 \tabularnewline
46 & 43.0443 & 0.113046273711254 & 0.2577 \tabularnewline
47 & 43.79158 & 0.206421975574306 & 0.529999999999994 \tabularnewline
48 & 44.30164 & 0.432317531451131 & 1.04 \tabularnewline
49 & 44.42894 & 0.421978841886651 & 0.901200000000003 \tabularnewline
50 & 43.92952 & 0.235748227989099 & 0.5869 \tabularnewline
51 & 43.09346 & 0.349838602787056 & 0.789999999999999 \tabularnewline
52 & 42.9763 & 0.237336154009456 & 0.542499999999997 \tabularnewline
53 & 42.70778 & 0.200714578444117 & 0.539999999999999 \tabularnewline
54 & 42.25776 & 0.303126480202569 & 0.676199999999994 \tabularnewline
55 & 42.52038 & 0.211694525200817 & 0.552099999999996 \tabularnewline
56 & 42.0367 & 0.270623262119131 & 0.655000000000001 \tabularnewline
57 & 41.6316 & 0.160696297406009 & 0.391000000000005 \tabularnewline
58 & 41.07754 & 0.148847599913468 & 0.366 \tabularnewline
59 & 40.714 & 0.110038629580705 & 0.262999999999998 \tabularnewline
60 & 40.63842 & 0.099697577703775 & 0.216000000000001 \tabularnewline
61 & 40.4127 & 0.157336661334859 & 0.371500000000005 \tabularnewline
62 & 40.18062 & 0.145367197125072 & 0.355499999999999 \tabularnewline
63 & 39.73466 & 0.176119641153395 & 0.412500000000001 \tabularnewline
64 & 39.6601 & 0.108580269846783 & 0.289500000000004 \tabularnewline
65 & 39.23766 & 0.100055199764928 & 0.251099999999994 \tabularnewline
66 & 39.3759 & 0.109799476319333 & 0.234999999999999 \tabularnewline
67 & 38.95914 & 0.183024378157665 & 0.483499999999999 \tabularnewline
68 & 38.79744 & 0.0323951076553235 & 0.0812999999999988 \tabularnewline
69 & 38.68662 & 0.184017450259480 & 0.387000000000000 \tabularnewline
70 & 37.89804 & 0.310675204997117 & 0.758000000000003 \tabularnewline
71 & 38.28758 & 0.591900652136826 & 1.44290000000000 \tabularnewline
72 & 38.1085 & 0.286782583153162 & 0.710000000000001 \tabularnewline
73 & 37.95776 & 0.124670317237105 & 0.318000000000005 \tabularnewline
74 & 38.13634 & 0.168261486977857 & 0.423999999999999 \tabularnewline
75 & 38.3131 & 0.136839504529940 & 0.342499999999994 \tabularnewline
76 & 38.17328 & 0.134517162473790 & 0.302500000000002 \tabularnewline
77 & 38.62236 & 0.43094049821292 & 0.950099999999999 \tabularnewline
78 & 39.03716 & 0.158797443304356 & 0.383800000000001 \tabularnewline
79 & 39.14092 & 0.369592298350493 & 0.8185 \tabularnewline
80 & 39.15734 & 0.0855640286569063 & 0.235799999999998 \tabularnewline
81 & 39.39024 & 0.0633032621592299 & 0.154400000000003 \tabularnewline
82 & 39.40022 & 0.137493607124113 & 0.338999999999999 \tabularnewline
83 & 39.25644 & 0.156470182462984 & 0.353999999999999 \tabularnewline
84 & 39.0399 & 0.115549686282571 & 0.248400000000004 \tabularnewline
85 & 39.03162 & 0.0496847260231951 & 0.1235 \tabularnewline
86 & 39.33416 & 0.132234443319431 & 0.335999999999999 \tabularnewline
87 & 39.27492 & 0.0381661106218600 & 0.102400000000003 \tabularnewline
88 & 40.2559 & 0.436378906456303 & 1.03050000000000 \tabularnewline
89 & 41.24094 & 0.262605489280025 & 0.660500000000006 \tabularnewline
90 & 41.56386 & 0.290716912132747 & 0.654499999999999 \tabularnewline
91 & 41.5485 & 0.108700275988611 & 0.280000000000001 \tabularnewline
92 & 42.18536 & 0.346158667376682 & 0.884999999999998 \tabularnewline
93 & 42.5818 & 0.276033231695027 & 0.712800000000001 \tabularnewline
94 & 42.56126 & 0.267116047814427 & 0.611799999999995 \tabularnewline
95 & 43.1798 & 0.23092060323843 & 0.615000000000002 \tabularnewline
96 & 42.25398 & 0.283607179034666 & 0.779700000000005 \tabularnewline
97 & 42.38106 & 0.0620769119721652 & 0.145699999999998 \tabularnewline
98 & 41.6929 & 0.418318419388868 & 1.14650000000000 \tabularnewline
\hline
\end{tabular}
%Source: https://freestatistics.org/blog/index.php?pk=111704&T=1

[TABLE]
[ROW][C]Standard Deviation-Mean Plot[/C][/ROW]
[ROW][C]Section[/C][C]Mean[/C][C]Standard Deviation[/C][C]Range[/C][/ROW]
[ROW][C]1[/C][C]40.12722[/C][C]1.01342491927128[/C][C]2.5841[/C][/ROW]
[ROW][C]2[/C][C]41.74046[/C][C]0.343168039012961[/C][C]0.877900000000004[/C][/ROW]
[ROW][C]3[/C][C]42.93102[/C][C]0.526602598740265[/C][C]1.23110000000000[/C][/ROW]
[ROW][C]4[/C][C]43.82822[/C][C]1.39656166960145[/C][C]3.4318[/C][/ROW]
[ROW][C]5[/C][C]46.3125[/C][C]0.351752576394261[/C][C]0.842500000000001[/C][/ROW]
[ROW][C]6[/C][C]45.94872[/C][C]0.86850904543361[/C][C]2.10540000000000[/C][/ROW]
[ROW][C]7[/C][C]45.25424[/C][C]0.548552807849892[/C][C]1.31630000000000[/C][/ROW]
[ROW][C]8[/C][C]45.76838[/C][C]0.213714522201932[/C][C]0.485500000000002[/C][/ROW]
[ROW][C]9[/C][C]45.43032[/C][C]0.279349515839924[/C][C]0.708199999999998[/C][/ROW]
[ROW][C]10[/C][C]44.92034[/C][C]0.226911641393736[/C][C]0.523999999999994[/C][/ROW]
[ROW][C]11[/C][C]45.0901[/C][C]0.379673939058239[/C][C]0.924999999999997[/C][/ROW]
[ROW][C]12[/C][C]45.3585[/C][C]0.112374930478286[/C][C]0.280499999999996[/C][/ROW]
[ROW][C]13[/C][C]44.8809[/C][C]0.097100823889398[/C][C]0.262799999999999[/C][/ROW]
[ROW][C]14[/C][C]44.64444[/C][C]0.157172319445887[/C][C]0.346699999999998[/C][/ROW]
[ROW][C]15[/C][C]43.98782[/C][C]0.255370117672369[/C][C]0.638199999999998[/C][/ROW]
[ROW][C]16[/C][C]43.98664[/C][C]0.117978061519929[/C][C]0.315700000000000[/C][/ROW]
[ROW][C]17[/C][C]43.8234[/C][C]0.126050287583964[/C][C]0.272500000000001[/C][/ROW]
[ROW][C]18[/C][C]43.74592[/C][C]0.135425281982354[/C][C]0.295500000000004[/C][/ROW]
[ROW][C]19[/C][C]43.50362[/C][C]0.164224106025880[/C][C]0.378099999999996[/C][/ROW]
[ROW][C]20[/C][C]43.46206[/C][C]0.105406939999224[/C][C]0.270299999999999[/C][/ROW]
[ROW][C]21[/C][C]43.44772[/C][C]0.104483213962819[/C][C]0.265000000000001[/C][/ROW]
[ROW][C]22[/C][C]43.57388[/C][C]0.0611432089442456[/C][C]0.140699999999995[/C][/ROW]
[ROW][C]23[/C][C]43.36118[/C][C]0.158046882284972[/C][C]0.369[/C][/ROW]
[ROW][C]24[/C][C]43.50386[/C][C]0.242388011254683[/C][C]0.606000000000002[/C][/ROW]
[ROW][C]25[/C][C]43.78538[/C][C]0.139616159523173[/C][C]0.341000000000001[/C][/ROW]
[ROW][C]26[/C][C]43.86982[/C][C]0.114427037888779[/C][C]0.274799999999999[/C][/ROW]
[ROW][C]27[/C][C]45.0249[/C][C]0.70376597672806[/C][C]1.765[/C][/ROW]
[ROW][C]28[/C][C]44.54592[/C][C]0.462245072445344[/C][C]0.955100000000002[/C][/ROW]
[ROW][C]29[/C][C]44.0922[/C][C]0.226226225270193[/C][C]0.517499999999998[/C][/ROW]
[ROW][C]30[/C][C]44.5103[/C][C]0.224176716007707[/C][C]0.625[/C][/ROW]
[ROW][C]31[/C][C]45.21262[/C][C]0.379760479776398[/C][C]0.874400000000001[/C][/ROW]
[ROW][C]32[/C][C]45.4414[/C][C]0.399843469372706[/C][C]0.985000000000007[/C][/ROW]
[ROW][C]33[/C][C]45.12938[/C][C]0.176941436639358[/C][C]0.450099999999999[/C][/ROW]
[ROW][C]34[/C][C]45.30092[/C][C]0.249225965741935[/C][C]0.637[/C][/ROW]
[ROW][C]35[/C][C]45.26668[/C][C]0.139517192488955[/C][C]0.291600000000003[/C][/ROW]
[ROW][C]36[/C][C]44.99462[/C][C]0.155694836137878[/C][C]0.398500000000006[/C][/ROW]
[ROW][C]37[/C][C]44.62458[/C][C]0.173039394358627[/C][C]0.427100000000003[/C][/ROW]
[ROW][C]38[/C][C]44.15918[/C][C]0.194474193660752[/C][C]0.525599999999997[/C][/ROW]
[ROW][C]39[/C][C]43.89526[/C][C]0.0981817600168177[/C][C]0.250599999999999[/C][/ROW]
[ROW][C]40[/C][C]43.70722[/C][C]0.111230625279191[/C][C]0.299999999999997[/C][/ROW]
[ROW][C]41[/C][C]43.73062[/C][C]0.0675053479362911[/C][C]0.182599999999994[/C][/ROW]
[ROW][C]42[/C][C]43.4974[/C][C]0.110854296263159[/C][C]0.231500000000004[/C][/ROW]
[ROW][C]43[/C][C]43.1261[/C][C]0.0956401327895363[/C][C]0.225999999999999[/C][/ROW]
[ROW][C]44[/C][C]43.12716[/C][C]0.0921451192413367[/C][C]0.226700000000001[/C][/ROW]
[ROW][C]45[/C][C]42.95376[/C][C]0.103973135953475[/C][C]0.280499999999996[/C][/ROW]
[ROW][C]46[/C][C]43.0443[/C][C]0.113046273711254[/C][C]0.2577[/C][/ROW]
[ROW][C]47[/C][C]43.79158[/C][C]0.206421975574306[/C][C]0.529999999999994[/C][/ROW]
[ROW][C]48[/C][C]44.30164[/C][C]0.432317531451131[/C][C]1.04[/C][/ROW]
[ROW][C]49[/C][C]44.42894[/C][C]0.421978841886651[/C][C]0.901200000000003[/C][/ROW]
[ROW][C]50[/C][C]43.92952[/C][C]0.235748227989099[/C][C]0.5869[/C][/ROW]
[ROW][C]51[/C][C]43.09346[/C][C]0.349838602787056[/C][C]0.789999999999999[/C][/ROW]
[ROW][C]52[/C][C]42.9763[/C][C]0.237336154009456[/C][C]0.542499999999997[/C][/ROW]
[ROW][C]53[/C][C]42.70778[/C][C]0.200714578444117[/C][C]0.539999999999999[/C][/ROW]
[ROW][C]54[/C][C]42.25776[/C][C]0.303126480202569[/C][C]0.676199999999994[/C][/ROW]
[ROW][C]55[/C][C]42.52038[/C][C]0.211694525200817[/C][C]0.552099999999996[/C][/ROW]
[ROW][C]56[/C][C]42.0367[/C][C]0.270623262119131[/C][C]0.655000000000001[/C][/ROW]
[ROW][C]57[/C][C]41.6316[/C][C]0.160696297406009[/C][C]0.391000000000005[/C][/ROW]
[ROW][C]58[/C][C]41.07754[/C][C]0.148847599913468[/C][C]0.366[/C][/ROW]
[ROW][C]59[/C][C]40.714[/C][C]0.110038629580705[/C][C]0.262999999999998[/C][/ROW]
[ROW][C]60[/C][C]40.63842[/C][C]0.099697577703775[/C][C]0.216000000000001[/C][/ROW]
[ROW][C]61[/C][C]40.4127[/C][C]0.157336661334859[/C][C]0.371500000000005[/C][/ROW]
[ROW][C]62[/C][C]40.18062[/C][C]0.145367197125072[/C][C]0.355499999999999[/C][/ROW]
[ROW][C]63[/C][C]39.73466[/C][C]0.176119641153395[/C][C]0.412500000000001[/C][/ROW]
[ROW][C]64[/C][C]39.6601[/C][C]0.108580269846783[/C][C]0.289500000000004[/C][/ROW]
[ROW][C]65[/C][C]39.23766[/C][C]0.100055199764928[/C][C]0.251099999999994[/C][/ROW]
[ROW][C]66[/C][C]39.3759[/C][C]0.109799476319333[/C][C]0.234999999999999[/C][/ROW]
[ROW][C]67[/C][C]38.95914[/C][C]0.183024378157665[/C][C]0.483499999999999[/C][/ROW]
[ROW][C]68[/C][C]38.79744[/C][C]0.0323951076553235[/C][C]0.0812999999999988[/C][/ROW]
[ROW][C]69[/C][C]38.68662[/C][C]0.184017450259480[/C][C]0.387000000000000[/C][/ROW]
[ROW][C]70[/C][C]37.89804[/C][C]0.310675204997117[/C][C]0.758000000000003[/C][/ROW]
[ROW][C]71[/C][C]38.28758[/C][C]0.591900652136826[/C][C]1.44290000000000[/C][/ROW]
[ROW][C]72[/C][C]38.1085[/C][C]0.286782583153162[/C][C]0.710000000000001[/C][/ROW]
[ROW][C]73[/C][C]37.95776[/C][C]0.124670317237105[/C][C]0.318000000000005[/C][/ROW]
[ROW][C]74[/C][C]38.13634[/C][C]0.168261486977857[/C][C]0.423999999999999[/C][/ROW]
[ROW][C]75[/C][C]38.3131[/C][C]0.136839504529940[/C][C]0.342499999999994[/C][/ROW]
[ROW][C]76[/C][C]38.17328[/C][C]0.134517162473790[/C][C]0.302500000000002[/C][/ROW]
[ROW][C]77[/C][C]38.62236[/C][C]0.43094049821292[/C][C]0.950099999999999[/C][/ROW]
[ROW][C]78[/C][C]39.03716[/C][C]0.158797443304356[/C][C]0.383800000000001[/C][/ROW]
[ROW][C]79[/C][C]39.14092[/C][C]0.369592298350493[/C][C]0.8185[/C][/ROW]
[ROW][C]80[/C][C]39.15734[/C][C]0.0855640286569063[/C][C]0.235799999999998[/C][/ROW]
[ROW][C]81[/C][C]39.39024[/C][C]0.0633032621592299[/C][C]0.154400000000003[/C][/ROW]
[ROW][C]82[/C][C]39.40022[/C][C]0.137493607124113[/C][C]0.338999999999999[/C][/ROW]
[ROW][C]83[/C][C]39.25644[/C][C]0.156470182462984[/C][C]0.353999999999999[/C][/ROW]
[ROW][C]84[/C][C]39.0399[/C][C]0.115549686282571[/C][C]0.248400000000004[/C][/ROW]
[ROW][C]85[/C][C]39.03162[/C][C]0.0496847260231951[/C][C]0.1235[/C][/ROW]
[ROW][C]86[/C][C]39.33416[/C][C]0.132234443319431[/C][C]0.335999999999999[/C][/ROW]
[ROW][C]87[/C][C]39.27492[/C][C]0.0381661106218600[/C][C]0.102400000000003[/C][/ROW]
[ROW][C]88[/C][C]40.2559[/C][C]0.436378906456303[/C][C]1.03050000000000[/C][/ROW]
[ROW][C]89[/C][C]41.24094[/C][C]0.262605489280025[/C][C]0.660500000000006[/C][/ROW]
[ROW][C]90[/C][C]41.56386[/C][C]0.290716912132747[/C][C]0.654499999999999[/C][/ROW]
[ROW][C]91[/C][C]41.5485[/C][C]0.108700275988611[/C][C]0.280000000000001[/C][/ROW]
[ROW][C]92[/C][C]42.18536[/C][C]0.346158667376682[/C][C]0.884999999999998[/C][/ROW]
[ROW][C]93[/C][C]42.5818[/C][C]0.276033231695027[/C][C]0.712800000000001[/C][/ROW]
[ROW][C]94[/C][C]42.56126[/C][C]0.267116047814427[/C][C]0.611799999999995[/C][/ROW]
[ROW][C]95[/C][C]43.1798[/C][C]0.23092060323843[/C][C]0.615000000000002[/C][/ROW]
[ROW][C]96[/C][C]42.25398[/C][C]0.283607179034666[/C][C]0.779700000000005[/C][/ROW]
[ROW][C]97[/C][C]42.38106[/C][C]0.0620769119721652[/C][C]0.145699999999998[/C][/ROW]
[ROW][C]98[/C][C]41.6929[/C][C]0.418318419388868[/C][C]1.14650000000000[/C][/ROW]
[/TABLE]
Source: https://freestatistics.org/blog/index.php?pk=111704&T=1

Globally Unique Identifier (entire table): ba.freestatistics.org/blog/index.php?pk=111704&T=1

As an alternative you can also use a QR Code:  

The GUIDs for individual cells are displayed in the table below:

Standard Deviation-Mean Plot
SectionMeanStandard DeviationRange
140.127221.013424919271282.5841
241.740460.3431680390129610.877900000000004
342.931020.5266025987402651.23110000000000
443.828221.396561669601453.4318
546.31250.3517525763942610.842500000000001
645.948720.868509045433612.10540000000000
745.254240.5485528078498921.31630000000000
845.768380.2137145222019320.485500000000002
945.430320.2793495158399240.708199999999998
1044.920340.2269116413937360.523999999999994
1145.09010.3796739390582390.924999999999997
1245.35850.1123749304782860.280499999999996
1344.88090.0971008238893980.262799999999999
1444.644440.1571723194458870.346699999999998
1543.987820.2553701176723690.638199999999998
1643.986640.1179780615199290.315700000000000
1743.82340.1260502875839640.272500000000001
1843.745920.1354252819823540.295500000000004
1943.503620.1642241060258800.378099999999996
2043.462060.1054069399992240.270299999999999
2143.447720.1044832139628190.265000000000001
2243.573880.06114320894424560.140699999999995
2343.361180.1580468822849720.369
2443.503860.2423880112546830.606000000000002
2543.785380.1396161595231730.341000000000001
2643.869820.1144270378887790.274799999999999
2745.02490.703765976728061.765
2844.545920.4622450724453440.955100000000002
2944.09220.2262262252701930.517499999999998
3044.51030.2241767160077070.625
3145.212620.3797604797763980.874400000000001
3245.44140.3998434693727060.985000000000007
3345.129380.1769414366393580.450099999999999
3445.300920.2492259657419350.637
3545.266680.1395171924889550.291600000000003
3644.994620.1556948361378780.398500000000006
3744.624580.1730393943586270.427100000000003
3844.159180.1944741936607520.525599999999997
3943.895260.09818176001681770.250599999999999
4043.707220.1112306252791910.299999999999997
4143.730620.06750534793629110.182599999999994
4243.49740.1108542962631590.231500000000004
4343.12610.09564013278953630.225999999999999
4443.127160.09214511924133670.226700000000001
4542.953760.1039731359534750.280499999999996
4643.04430.1130462737112540.2577
4743.791580.2064219755743060.529999999999994
4844.301640.4323175314511311.04
4944.428940.4219788418866510.901200000000003
5043.929520.2357482279890990.5869
5143.093460.3498386027870560.789999999999999
5242.97630.2373361540094560.542499999999997
5342.707780.2007145784441170.539999999999999
5442.257760.3031264802025690.676199999999994
5542.520380.2116945252008170.552099999999996
5642.03670.2706232621191310.655000000000001
5741.63160.1606962974060090.391000000000005
5841.077540.1488475999134680.366
5940.7140.1100386295807050.262999999999998
6040.638420.0996975777037750.216000000000001
6140.41270.1573366613348590.371500000000005
6240.180620.1453671971250720.355499999999999
6339.734660.1761196411533950.412500000000001
6439.66010.1085802698467830.289500000000004
6539.237660.1000551997649280.251099999999994
6639.37590.1097994763193330.234999999999999
6738.959140.1830243781576650.483499999999999
6838.797440.03239510765532350.0812999999999988
6938.686620.1840174502594800.387000000000000
7037.898040.3106752049971170.758000000000003
7138.287580.5919006521368261.44290000000000
7238.10850.2867825831531620.710000000000001
7337.957760.1246703172371050.318000000000005
7438.136340.1682614869778570.423999999999999
7538.31310.1368395045299400.342499999999994
7638.173280.1345171624737900.302500000000002
7738.622360.430940498212920.950099999999999
7839.037160.1587974433043560.383800000000001
7939.140920.3695922983504930.8185
8039.157340.08556402865690630.235799999999998
8139.390240.06330326215922990.154400000000003
8239.400220.1374936071241130.338999999999999
8339.256440.1564701824629840.353999999999999
8439.03990.1155496862825710.248400000000004
8539.031620.04968472602319510.1235
8639.334160.1322344433194310.335999999999999
8739.274920.03816611062186000.102400000000003
8840.25590.4363789064563031.03050000000000
8941.240940.2626054892800250.660500000000006
9041.563860.2907169121327470.654499999999999
9141.54850.1087002759886110.280000000000001
9242.185360.3461586673766820.884999999999998
9342.58180.2760332316950270.712800000000001
9442.561260.2671160478144270.611799999999995
9543.17980.230920603238430.615000000000002
9642.253980.2836071790346660.779700000000005
9742.381060.06207691197216520.145699999999998
9841.69290.4183184193888681.14650000000000


Regression: S.E.(k) = alpha + beta * Mean(k)
alpha-0.388060213957644
beta0.0148742742195947
S.D.0.0085834395887362
T-STAT1.73290369971425
p-value0.0863239046359169

\begin{tabular}{lllllllll}
\hline
Regression: S.E.(k) = alpha + beta * Mean(k) \tabularnewline
alpha & -0.388060213957644 \tabularnewline
beta & 0.0148742742195947 \tabularnewline
S.D. & 0.0085834395887362 \tabularnewline
T-STAT & 1.73290369971425 \tabularnewline
p-value & 0.0863239046359169 \tabularnewline
\hline
\end{tabular}
%Source: https://freestatistics.org/blog/index.php?pk=111704&T=2

[TABLE]
[ROW][C]Regression: S.E.(k) = alpha + beta * Mean(k)[/C][/ROW]
[ROW][C]alpha[/C][C]-0.388060213957644[/C][/ROW]
[ROW][C]beta[/C][C]0.0148742742195947[/C][/ROW]
[ROW][C]S.D.[/C][C]0.0085834395887362[/C][/ROW]
[ROW][C]T-STAT[/C][C]1.73290369971425[/C][/ROW]
[ROW][C]p-value[/C][C]0.0863239046359169[/C][/ROW]
[/TABLE]
Source: https://freestatistics.org/blog/index.php?pk=111704&T=2

Globally Unique Identifier (entire table): ba.freestatistics.org/blog/index.php?pk=111704&T=2

As an alternative you can also use a QR Code:  

The GUIDs for individual cells are displayed in the table below:

Regression: S.E.(k) = alpha + beta * Mean(k)
alpha-0.388060213957644
beta0.0148742742195947
S.D.0.0085834395887362
T-STAT1.73290369971425
p-value0.0863239046359169


Regression: ln S.E.(k) = alpha + beta * ln Mean(k)
alpha-12.0961543921023
beta2.78611752886801
S.D.1.18221991665320
T-STAT2.3566829568862
p-value0.0204704805611829
Lambda-1.78611752886801

\begin{tabular}{lllllllll}
\hline
Regression: ln S.E.(k) = alpha + beta * ln Mean(k) \tabularnewline
alpha & -12.0961543921023 \tabularnewline
beta & 2.78611752886801 \tabularnewline
S.D. & 1.18221991665320 \tabularnewline
T-STAT & 2.3566829568862 \tabularnewline
p-value & 0.0204704805611829 \tabularnewline
Lambda & -1.78611752886801 \tabularnewline
\hline
\end{tabular}
%Source: https://freestatistics.org/blog/index.php?pk=111704&T=3

[TABLE]
[ROW][C]Regression: ln S.E.(k) = alpha + beta * ln Mean(k)[/C][/ROW]
[ROW][C]alpha[/C][C]-12.0961543921023[/C][/ROW]
[ROW][C]beta[/C][C]2.78611752886801[/C][/ROW]
[ROW][C]S.D.[/C][C]1.18221991665320[/C][/ROW]
[ROW][C]T-STAT[/C][C]2.3566829568862[/C][/ROW]
[ROW][C]p-value[/C][C]0.0204704805611829[/C][/ROW]
[ROW][C]Lambda[/C][C]-1.78611752886801[/C][/ROW]
[/TABLE]
Source: https://freestatistics.org/blog/index.php?pk=111704&T=3

Globally Unique Identifier (entire table): ba.freestatistics.org/blog/index.php?pk=111704&T=3

As an alternative you can also use a QR Code:  

The GUIDs for individual cells are displayed in the table below:

Regression: ln S.E.(k) = alpha + beta * ln Mean(k)
alpha-12.0961543921023
beta2.78611752886801
S.D.1.18221991665320
T-STAT2.3566829568862
p-value0.0204704805611829
Lambda-1.78611752886801


Parameters (Session):
par1 = 4 ;
Parameters (R input):
par1 = 4 ;
R code (references can be found in the software module):
par1 <- 5
(n <- length(x))
(np <- floor(n / par1))
arr <- array(NA,dim=c(par1,np))
j <- 0
k <- 1
for (i in 1:(np*par1))
{
j = j + 1
arr[j,k] <- x[i]
if (j == par1) {
j = 0
k=k+1
}
}
arr
arr.mean <- array(NA,dim=np)
arr.sd <- array(NA,dim=np)
arr.range <- array(NA,dim=np)
for (j in 1:np)
{
arr.mean[j] <- mean(arr[,j],na.rm=TRUE)
arr.sd[j] <- sd(arr[,j],na.rm=TRUE)
arr.range[j] <- max(arr[,j],na.rm=TRUE) - min(arr[,j],na.rm=TRUE)
}
arr.mean
arr.sd
arr.range
(lm1 <- lm(arr.sd~arr.mean))
(lnlm1 <- lm(log(arr.sd)~log(arr.mean)))
(lm2 <- lm(arr.range~arr.mean))
bitmap(file='test1.png')
plot(arr.mean,arr.sd,main='Standard Deviation-Mean Plot',xlab='mean',ylab='standard deviation')
dev.off()
bitmap(file='test2.png')
plot(arr.mean,arr.range,main='Range-Mean Plot',xlab='mean',ylab='range')
dev.off()
load(file='createtable')
a<-table.start()
a<-table.row.start(a)
a<-table.element(a,'Standard Deviation-Mean Plot',4,TRUE)
a<-table.row.end(a)
a<-table.row.start(a)
a<-table.element(a,'Section',header=TRUE)
a<-table.element(a,'Mean',header=TRUE)
a<-table.element(a,'Standard Deviation',header=TRUE)
a<-table.element(a,'Range',header=TRUE)
a<-table.row.end(a)
for (j in 1:np) {
a<-table.row.start(a)
a<-table.element(a,j,header=TRUE)
a<-table.element(a,arr.mean[j])
a<-table.element(a,arr.sd[j] )
a<-table.element(a,arr.range[j] )
a<-table.row.end(a)
}
a<-table.end(a)
table.save(a,file='mytable.tab')
a<-table.start()
a<-table.row.start(a)
a<-table.element(a,'Regression: S.E.(k) = alpha + beta * Mean(k)',2,TRUE)
a<-table.row.end(a)
a<-table.row.start(a)
a<-table.element(a,'alpha',header=TRUE)
a<-table.element(a,lm1$coefficients[[1]])
a<-table.row.end(a)
a<-table.row.start(a)
a<-table.element(a,'beta',header=TRUE)
a<-table.element(a,lm1$coefficients[[2]])
a<-table.row.end(a)
a<-table.row.start(a)
a<-table.element(a,'S.D.',header=TRUE)
a<-table.element(a,summary(lm1)$coefficients[2,2])
a<-table.row.end(a)
a<-table.row.start(a)
a<-table.element(a,'T-STAT',header=TRUE)
a<-table.element(a,summary(lm1)$coefficients[2,3])
a<-table.row.end(a)
a<-table.row.start(a)
a<-table.element(a,'p-value',header=TRUE)
a<-table.element(a,summary(lm1)$coefficients[2,4])
a<-table.row.end(a)
a<-table.end(a)
table.save(a,file='mytable1.tab')
a<-table.start()
a<-table.row.start(a)
a<-table.element(a,'Regression: ln S.E.(k) = alpha + beta * ln Mean(k)',2,TRUE)
a<-table.row.end(a)
a<-table.row.start(a)
a<-table.element(a,'alpha',header=TRUE)
a<-table.element(a,lnlm1$coefficients[[1]])
a<-table.row.end(a)
a<-table.row.start(a)
a<-table.element(a,'beta',header=TRUE)
a<-table.element(a,lnlm1$coefficients[[2]])
a<-table.row.end(a)
a<-table.row.start(a)
a<-table.element(a,'S.D.',header=TRUE)
a<-table.element(a,summary(lnlm1)$coefficients[2,2])
a<-table.row.end(a)
a<-table.row.start(a)
a<-table.element(a,'T-STAT',header=TRUE)
a<-table.element(a,summary(lnlm1)$coefficients[2,3])
a<-table.row.end(a)
a<-table.row.start(a)
a<-table.element(a,'p-value',header=TRUE)
a<-table.element(a,summary(lnlm1)$coefficients[2,4])
a<-table.row.end(a)
a<-table.row.start(a)
a<-table.element(a,'Lambda',header=TRUE)
a<-table.element(a,1-lnlm1$coefficients[[2]])
a<-table.row.end(a)
a<-table.end(a)
table.save(a,file='mytable2.tab')