Free Statistics

of Irreproducible Research!

Author's title

Author*The author of this computation has been verified*
R Software Modulerwasp_edauni.wasp
Title produced by softwareUnivariate Explorative Data Analysis
Date of computationFri, 17 Dec 2010 12:59:10 +0000
Cite this page as followsStatistical Computations at FreeStatistics.org, Office for Research Development and Education, URL https://freestatistics.org/blog/index.php?v=date/2010/Dec/17/t12925909493pfbmhv8oqbewf3.htm/, Retrieved Mon, 06 May 2024 19:51:40 +0000
Statistical Computations at FreeStatistics.org, Office for Research Development and Education, URL https://freestatistics.org/blog/index.php?pk=111442, Retrieved Mon, 06 May 2024 19:51:40 +0000
QR Codes:

Original text written by user:
IsPrivate?No (this computation is public)
User-defined keywords
Estimated Impact117
Family? (F = Feedback message, R = changed R code, M = changed R Module, P = changed Parameters, D = changed Data)
-       [Univariate Explorative Data Analysis] [] [2010-12-17 12:59:10] [c2e23af56713b360851e64c7775b3f2b] [Current]
Feedback Forum

Post a new message
Dataseries X:
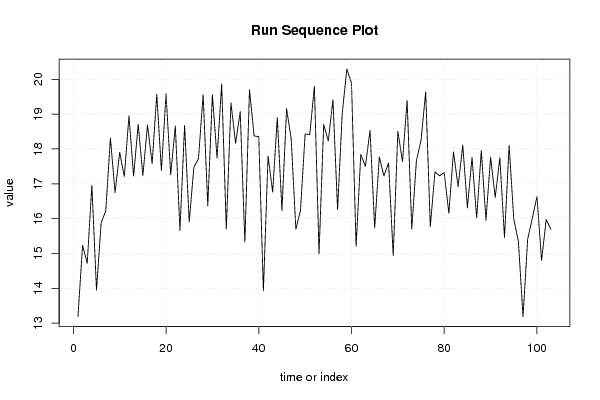
13.193
15.234
14.718
16.961
13.945
15.876
16.226
18.316
16.748
17.904
17.209
18.950
17.225
18.710
17.236
18.687
17.580
19.568
17.381
19.580
17.260
18.661
15.658
18.674
15.908
17.475
17.725
19.562
16.368
19.555
17.743
19.867
15.703
19.324
18.162
19.074
15.323
19.704
18.375
18.352
13.927
17.795
16.761
18.902
16.239
19.158
18.279
15.698
16.239
18.431
18.414
19.801
14.995
18.706
18.232
19.409
16.263
19.017
20.298
19.891
15.203
17.845
17.502
18.532
15.737
17.770
17.224
17.601
14.940
18.507
17.635
19.392
15.699
17.661
18.243
19.643
15.770
17.344
17.229
17.322
16.152
17.919
16.918
18.114
16.308
17.759
16.021
17.952
15.954
17.762
16.610
17.751
15.458
18.106
15.990
15.349
13.185
15.409
16.007
16.633
14.800
15.974
15.693


Summary of computational transaction
Raw Inputview raw input (R code)
Raw Outputview raw output of R engine
Computing time4 seconds
R Server'RServer@AstonUniversity' @ vre.aston.ac.uk

\begin{tabular}{lllllllll}
\hline
Summary of computational transaction \tabularnewline
Raw Input & view raw input (R code)  \tabularnewline
Raw Output & view raw output of R engine  \tabularnewline
Computing time & 4 seconds \tabularnewline
R Server & 'RServer@AstonUniversity' @ vre.aston.ac.uk \tabularnewline
\hline
\end{tabular}
%Source: https://freestatistics.org/blog/index.php?pk=111442&T=0

[TABLE]
[ROW][C]Summary of computational transaction[/C][/ROW]
[ROW][C]Raw Input[/C][C]view raw input (R code) [/C][/ROW]
[ROW][C]Raw Output[/C][C]view raw output of R engine [/C][/ROW]
[ROW][C]Computing time[/C][C]4 seconds[/C][/ROW]
[ROW][C]R Server[/C][C]'RServer@AstonUniversity' @ vre.aston.ac.uk[/C][/ROW]
[/TABLE]
Source: https://freestatistics.org/blog/index.php?pk=111442&T=0

Globally Unique Identifier (entire table): ba.freestatistics.org/blog/index.php?pk=111442&T=0

As an alternative you can also use a QR Code:  

The GUIDs for individual cells are displayed in the table below:

Summary of computational transaction
Raw Inputview raw input (R code)
Raw Outputview raw output of R engine
Computing time4 seconds
R Server'RServer@AstonUniversity' @ vre.aston.ac.uk


Descriptive Statistics
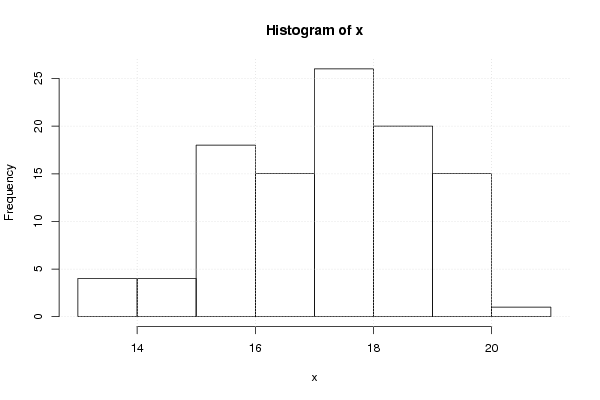
# observations103
minimum13.185
Q115.9985
median17.502
mean17.2893009708738
Q318.4225
maximum20.298

\begin{tabular}{lllllllll}
\hline
Descriptive Statistics \tabularnewline
# observations & 103 \tabularnewline
minimum & 13.185 \tabularnewline
Q1 & 15.9985 \tabularnewline
median & 17.502 \tabularnewline
mean & 17.2893009708738 \tabularnewline
Q3 & 18.4225 \tabularnewline
maximum & 20.298 \tabularnewline
\hline
\end{tabular}
%Source: https://freestatistics.org/blog/index.php?pk=111442&T=1

[TABLE]
[ROW][C]Descriptive Statistics[/C][/ROW]
[ROW][C]# observations[/C][C]103[/C][/ROW]
[ROW][C]minimum[/C][C]13.185[/C][/ROW]
[ROW][C]Q1[/C][C]15.9985[/C][/ROW]
[ROW][C]median[/C][C]17.502[/C][/ROW]
[ROW][C]mean[/C][C]17.2893009708738[/C][/ROW]
[ROW][C]Q3[/C][C]18.4225[/C][/ROW]
[ROW][C]maximum[/C][C]20.298[/C][/ROW]
[/TABLE]
Source: https://freestatistics.org/blog/index.php?pk=111442&T=1

Globally Unique Identifier (entire table): ba.freestatistics.org/blog/index.php?pk=111442&T=1

As an alternative you can also use a QR Code:  

The GUIDs for individual cells are displayed in the table below:

Descriptive Statistics
# observations103
minimum13.185
Q115.9985
median17.502
mean17.2893009708738
Q318.4225
maximum20.298


Parameters (Session):
par1 = 0.01 ; par2 = 0.99 ; par3 = 0.01 ;
Parameters (R input):
par1 = 0 ; par2 = 36 ;
R code (references can be found in the software module):
par1 <- as.numeric(par1)
par2 <- as.numeric(par2)
x <- as.ts(x)
library(lattice)
bitmap(file='pic1.png')
plot(x,type='l',main='Run Sequence Plot',xlab='time or index',ylab='value')
grid()
dev.off()
bitmap(file='pic2.png')
hist(x)
grid()
dev.off()
bitmap(file='pic3.png')
if (par1 > 0)
{
densityplot(~x,col='black',main=paste('Density Plot bw = ',par1),bw=par1)
} else {
densityplot(~x,col='black',main='Density Plot')
}
dev.off()
bitmap(file='pic4.png')
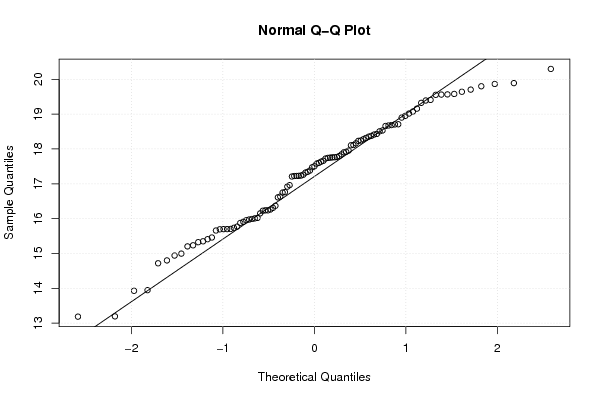
qqnorm(x)
qqline(x)
grid()
dev.off()
if (par2 > 0)
{
bitmap(file='lagplot1.png')
dum <- cbind(lag(x,k=1),x)
dum
dum1 <- dum[2:length(x),]
dum1
z <- as.data.frame(dum1)
z
plot(z,main='Lag plot (k=1), lowess, and regression line')
lines(lowess(z))
abline(lm(z))
dev.off()
if (par2 > 1) {
bitmap(file='lagplotpar2.png')
dum <- cbind(lag(x,k=par2),x)
dum
dum1 <- dum[(par2+1):length(x),]
dum1
z <- as.data.frame(dum1)
z
mylagtitle <- 'Lag plot (k='
mylagtitle <- paste(mylagtitle,par2,sep='')
mylagtitle <- paste(mylagtitle,'), and lowess',sep='')
plot(z,main=mylagtitle)
lines(lowess(z))
dev.off()
}
bitmap(file='pic5.png')
acf(x,lag.max=par2,main='Autocorrelation Function')
grid()
dev.off()
}
summary(x)
load(file='createtable')
a<-table.start()
a<-table.row.start(a)
a<-table.element(a,'Descriptive Statistics',2,TRUE)
a<-table.row.end(a)
a<-table.row.start(a)
a<-table.element(a,'# observations',header=TRUE)
a<-table.element(a,length(x))
a<-table.row.end(a)
a<-table.row.start(a)
a<-table.element(a,'minimum',header=TRUE)
a<-table.element(a,min(x))
a<-table.row.end(a)
a<-table.row.start(a)
a<-table.element(a,'Q1',header=TRUE)
a<-table.element(a,quantile(x,0.25))
a<-table.row.end(a)
a<-table.row.start(a)
a<-table.element(a,'median',header=TRUE)
a<-table.element(a,median(x))
a<-table.row.end(a)
a<-table.row.start(a)
a<-table.element(a,'mean',header=TRUE)
a<-table.element(a,mean(x))
a<-table.row.end(a)
a<-table.row.start(a)
a<-table.element(a,'Q3',header=TRUE)
a<-table.element(a,quantile(x,0.75))
a<-table.row.end(a)
a<-table.row.start(a)
a<-table.element(a,'maximum',header=TRUE)
a<-table.element(a,max(x))
a<-table.row.end(a)
a<-table.end(a)
table.save(a,file='mytable.tab')