| Multiple Linear Regression - Estimated Regression Equation |
| Coffee[t] = -126.644403449146 + 1.11859932108523Tea[t] + 0.375159164294309Sugar[t] + 0.536573708762059Water[t] + 0.322868064613424Soda[t] + 0.115372489905679SaraLee[t] + 0.0139559697604042Starbucks[t] + e[t] |
| Multiple Linear Regression - Ordinary Least Squares | |||||
| Variable | Parameter | S.D. | T-STAT H0: parameter = 0 | 2-tail p-value | 1-tail p-value |
| (Intercept) | -126.644403449146 | 46.441652 | -2.727 | 0.009364 | 0.004682 |
| Tea | 1.11859932108523 | 0.162903 | 6.8667 | 0 | 0 |
| Sugar | 0.375159164294309 | 0.313024 | 1.1985 | 0.237605 | 0.118802 |
| Water | 0.536573708762059 | 0.195769 | 2.7409 | 0.009036 | 0.004518 |
| Soda | 0.322868064613424 | 0.240095 | 1.3448 | 0.186098 | 0.093049 |
| SaraLee | 0.115372489905679 | 0.17171 | 0.6719 | 0.505415 | 0.252707 |
| Starbucks | 0.0139559697604042 | 0.06569 | 0.2125 | 0.832807 | 0.416403 |
| Multiple Linear Regression - Regression Statistics | |
| Multiple R | 0.974260332908292 |
| R-squared | 0.949183196278576 |
| Adjusted R-squared | 0.941746590855928 |
| F-TEST (value) | 127.636622132450 |
| F-TEST (DF numerator) | 6 |
| F-TEST (DF denominator) | 41 |
| p-value | 0 |
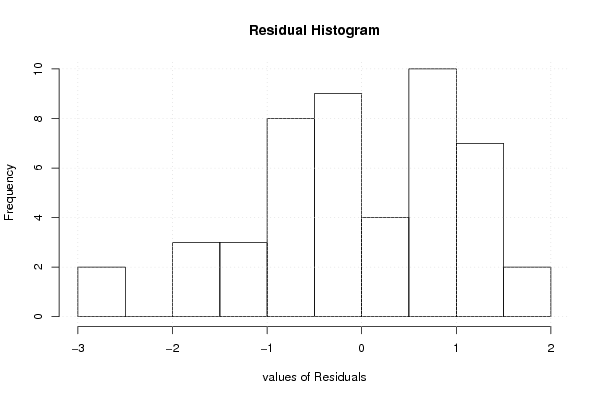
| Multiple Linear Regression - Residual Statistics | |
| Residual Standard Deviation | 1.16191788971606 |
| Sum Squared Residuals | 55.3521804801312 |
| Multiple Linear Regression - Actuals, Interpolation, and Residuals | |||
| Time or Index | Actuals | Interpolation Forecast | Residuals Prediction Error |
| 1 | 108.35 | 111.286568463747 | -2.93656846374714 |
| 2 | 109.87 | 111.371149575270 | -1.50114957527021 |
| 3 | 111.3 | 111.233460581552 | 0.0665394184476699 |
| 4 | 115.5 | 114.080867448028 | 1.41913255197175 |
| 5 | 116.22 | 115.852338716747 | 0.367661283252621 |
| 6 | 116.63 | 115.909385603676 | 0.720614396323876 |
| 7 | 116.84 | 116.106664870891 | 0.733335129109454 |
| 8 | 116.63 | 117.191016943971 | -0.561016943971362 |
| 9 | 117.03 | 117.100996026014 | -0.0709960260141837 |
| 10 | 117 | 116.370205119849 | 0.629794880151317 |
| 11 | 117.14 | 116.697413640241 | 0.442586359758654 |
| 12 | 116.64 | 117.312085255530 | -0.672085255529643 |
| 13 | 117.24 | 118.171531915554 | -0.931531915553823 |
| 14 | 117.52 | 117.732464324328 | -0.212464324328356 |
| 15 | 117.83 | 119.278475908187 | -1.44847590818745 |
| 16 | 119.79 | 118.971387163572 | 0.818612836428159 |
| 17 | 120.86 | 119.915332574445 | 0.944667425554969 |
| 18 | 120.75 | 119.452695360816 | 1.29730463918384 |
| 19 | 120.63 | 119.132030834267 | 1.49796916573295 |
| 20 | 120.89 | 119.658988790938 | 1.23101120906196 |
| 21 | 120.23 | 120.351443866879 | -0.121443866879432 |
| 22 | 121.19 | 120.630049864838 | 0.559950135161718 |
| 23 | 120.79 | 120.060471064039 | 0.729528935960546 |
| 24 | 120.09 | 121.251284854193 | -1.16128485419304 |
| 25 | 120.86 | 121.490990184969 | -0.630990184968984 |
| 26 | 121.1 | 122.661861741368 | -1.56186174136849 |
| 27 | 121.47 | 121.60880218324 | -0.138802183239909 |
| 28 | 122.01 | 123.741377513773 | -1.73137751377329 |
| 29 | 123.94 | 124.649735507669 | -0.709735507669219 |
| 30 | 125.78 | 124.18003899988 | 1.59996100011995 |
| 31 | 125.31 | 125.348127055936 | -0.0381270559364169 |
| 32 | 125.79 | 125.164539476358 | 0.625460523641864 |
| 33 | 126.12 | 125.915584177891 | 0.204415822109054 |
| 34 | 125.57 | 124.239269388141 | 1.33073061185877 |
| 35 | 125.44 | 124.856323932151 | 0.583676067848552 |
| 36 | 126.12 | 124.918260082092 | 1.20173991790849 |
| 37 | 126.01 | 126.055500963984 | -0.0455009639843438 |
| 38 | 126.5 | 126.693104733134 | -0.193104733134405 |
| 39 | 126.13 | 126.458326555763 | -0.328326555763218 |
| 40 | 126.66 | 125.518683911135 | 1.14131608886536 |
| 41 | 126.33 | 126.424091947799 | -0.0940919477993204 |
| 42 | 126.61 | 127.559362280375 | -0.949362280374524 |
| 43 | 126.36 | 127.392999077399 | -1.03299907739879 |
| 44 | 126.83 | 127.38252257839 | -0.552522578390062 |
| 45 | 125.9 | 128.455387995298 | -2.55538799529801 |
| 46 | 126.29 | 126.937758749482 | -0.647758749481735 |
| 47 | 126.37 | 124.533573120258 | 1.83642687974182 |
| 48 | 125.11 | 124.265469075938 | 0.844530924062021 |
| Goldfeld-Quandt test for Heteroskedasticity | |||
| p-values | Alternative Hypothesis | ||
| breakpoint index | greater | 2-sided | less |
| 10 | 0.451120733095265 | 0.902241466190531 | 0.548879266904735 |
| 11 | 0.290688745267803 | 0.581377490535606 | 0.709311254732197 |
| 12 | 0.49145875544314 | 0.98291751088628 | 0.50854124455686 |
| 13 | 0.525244824117871 | 0.949510351764257 | 0.474755175882129 |
| 14 | 0.514807435554273 | 0.970385128891454 | 0.485192564445727 |
| 15 | 0.549949654899034 | 0.900100690201931 | 0.450050345100966 |
| 16 | 0.616089990717905 | 0.76782001856419 | 0.383910009282095 |
| 17 | 0.609444427769704 | 0.781111144460591 | 0.390555572230296 |
| 18 | 0.611066084945323 | 0.777867830109354 | 0.388933915054677 |
| 19 | 0.562397397854417 | 0.875205204291166 | 0.437602602145583 |
| 20 | 0.570320056756084 | 0.859359886487832 | 0.429679943243916 |
| 21 | 0.754254727571139 | 0.491490544857723 | 0.245745272428862 |
| 22 | 0.68668729451542 | 0.62662541096916 | 0.31331270548458 |
| 23 | 0.621057154033502 | 0.757885691932997 | 0.378942845966498 |
| 24 | 0.627720939368242 | 0.744558121263517 | 0.372279060631758 |
| 25 | 0.565239563338128 | 0.869520873323745 | 0.434760436661872 |
| 26 | 0.701502044449329 | 0.596995911101343 | 0.298497955550671 |
| 27 | 0.78556890881833 | 0.42886218236334 | 0.21443109118167 |
| 28 | 0.988219925665133 | 0.0235601486697343 | 0.0117800743348672 |
| 29 | 0.999208643256787 | 0.00158271348642592 | 0.000791356743212961 |
| 30 | 0.999264406155596 | 0.00147118768880873 | 0.000735593844404367 |
| 31 | 0.998610340980862 | 0.00277931803827606 | 0.00138965901913803 |
| 32 | 0.996683464348246 | 0.00663307130350878 | 0.00331653565175439 |
| 33 | 0.992148166731964 | 0.0157036665360726 | 0.00785183326803628 |
| 34 | 0.98375867991465 | 0.0324826401707016 | 0.0162413200853508 |
| 35 | 0.979392827319527 | 0.0412143453609454 | 0.0206071726804727 |
| 36 | 0.95062059568004 | 0.0987588086399194 | 0.0493794043199597 |
| 37 | 0.910283580291431 | 0.179432839417138 | 0.0897164197085688 |
| 38 | 0.820380125767573 | 0.359239748464854 | 0.179619874232427 |
| Meta Analysis of Goldfeld-Quandt test for Heteroskedasticity | |||
| Description | # significant tests | % significant tests | OK/NOK |
| 1% type I error level | 4 | 0.137931034482759 | NOK |
| 5% type I error level | 8 | 0.275862068965517 | NOK |
| 10% type I error level | 9 | 0.310344827586207 | NOK |