| Multiple Linear Regression - Estimated Regression Equation |
| vrijetijdsbesteding[t] = + 35.2689359098687 + 0.0686290527084394bios[t] + 0.349632828334539schouwburg[t] + 0.533715451658278eedagsacttractie[t] -0.279710824870231huurDVD[t] + 0.316008799723908M1[t] + 0.695631656879148M2[t] + 0.734592742605774M3[t] -0.547693856402015M4[t] -0.484995255361616M5[t] -0.147579851748444M6[t] + 0.045631283121235M7[t] + 0.381593475385275M8[t] -0.370011739420981M9[t] -0.13577970566168M10[t] -0.188061168684507M11[t] + e[t] |
| Multiple Linear Regression - Ordinary Least Squares | |||||
| Variable | Parameter | S.D. | T-STAT H0: parameter = 0 | 2-tail p-value | 1-tail p-value |
| (Intercept) | 35.2689359098687 | 14.406688 | 2.4481 | 0.018621 | 0.00931 |
| bios | 0.0686290527084394 | 0.040939 | 1.6764 | 0.101098 | 0.050549 |
| schouwburg | 0.349632828334539 | 0.056553 | 6.1824 | 0 | 0 |
| eedagsacttractie | 0.533715451658278 | 0.091555 | 5.8295 | 1e-06 | 0 |
| huurDVD | -0.279710824870231 | 0.174489 | -1.603 | 0.116423 | 0.058211 |
| M1 | 0.316008799723908 | 0.397969 | 0.7941 | 0.431628 | 0.215814 |
| M2 | 0.695631656879148 | 0.39816 | 1.7471 | 0.087926 | 0.043963 |
| M3 | 0.734592742605774 | 0.398371 | 1.844 | 0.072247 | 0.036123 |
| M4 | -0.547693856402015 | 0.531577 | -1.0303 | 0.308757 | 0.154379 |
| M5 | -0.484995255361616 | 0.531154 | -0.9131 | 0.366404 | 0.183202 |
| M6 | -0.147579851748444 | 0.52955 | -0.2787 | 0.781851 | 0.390925 |
| M7 | 0.045631283121235 | 0.527995 | 0.0864 | 0.93154 | 0.46577 |
| M8 | 0.381593475385275 | 0.522941 | 0.7297 | 0.46962 | 0.23481 |
| M9 | -0.370011739420981 | 0.393307 | -0.9408 | 0.352202 | 0.176101 |
| M10 | -0.13577970566168 | 0.390147 | -0.348 | 0.729562 | 0.364781 |
| M11 | -0.188061168684507 | 0.410028 | -0.4587 | 0.648847 | 0.324423 |
| Multiple Linear Regression - Regression Statistics | |
| Multiple R | 0.99601068857855 |
| R-squared | 0.99203729176272 |
| Adjusted R-squared | 0.989193467392262 |
| F-TEST (value) | 348.839155493686 |
| F-TEST (DF numerator) | 15 |
| F-TEST (DF denominator) | 42 |
| p-value | 0 |
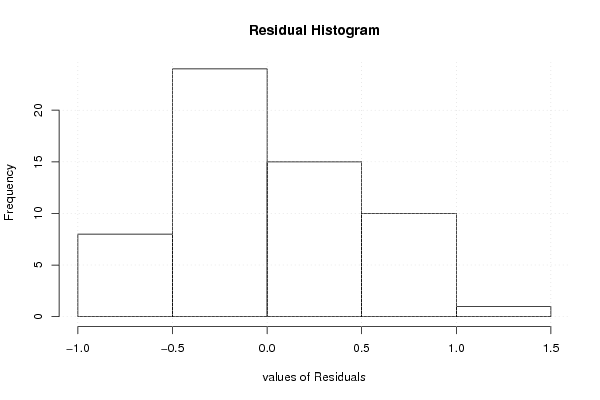
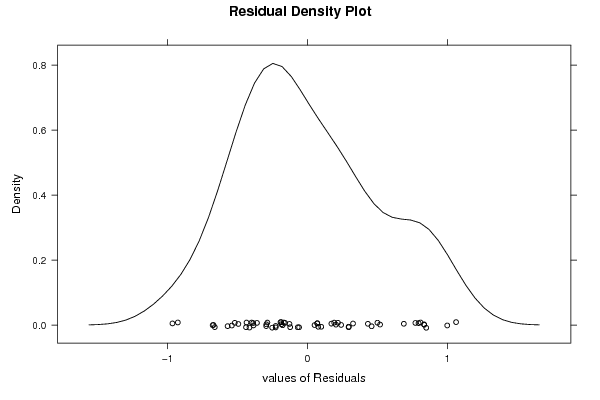
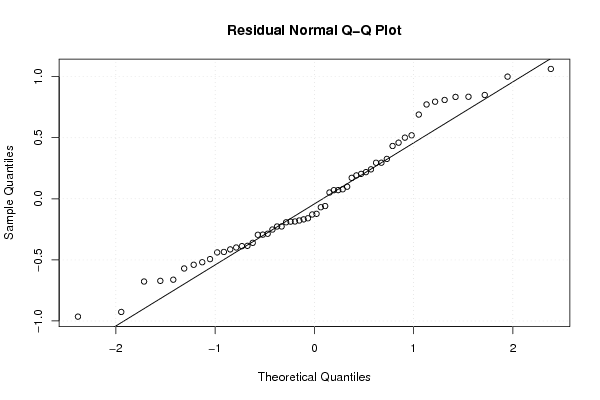
| Multiple Linear Regression - Residual Statistics | |
| Residual Standard Deviation | 0.579534663866987 |
| Sum Squared Residuals | 14.1061379181837 |
| Multiple Linear Regression - Actuals, Interpolation, and Residuals | |||
| Time or Index | Actuals | Interpolation Forecast | Residuals Prediction Error |
| 1 | 101.76 | 102.144994525268 | -0.384994525267722 |
| 2 | 102.37 | 102.498226665551 | -0.128226665551124 |
| 3 | 102.38 | 102.548376184273 | -0.168376184272574 |
| 4 | 102.86 | 102.656019693245 | 0.203980306755325 |
| 5 | 102.87 | 102.651587696316 | 0.218412303683786 |
| 6 | 102.92 | 102.989003099929 | -0.0690030999293898 |
| 7 | 102.95 | 103.176620018302 | -0.22662001830166 |
| 8 | 103.02 | 103.560133050794 | -0.540133050793647 |
| 9 | 104.08 | 104.650393621276 | -0.570393621275765 |
| 10 | 104.16 | 104.822299090756 | -0.662299090755801 |
| 11 | 104.24 | 104.733655220500 | -0.493655220499847 |
| 12 | 104.33 | 104.849262296122 | -0.519262296122256 |
| 13 | 104.73 | 105.168767424130 | -0.438767424129506 |
| 14 | 104.86 | 105.53720184829 | -0.677201848289943 |
| 15 | 105.03 | 105.444179384924 | -0.414179384923909 |
| 16 | 105.62 | 105.549552960228 | 0.0704470397723576 |
| 17 | 105.63 | 105.578686262284 | 0.0513137377163745 |
| 18 | 105.63 | 105.916101665897 | -0.286101665896798 |
| 19 | 105.94 | 106.191667664017 | -0.251667664016602 |
| 20 | 106.61 | 106.510847206788 | 0.0991527932115737 |
| 21 | 107.69 | 107.882212708118 | -0.192212708117599 |
| 22 | 107.78 | 108.140464910325 | -0.36046491032485 |
| 23 | 107.93 | 108.317546323696 | -0.387546323695609 |
| 24 | 108.48 | 108.539235728207 | -0.0592357282072548 |
| 25 | 108.14 | 107.330845396393 | 0.809154603607425 |
| 26 | 108.48 | 107.707671145299 | 0.772328854700892 |
| 27 | 108.48 | 107.685095849554 | 0.794904150445718 |
| 28 | 108.89 | 108.040187117445 | 0.849812882554624 |
| 29 | 108.93 | 108.096022813215 | 0.833977186785076 |
| 30 | 109.21 | 108.374698943605 | 0.835301056394638 |
| 31 | 109.47 | 108.470011289770 | 0.999988710229548 |
| 32 | 109.8 | 108.737002787748 | 1.06299721225181 |
| 33 | 111.73 | 111.210152100104 | 0.51984789989551 |
| 34 | 111.85 | 111.417588838572 | 0.432411161428172 |
| 35 | 112.12 | 111.430504975622 | 0.689495024377992 |
| 36 | 112.15 | 111.649230442762 | 0.500769557238488 |
| 37 | 112.17 | 111.928876835252 | 0.241123164747705 |
| 38 | 112.67 | 112.34365634771 | 0.326343652290066 |
| 39 | 112.8 | 112.340660809706 | 0.459339190293973 |
| 40 | 113.44 | 114.404770092596 | -0.964770092595634 |
| 41 | 113.53 | 114.456280260641 | -0.92628026064122 |
| 42 | 114.53 | 114.824578737973 | -0.29457873797319 |
| 43 | 114.51 | 114.908702651143 | -0.398702651143479 |
| 44 | 115.05 | 115.485085303151 | -0.435085303150866 |
| 45 | 116.67 | 116.598836088135 | 0.0711639118651307 |
| 46 | 117.07 | 116.774980726708 | 0.295019273292036 |
| 47 | 116.92 | 116.728293480183 | 0.191706519817464 |
| 48 | 117 | 116.922271532909 | 0.0777284670910233 |
| 49 | 117.02 | 117.246515818958 | -0.226515818957902 |
| 50 | 117.35 | 117.64324399315 | -0.293243993149891 |
| 51 | 117.36 | 118.031687771543 | -0.671687771543208 |
| 52 | 117.82 | 117.979470136487 | -0.159470136486672 |
| 53 | 117.88 | 118.057422967544 | -0.177422967544017 |
| 54 | 118.24 | 118.425617552595 | -0.18561755259526 |
| 55 | 118.5 | 118.622998376768 | -0.122998376767807 |
| 56 | 118.8 | 118.986931651519 | -0.186931651518871 |
| 57 | 119.76 | 119.588405482367 | 0.171594517632724 |
| 58 | 120.09 | 119.794666433640 | 0.295333566360443 |
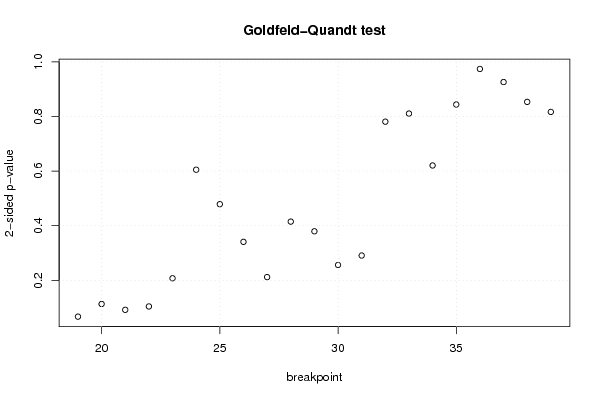
| Goldfeld-Quandt test for Heteroskedasticity | |||
| p-values | Alternative Hypothesis | ||
| breakpoint index | greater | 2-sided | less |
| 19 | 0.0333304328523004 | 0.0666608657046009 | 0.9666695671477 |
| 20 | 0.0565366688518876 | 0.113073337703775 | 0.943463331148112 |
| 21 | 0.0458266069010975 | 0.091653213802195 | 0.954173393098902 |
| 22 | 0.0520464973896608 | 0.104092994779322 | 0.94795350261034 |
| 23 | 0.103622472471212 | 0.207244944942424 | 0.896377527528788 |
| 24 | 0.302459205299881 | 0.604918410599762 | 0.697540794700119 |
| 25 | 0.239374227585357 | 0.478748455170714 | 0.760625772414643 |
| 26 | 0.170378287574510 | 0.340756575149019 | 0.82962171242549 |
| 27 | 0.105809059415743 | 0.211618118831487 | 0.894190940584257 |
| 28 | 0.207439272472346 | 0.414878544944693 | 0.792560727527654 |
| 29 | 0.189699787574926 | 0.379399575149851 | 0.810300212425074 |
| 30 | 0.127967688722201 | 0.255935377444402 | 0.8720323112778 |
| 31 | 0.145294584121482 | 0.290589168242964 | 0.854705415878518 |
| 32 | 0.609501014550346 | 0.780997970899309 | 0.390498985449654 |
| 33 | 0.594599409179392 | 0.810801181641216 | 0.405400590820608 |
| 34 | 0.689710410412257 | 0.620579179175485 | 0.310289589587743 |
| 35 | 0.578061433307055 | 0.84387713338589 | 0.421938566692945 |
| 36 | 0.487109584288505 | 0.97421916857701 | 0.512890415711495 |
| 37 | 0.463116476722374 | 0.926232953444748 | 0.536883523277626 |
| 38 | 0.426808221779824 | 0.853616443559648 | 0.573191778220176 |
| 39 | 0.408366854632799 | 0.816733709265597 | 0.591633145367201 |
| Meta Analysis of Goldfeld-Quandt test for Heteroskedasticity | |||
| Description | # significant tests | % significant tests | OK/NOK |
| 1% type I error level | 0 | 0 | OK |
| 5% type I error level | 0 | 0 | OK |
| 10% type I error level | 2 | 0.0952380952380952 | OK |