Free Statistics

of Irreproducible Research!

Author's title

Author*The author of this computation has been verified*
R Software Modulerwasp_summary1.wasp
Title produced by softwareUnivariate Summary Statistics
Date of computationFri, 17 Dec 2010 09:54:35 +0000
Cite this page as followsStatistical Computations at FreeStatistics.org, Office for Research Development and Education, URL https://freestatistics.org/blog/index.php?v=date/2010/Dec/17/t1292579794adetxl8ea441ypc.htm/, Retrieved Tue, 07 May 2024 02:06:11 +0000
Statistical Computations at FreeStatistics.org, Office for Research Development and Education, URL https://freestatistics.org/blog/index.php?pk=111366, Retrieved Tue, 07 May 2024 02:06:11 +0000
QR Codes:

Original text written by user:
IsPrivate?No (this computation is public)
User-defined keywords
Estimated Impact155
Family? (F = Feedback message, R = changed R code, M = changed R Module, P = changed Parameters, D = changed Data)
-     [Univariate Explorative Data Analysis] [Run Sequence gebo...] [2008-12-12 13:32:37] [76963dc1903f0f612b6153510a3818cf]
- R  D  [Univariate Explorative Data Analysis] [Run Sequence gebo...] [2008-12-17 12:14:40] [76963dc1903f0f612b6153510a3818cf]
-         [Univariate Explorative Data Analysis] [Run Sequence Plot...] [2008-12-22 18:19:51] [1ce0d16c8f4225c977b42c8fa93bc163]
- RMP       [Univariate Data Series] [Identifying Integ...] [2009-11-22 12:08:06] [b98453cac15ba1066b407e146608df68]
- RMP         [(Partial) Autocorrelation Function] [Births] [2010-11-29 09:36:27] [b98453cac15ba1066b407e146608df68]
- RMPD            [Univariate Summary Statistics] [Analyse kijkcijfe...] [2010-12-17 09:54:35] [0605ea080d54454c99180f574351b8e4] [Current]
Feedback Forum

Post a new message
Dataseries X:
15561600
14917500
14805920
16958000
17605000
17131200
18474600
17286700
18574400
18056000
19701600
19061700
19681900
34521200
19922700
20177900
19759900
23076700
22532000
22029400
22587000
23256600
22680300
21916400
19640200
18813100
18730000
18154700
17848800
18077500
17133100
16602600
15878900
15789100
15422000
14661400
15879200
14339300
13169600
14528900
13375800
12309900
11933900
10061900
12609600
11156500
12187200
11284300
10177000
10970720
10820680
11492390
14573750
13992820
14727070
15685360
16736210
17950180
17002730
17415160
17929810
17865790
19202360
19085000
18188880
18466410
18520400
20025500
20636100
20672000
22589100
21864800
22750100
22548746
21325495
21556563
21415269
20401054
19062253
19085706
19279967
18552045
17800733
17142490
17593173
17633859
17336613
17008347
17951965
14520929
16941217
15436824
14744261
14248004
11540953
12881661
15185757
13554339
13575106
12238400
13303614
14151478
14172009
14022320


Summary of computational transaction
Raw Inputview raw input (R code)
Raw Outputview raw output of R engine
Computing time4 seconds
R Server'RServer@AstonUniversity' @ vre.aston.ac.uk

\begin{tabular}{lllllllll}
\hline
Summary of computational transaction \tabularnewline
Raw Input & view raw input (R code)  \tabularnewline
Raw Output & view raw output of R engine  \tabularnewline
Computing time & 4 seconds \tabularnewline
R Server & 'RServer@AstonUniversity' @ vre.aston.ac.uk \tabularnewline
\hline
\end{tabular}
%Source: https://freestatistics.org/blog/index.php?pk=111366&T=0

[TABLE]
[ROW][C]Summary of computational transaction[/C][/ROW]
[ROW][C]Raw Input[/C][C]view raw input (R code) [/C][/ROW]
[ROW][C]Raw Output[/C][C]view raw output of R engine [/C][/ROW]
[ROW][C]Computing time[/C][C]4 seconds[/C][/ROW]
[ROW][C]R Server[/C][C]'RServer@AstonUniversity' @ vre.aston.ac.uk[/C][/ROW]
[/TABLE]
Source: https://freestatistics.org/blog/index.php?pk=111366&T=0

Globally Unique Identifier (entire table): ba.freestatistics.org/blog/index.php?pk=111366&T=0

As an alternative you can also use a QR Code:  

The GUIDs for individual cells are displayed in the table below:

Summary of computational transaction
Raw Inputview raw input (R code)
Raw Outputview raw output of R engine
Computing time4 seconds
R Server'RServer@AstonUniversity' @ vre.aston.ac.uk


Central Tendency - Ungrouped Data
MeasureValueS.E.Value/S.E.
Arithmetic Mean17167453.75368154.04448744446.6311697699833
Geometric Mean16771879.6454805
Harmonic Mean16378027.4789571
Quadratic Mean17569343.2007874
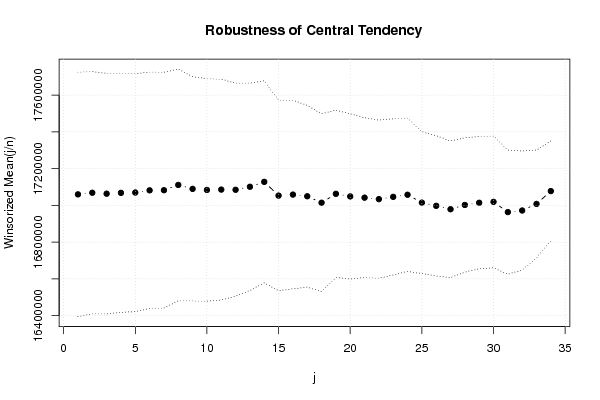
Winsorized Mean ( 1 / 34 )17060247.0192308332599.02744880751.2937369363074
Winsorized Mean ( 2 / 34 )17069165.8653846329596.78571912251.7880228356678
Winsorized Mean ( 3 / 34 )17064072.7884615327178.62719483952.1552184956742
Winsorized Mean ( 4 / 34 )17068533.5576923325451.28694643552.4457399380374
Winsorized Mean ( 5 / 34 )17070293.1730769323646.26170126552.7436747866202
Winsorized Mean ( 6 / 34 )17082177.2115385321571.18816813453.12098172989
Winsorized Mean ( 7 / 34 )17082871.0865385320594.01736503253.2850588633653
Winsorized Mean ( 8 / 34 )17111809.625315433.83760340654.2484907612056
Winsorized Mean ( 9 / 34 )17090235.5865385304923.95491218856.0475335283516
Winsorized Mean ( 10 / 34 )17084293.2788462302459.72751236956.4845224829065
Winsorized Mean ( 11 / 34 )17086398.0865385300443.26158109956.8706317346589
Winsorized Mean ( 12 / 34 )17085413.0480769289768.80613899758.9622232832107
Winsorized Mean ( 13 / 34 )17101758.9230769282114.3167650260.6199611532705
Winsorized Mean ( 14 / 34 )17128434.9807692274794.5489859362.3317858522959
Winsorized Mean ( 15 / 34 )17053509.8365385258676.45554320565.9260225316104
Winsorized Mean ( 16 / 34 )17059092.2980769256371.25208529666.540581907371
Winsorized Mean ( 17 / 34 )17049855.5769231247199.92793135468.9719277817011
Winsorized Mean ( 18 / 34 )17014827.0576923241708.66591197770.3939471656702
Winsorized Mean ( 19 / 34 )17063297.8846154227912.04388680474.8679077841543
Winsorized Mean ( 20 / 34 )17049201.7307692224695.34015464475.876970652953
Winsorized Mean ( 21 / 34 )17042408.6346154217267.54370409678.4397353790955
Winsorized Mean ( 22 / 34 )17034419.0384615215215.83865966179.1503968506681
Winsorized Mean ( 23 / 34 )17046868.8942308212531.94563063980.2085015673674
Winsorized Mean ( 24 / 34 )17058314.125208695.37210228481.7378648753147
Winsorized Mean ( 25 / 34 )17015380.4711538193052.51624643988.1386101667435
Winsorized Mean ( 26 / 34 )16997971.4711538190608.07722946189.177603164692
Winsorized Mean ( 27 / 34 )16979330.0480769185776.42779514891.3965794777779
Winsorized Mean ( 28 / 34 )17002738.0480769182804.80475352493.0103454939367
Winsorized Mean ( 29 / 34 )17014706.9615385179834.13204862494.6133348976156
Winsorized Mean ( 30 / 34 )17019506.3846154179204.63401174694.972468086399
Winsorized Mean ( 31 / 34 )16963783.5865385168889.230860071100.443252066163
Winsorized Mean ( 32 / 34 )16972546.6634615161938.100600853104.808853509377
Winsorized Mean ( 33 / 34 )17008293.5961538146377.368165416116.194831272915
Winsorized Mean ( 34 / 34 )17078218.5192308136389.638705397125.216392398545
Trimmed Mean ( 1 / 34 )17066981.2745098326647.01013186152.2490050272317
Trimmed Mean ( 2 / 34 )17073984.9319945.930182753.365219836521
Trimmed Mean ( 3 / 34 )17076541.9387755314171.95542422554.3541256434463
Trimmed Mean ( 4 / 34 )17081044.6875308648.7461058255.3413707426622
Trimmed Mean ( 5 / 34 )17084505.212766302954.84995415656.3929087629765
Trimmed Mean ( 6 / 34 )17087718.3695652296985.01148304757.5373089848362
Trimmed Mean ( 7 / 34 )17088785.5555556290692.3398516358.786501096925
Trimmed Mean ( 8 / 34 )17089784.1022727283716.84277938360.235352737101
Trimmed Mean ( 9 / 34 )17086454.6627907276797.64446160561.7290464881857
Trimmed Mean ( 10 / 34 )17085934.5357143270895.11173981363.0721404531095
Trimmed Mean ( 11 / 34 )17086142.695122264535.97263653564.5891087130061
Trimmed Mean ( 12 / 34 )17086112.5125257530.36050743966.3460124811438
Trimmed Mean ( 13 / 34 )17086190.2307692251247.38121979568.0054460580505
Trimmed Mean ( 14 / 34 )17084551.4210526245203.47359616369.6749975458747
Trimmed Mean ( 15 / 34 )17084551.4210526239321.03243978471.3875886581399
Trimmed Mean ( 16 / 34 )17082711.0972222234967.89634213572.7023196068802
Trimmed Mean ( 17 / 34 )17084904.2714286230161.06182532774.2302113829949
Trimmed Mean ( 18 / 34 )17088057.4411765225854.41917132475.6596107522437
Trimmed Mean ( 19 / 34 )17094468.1818182221518.32965653877.1695426212493
Trimmed Mean ( 20 / 34 )17097134.0625218388.4569509878.2877185964901
Trimmed Mean ( 21 / 34 )17101154.1935484215023.37057786679.5316069485367
Trimmed Mean ( 22 / 34 )17106003.0333333211992.18426902780.6916683854019
Trimmed Mean ( 23 / 34 )17111837.4655172208516.9379650382.0644962107923
Trimmed Mean ( 24 / 34 )17117083.375204601.53348679783.6605820264027
Trimmed Mean ( 25 / 34 )17121799.4259259200323.73040808785.4706498877915
Trimmed Mean ( 26 / 34 )17130312.9423077197481.23925681586.7440016417484
Trimmed Mean ( 27 / 34 )17140900.26194158.14134517788.2831909145992
Trimmed Mean ( 28 / 34 )17153865.7708333190624.66323145889.987651545409
Trimmed Mean ( 29 / 34 )17166068.6304348186539.13437929992.0239535127798
Trimmed Mean ( 30 / 34 )17166068.6304348181720.91184231494.4639142320087
Trimmed Mean ( 31 / 34 )17191520.7857143175436.18882261397.9930133063766
Trimmed Mean ( 32 / 34 )17210621.325169206.794188412101.713535839677
Trimmed Mean ( 33 / 34 )17230982.9736842162400.190391754106.101987516876
Trimmed Mean ( 34 / 34 )17250477.6666667157056.741758431109.835957842546
Median17375886.5
Midrange22291550
Midmean - Weighted Average at Xnp17081079.2830189
Midmean - Weighted Average at X(n+1)p17130312.9423077
Midmean - Empirical Distribution Function17081079.2830189
Midmean - Empirical Distribution Function - Averaging17130312.9423077
Midmean - Empirical Distribution Function - Interpolation17130312.9423077
Midmean - Closest Observation17081079.2830189
Midmean - True Basic - Statistics Graphics Toolkit17130312.9423077
Midmean - MS Excel (old versions)17121799.4259259
Number of observations104

\begin{tabular}{lllllllll}
\hline
Central Tendency - Ungrouped Data \tabularnewline
Measure & Value & S.E. & Value/S.E. \tabularnewline
Arithmetic Mean & 17167453.75 & 368154.044487444 & 46.6311697699833 \tabularnewline
Geometric Mean & 16771879.6454805 &  &  \tabularnewline
Harmonic Mean & 16378027.4789571 &  &  \tabularnewline
Quadratic Mean & 17569343.2007874 &  &  \tabularnewline
Winsorized Mean ( 1 / 34 ) & 17060247.0192308 & 332599.027448807 & 51.2937369363074 \tabularnewline
Winsorized Mean ( 2 / 34 ) & 17069165.8653846 & 329596.785719122 & 51.7880228356678 \tabularnewline
Winsorized Mean ( 3 / 34 ) & 17064072.7884615 & 327178.627194839 & 52.1552184956742 \tabularnewline
Winsorized Mean ( 4 / 34 ) & 17068533.5576923 & 325451.286946435 & 52.4457399380374 \tabularnewline
Winsorized Mean ( 5 / 34 ) & 17070293.1730769 & 323646.261701265 & 52.7436747866202 \tabularnewline
Winsorized Mean ( 6 / 34 ) & 17082177.2115385 & 321571.188168134 & 53.12098172989 \tabularnewline
Winsorized Mean ( 7 / 34 ) & 17082871.0865385 & 320594.017365032 & 53.2850588633653 \tabularnewline
Winsorized Mean ( 8 / 34 ) & 17111809.625 & 315433.837603406 & 54.2484907612056 \tabularnewline
Winsorized Mean ( 9 / 34 ) & 17090235.5865385 & 304923.954912188 & 56.0475335283516 \tabularnewline
Winsorized Mean ( 10 / 34 ) & 17084293.2788462 & 302459.727512369 & 56.4845224829065 \tabularnewline
Winsorized Mean ( 11 / 34 ) & 17086398.0865385 & 300443.261581099 & 56.8706317346589 \tabularnewline
Winsorized Mean ( 12 / 34 ) & 17085413.0480769 & 289768.806138997 & 58.9622232832107 \tabularnewline
Winsorized Mean ( 13 / 34 ) & 17101758.9230769 & 282114.31676502 & 60.6199611532705 \tabularnewline
Winsorized Mean ( 14 / 34 ) & 17128434.9807692 & 274794.54898593 & 62.3317858522959 \tabularnewline
Winsorized Mean ( 15 / 34 ) & 17053509.8365385 & 258676.455543205 & 65.9260225316104 \tabularnewline
Winsorized Mean ( 16 / 34 ) & 17059092.2980769 & 256371.252085296 & 66.540581907371 \tabularnewline
Winsorized Mean ( 17 / 34 ) & 17049855.5769231 & 247199.927931354 & 68.9719277817011 \tabularnewline
Winsorized Mean ( 18 / 34 ) & 17014827.0576923 & 241708.665911977 & 70.3939471656702 \tabularnewline
Winsorized Mean ( 19 / 34 ) & 17063297.8846154 & 227912.043886804 & 74.8679077841543 \tabularnewline
Winsorized Mean ( 20 / 34 ) & 17049201.7307692 & 224695.340154644 & 75.876970652953 \tabularnewline
Winsorized Mean ( 21 / 34 ) & 17042408.6346154 & 217267.543704096 & 78.4397353790955 \tabularnewline
Winsorized Mean ( 22 / 34 ) & 17034419.0384615 & 215215.838659661 & 79.1503968506681 \tabularnewline
Winsorized Mean ( 23 / 34 ) & 17046868.8942308 & 212531.945630639 & 80.2085015673674 \tabularnewline
Winsorized Mean ( 24 / 34 ) & 17058314.125 & 208695.372102284 & 81.7378648753147 \tabularnewline
Winsorized Mean ( 25 / 34 ) & 17015380.4711538 & 193052.516246439 & 88.1386101667435 \tabularnewline
Winsorized Mean ( 26 / 34 ) & 16997971.4711538 & 190608.077229461 & 89.177603164692 \tabularnewline
Winsorized Mean ( 27 / 34 ) & 16979330.0480769 & 185776.427795148 & 91.3965794777779 \tabularnewline
Winsorized Mean ( 28 / 34 ) & 17002738.0480769 & 182804.804753524 & 93.0103454939367 \tabularnewline
Winsorized Mean ( 29 / 34 ) & 17014706.9615385 & 179834.132048624 & 94.6133348976156 \tabularnewline
Winsorized Mean ( 30 / 34 ) & 17019506.3846154 & 179204.634011746 & 94.972468086399 \tabularnewline
Winsorized Mean ( 31 / 34 ) & 16963783.5865385 & 168889.230860071 & 100.443252066163 \tabularnewline
Winsorized Mean ( 32 / 34 ) & 16972546.6634615 & 161938.100600853 & 104.808853509377 \tabularnewline
Winsorized Mean ( 33 / 34 ) & 17008293.5961538 & 146377.368165416 & 116.194831272915 \tabularnewline
Winsorized Mean ( 34 / 34 ) & 17078218.5192308 & 136389.638705397 & 125.216392398545 \tabularnewline
Trimmed Mean ( 1 / 34 ) & 17066981.2745098 & 326647.010131861 & 52.2490050272317 \tabularnewline
Trimmed Mean ( 2 / 34 ) & 17073984.9 & 319945.9301827 & 53.365219836521 \tabularnewline
Trimmed Mean ( 3 / 34 ) & 17076541.9387755 & 314171.955424225 & 54.3541256434463 \tabularnewline
Trimmed Mean ( 4 / 34 ) & 17081044.6875 & 308648.74610582 & 55.3413707426622 \tabularnewline
Trimmed Mean ( 5 / 34 ) & 17084505.212766 & 302954.849954156 & 56.3929087629765 \tabularnewline
Trimmed Mean ( 6 / 34 ) & 17087718.3695652 & 296985.011483047 & 57.5373089848362 \tabularnewline
Trimmed Mean ( 7 / 34 ) & 17088785.5555556 & 290692.33985163 & 58.786501096925 \tabularnewline
Trimmed Mean ( 8 / 34 ) & 17089784.1022727 & 283716.842779383 & 60.235352737101 \tabularnewline
Trimmed Mean ( 9 / 34 ) & 17086454.6627907 & 276797.644461605 & 61.7290464881857 \tabularnewline
Trimmed Mean ( 10 / 34 ) & 17085934.5357143 & 270895.111739813 & 63.0721404531095 \tabularnewline
Trimmed Mean ( 11 / 34 ) & 17086142.695122 & 264535.972636535 & 64.5891087130061 \tabularnewline
Trimmed Mean ( 12 / 34 ) & 17086112.5125 & 257530.360507439 & 66.3460124811438 \tabularnewline
Trimmed Mean ( 13 / 34 ) & 17086190.2307692 & 251247.381219795 & 68.0054460580505 \tabularnewline
Trimmed Mean ( 14 / 34 ) & 17084551.4210526 & 245203.473596163 & 69.6749975458747 \tabularnewline
Trimmed Mean ( 15 / 34 ) & 17084551.4210526 & 239321.032439784 & 71.3875886581399 \tabularnewline
Trimmed Mean ( 16 / 34 ) & 17082711.0972222 & 234967.896342135 & 72.7023196068802 \tabularnewline
Trimmed Mean ( 17 / 34 ) & 17084904.2714286 & 230161.061825327 & 74.2302113829949 \tabularnewline
Trimmed Mean ( 18 / 34 ) & 17088057.4411765 & 225854.419171324 & 75.6596107522437 \tabularnewline
Trimmed Mean ( 19 / 34 ) & 17094468.1818182 & 221518.329656538 & 77.1695426212493 \tabularnewline
Trimmed Mean ( 20 / 34 ) & 17097134.0625 & 218388.45695098 & 78.2877185964901 \tabularnewline
Trimmed Mean ( 21 / 34 ) & 17101154.1935484 & 215023.370577866 & 79.5316069485367 \tabularnewline
Trimmed Mean ( 22 / 34 ) & 17106003.0333333 & 211992.184269027 & 80.6916683854019 \tabularnewline
Trimmed Mean ( 23 / 34 ) & 17111837.4655172 & 208516.93796503 & 82.0644962107923 \tabularnewline
Trimmed Mean ( 24 / 34 ) & 17117083.375 & 204601.533486797 & 83.6605820264027 \tabularnewline
Trimmed Mean ( 25 / 34 ) & 17121799.4259259 & 200323.730408087 & 85.4706498877915 \tabularnewline
Trimmed Mean ( 26 / 34 ) & 17130312.9423077 & 197481.239256815 & 86.7440016417484 \tabularnewline
Trimmed Mean ( 27 / 34 ) & 17140900.26 & 194158.141345177 & 88.2831909145992 \tabularnewline
Trimmed Mean ( 28 / 34 ) & 17153865.7708333 & 190624.663231458 & 89.987651545409 \tabularnewline
Trimmed Mean ( 29 / 34 ) & 17166068.6304348 & 186539.134379299 & 92.0239535127798 \tabularnewline
Trimmed Mean ( 30 / 34 ) & 17166068.6304348 & 181720.911842314 & 94.4639142320087 \tabularnewline
Trimmed Mean ( 31 / 34 ) & 17191520.7857143 & 175436.188822613 & 97.9930133063766 \tabularnewline
Trimmed Mean ( 32 / 34 ) & 17210621.325 & 169206.794188412 & 101.713535839677 \tabularnewline
Trimmed Mean ( 33 / 34 ) & 17230982.9736842 & 162400.190391754 & 106.101987516876 \tabularnewline
Trimmed Mean ( 34 / 34 ) & 17250477.6666667 & 157056.741758431 & 109.835957842546 \tabularnewline
Median & 17375886.5 &  &  \tabularnewline
Midrange & 22291550 &  &  \tabularnewline
Midmean - Weighted Average at Xnp & 17081079.2830189 &  &  \tabularnewline
Midmean - Weighted Average at X(n+1)p & 17130312.9423077 &  &  \tabularnewline
Midmean - Empirical Distribution Function & 17081079.2830189 &  &  \tabularnewline
Midmean - Empirical Distribution Function - Averaging & 17130312.9423077 &  &  \tabularnewline
Midmean - Empirical Distribution Function - Interpolation & 17130312.9423077 &  &  \tabularnewline
Midmean - Closest Observation & 17081079.2830189 &  &  \tabularnewline
Midmean - True Basic - Statistics Graphics Toolkit & 17130312.9423077 &  &  \tabularnewline
Midmean - MS Excel (old versions) & 17121799.4259259 &  &  \tabularnewline
Number of observations & 104 &  &  \tabularnewline
\hline
\end{tabular}
%Source: https://freestatistics.org/blog/index.php?pk=111366&T=1

[TABLE]
[ROW][C]Central Tendency - Ungrouped Data[/C][/ROW]
[ROW][C]Measure[/C][C]Value[/C][C]S.E.[/C][C]Value/S.E.[/C][/ROW]
[ROW][C]Arithmetic Mean[/C][C]17167453.75[/C][C]368154.044487444[/C][C]46.6311697699833[/C][/ROW]
[ROW][C]Geometric Mean[/C][C]16771879.6454805[/C][C][/C][C][/C][/ROW]
[ROW][C]Harmonic Mean[/C][C]16378027.4789571[/C][C][/C][C][/C][/ROW]
[ROW][C]Quadratic Mean[/C][C]17569343.2007874[/C][C][/C][C][/C][/ROW]
[ROW][C]Winsorized Mean ( 1 / 34 )[/C][C]17060247.0192308[/C][C]332599.027448807[/C][C]51.2937369363074[/C][/ROW]
[ROW][C]Winsorized Mean ( 2 / 34 )[/C][C]17069165.8653846[/C][C]329596.785719122[/C][C]51.7880228356678[/C][/ROW]
[ROW][C]Winsorized Mean ( 3 / 34 )[/C][C]17064072.7884615[/C][C]327178.627194839[/C][C]52.1552184956742[/C][/ROW]
[ROW][C]Winsorized Mean ( 4 / 34 )[/C][C]17068533.5576923[/C][C]325451.286946435[/C][C]52.4457399380374[/C][/ROW]
[ROW][C]Winsorized Mean ( 5 / 34 )[/C][C]17070293.1730769[/C][C]323646.261701265[/C][C]52.7436747866202[/C][/ROW]
[ROW][C]Winsorized Mean ( 6 / 34 )[/C][C]17082177.2115385[/C][C]321571.188168134[/C][C]53.12098172989[/C][/ROW]
[ROW][C]Winsorized Mean ( 7 / 34 )[/C][C]17082871.0865385[/C][C]320594.017365032[/C][C]53.2850588633653[/C][/ROW]
[ROW][C]Winsorized Mean ( 8 / 34 )[/C][C]17111809.625[/C][C]315433.837603406[/C][C]54.2484907612056[/C][/ROW]
[ROW][C]Winsorized Mean ( 9 / 34 )[/C][C]17090235.5865385[/C][C]304923.954912188[/C][C]56.0475335283516[/C][/ROW]
[ROW][C]Winsorized Mean ( 10 / 34 )[/C][C]17084293.2788462[/C][C]302459.727512369[/C][C]56.4845224829065[/C][/ROW]
[ROW][C]Winsorized Mean ( 11 / 34 )[/C][C]17086398.0865385[/C][C]300443.261581099[/C][C]56.8706317346589[/C][/ROW]
[ROW][C]Winsorized Mean ( 12 / 34 )[/C][C]17085413.0480769[/C][C]289768.806138997[/C][C]58.9622232832107[/C][/ROW]
[ROW][C]Winsorized Mean ( 13 / 34 )[/C][C]17101758.9230769[/C][C]282114.31676502[/C][C]60.6199611532705[/C][/ROW]
[ROW][C]Winsorized Mean ( 14 / 34 )[/C][C]17128434.9807692[/C][C]274794.54898593[/C][C]62.3317858522959[/C][/ROW]
[ROW][C]Winsorized Mean ( 15 / 34 )[/C][C]17053509.8365385[/C][C]258676.455543205[/C][C]65.9260225316104[/C][/ROW]
[ROW][C]Winsorized Mean ( 16 / 34 )[/C][C]17059092.2980769[/C][C]256371.252085296[/C][C]66.540581907371[/C][/ROW]
[ROW][C]Winsorized Mean ( 17 / 34 )[/C][C]17049855.5769231[/C][C]247199.927931354[/C][C]68.9719277817011[/C][/ROW]
[ROW][C]Winsorized Mean ( 18 / 34 )[/C][C]17014827.0576923[/C][C]241708.665911977[/C][C]70.3939471656702[/C][/ROW]
[ROW][C]Winsorized Mean ( 19 / 34 )[/C][C]17063297.8846154[/C][C]227912.043886804[/C][C]74.8679077841543[/C][/ROW]
[ROW][C]Winsorized Mean ( 20 / 34 )[/C][C]17049201.7307692[/C][C]224695.340154644[/C][C]75.876970652953[/C][/ROW]
[ROW][C]Winsorized Mean ( 21 / 34 )[/C][C]17042408.6346154[/C][C]217267.543704096[/C][C]78.4397353790955[/C][/ROW]
[ROW][C]Winsorized Mean ( 22 / 34 )[/C][C]17034419.0384615[/C][C]215215.838659661[/C][C]79.1503968506681[/C][/ROW]
[ROW][C]Winsorized Mean ( 23 / 34 )[/C][C]17046868.8942308[/C][C]212531.945630639[/C][C]80.2085015673674[/C][/ROW]
[ROW][C]Winsorized Mean ( 24 / 34 )[/C][C]17058314.125[/C][C]208695.372102284[/C][C]81.7378648753147[/C][/ROW]
[ROW][C]Winsorized Mean ( 25 / 34 )[/C][C]17015380.4711538[/C][C]193052.516246439[/C][C]88.1386101667435[/C][/ROW]
[ROW][C]Winsorized Mean ( 26 / 34 )[/C][C]16997971.4711538[/C][C]190608.077229461[/C][C]89.177603164692[/C][/ROW]
[ROW][C]Winsorized Mean ( 27 / 34 )[/C][C]16979330.0480769[/C][C]185776.427795148[/C][C]91.3965794777779[/C][/ROW]
[ROW][C]Winsorized Mean ( 28 / 34 )[/C][C]17002738.0480769[/C][C]182804.804753524[/C][C]93.0103454939367[/C][/ROW]
[ROW][C]Winsorized Mean ( 29 / 34 )[/C][C]17014706.9615385[/C][C]179834.132048624[/C][C]94.6133348976156[/C][/ROW]
[ROW][C]Winsorized Mean ( 30 / 34 )[/C][C]17019506.3846154[/C][C]179204.634011746[/C][C]94.972468086399[/C][/ROW]
[ROW][C]Winsorized Mean ( 31 / 34 )[/C][C]16963783.5865385[/C][C]168889.230860071[/C][C]100.443252066163[/C][/ROW]
[ROW][C]Winsorized Mean ( 32 / 34 )[/C][C]16972546.6634615[/C][C]161938.100600853[/C][C]104.808853509377[/C][/ROW]
[ROW][C]Winsorized Mean ( 33 / 34 )[/C][C]17008293.5961538[/C][C]146377.368165416[/C][C]116.194831272915[/C][/ROW]
[ROW][C]Winsorized Mean ( 34 / 34 )[/C][C]17078218.5192308[/C][C]136389.638705397[/C][C]125.216392398545[/C][/ROW]
[ROW][C]Trimmed Mean ( 1 / 34 )[/C][C]17066981.2745098[/C][C]326647.010131861[/C][C]52.2490050272317[/C][/ROW]
[ROW][C]Trimmed Mean ( 2 / 34 )[/C][C]17073984.9[/C][C]319945.9301827[/C][C]53.365219836521[/C][/ROW]
[ROW][C]Trimmed Mean ( 3 / 34 )[/C][C]17076541.9387755[/C][C]314171.955424225[/C][C]54.3541256434463[/C][/ROW]
[ROW][C]Trimmed Mean ( 4 / 34 )[/C][C]17081044.6875[/C][C]308648.74610582[/C][C]55.3413707426622[/C][/ROW]
[ROW][C]Trimmed Mean ( 5 / 34 )[/C][C]17084505.212766[/C][C]302954.849954156[/C][C]56.3929087629765[/C][/ROW]
[ROW][C]Trimmed Mean ( 6 / 34 )[/C][C]17087718.3695652[/C][C]296985.011483047[/C][C]57.5373089848362[/C][/ROW]
[ROW][C]Trimmed Mean ( 7 / 34 )[/C][C]17088785.5555556[/C][C]290692.33985163[/C][C]58.786501096925[/C][/ROW]
[ROW][C]Trimmed Mean ( 8 / 34 )[/C][C]17089784.1022727[/C][C]283716.842779383[/C][C]60.235352737101[/C][/ROW]
[ROW][C]Trimmed Mean ( 9 / 34 )[/C][C]17086454.6627907[/C][C]276797.644461605[/C][C]61.7290464881857[/C][/ROW]
[ROW][C]Trimmed Mean ( 10 / 34 )[/C][C]17085934.5357143[/C][C]270895.111739813[/C][C]63.0721404531095[/C][/ROW]
[ROW][C]Trimmed Mean ( 11 / 34 )[/C][C]17086142.695122[/C][C]264535.972636535[/C][C]64.5891087130061[/C][/ROW]
[ROW][C]Trimmed Mean ( 12 / 34 )[/C][C]17086112.5125[/C][C]257530.360507439[/C][C]66.3460124811438[/C][/ROW]
[ROW][C]Trimmed Mean ( 13 / 34 )[/C][C]17086190.2307692[/C][C]251247.381219795[/C][C]68.0054460580505[/C][/ROW]
[ROW][C]Trimmed Mean ( 14 / 34 )[/C][C]17084551.4210526[/C][C]245203.473596163[/C][C]69.6749975458747[/C][/ROW]
[ROW][C]Trimmed Mean ( 15 / 34 )[/C][C]17084551.4210526[/C][C]239321.032439784[/C][C]71.3875886581399[/C][/ROW]
[ROW][C]Trimmed Mean ( 16 / 34 )[/C][C]17082711.0972222[/C][C]234967.896342135[/C][C]72.7023196068802[/C][/ROW]
[ROW][C]Trimmed Mean ( 17 / 34 )[/C][C]17084904.2714286[/C][C]230161.061825327[/C][C]74.2302113829949[/C][/ROW]
[ROW][C]Trimmed Mean ( 18 / 34 )[/C][C]17088057.4411765[/C][C]225854.419171324[/C][C]75.6596107522437[/C][/ROW]
[ROW][C]Trimmed Mean ( 19 / 34 )[/C][C]17094468.1818182[/C][C]221518.329656538[/C][C]77.1695426212493[/C][/ROW]
[ROW][C]Trimmed Mean ( 20 / 34 )[/C][C]17097134.0625[/C][C]218388.45695098[/C][C]78.2877185964901[/C][/ROW]
[ROW][C]Trimmed Mean ( 21 / 34 )[/C][C]17101154.1935484[/C][C]215023.370577866[/C][C]79.5316069485367[/C][/ROW]
[ROW][C]Trimmed Mean ( 22 / 34 )[/C][C]17106003.0333333[/C][C]211992.184269027[/C][C]80.6916683854019[/C][/ROW]
[ROW][C]Trimmed Mean ( 23 / 34 )[/C][C]17111837.4655172[/C][C]208516.93796503[/C][C]82.0644962107923[/C][/ROW]
[ROW][C]Trimmed Mean ( 24 / 34 )[/C][C]17117083.375[/C][C]204601.533486797[/C][C]83.6605820264027[/C][/ROW]
[ROW][C]Trimmed Mean ( 25 / 34 )[/C][C]17121799.4259259[/C][C]200323.730408087[/C][C]85.4706498877915[/C][/ROW]
[ROW][C]Trimmed Mean ( 26 / 34 )[/C][C]17130312.9423077[/C][C]197481.239256815[/C][C]86.7440016417484[/C][/ROW]
[ROW][C]Trimmed Mean ( 27 / 34 )[/C][C]17140900.26[/C][C]194158.141345177[/C][C]88.2831909145992[/C][/ROW]
[ROW][C]Trimmed Mean ( 28 / 34 )[/C][C]17153865.7708333[/C][C]190624.663231458[/C][C]89.987651545409[/C][/ROW]
[ROW][C]Trimmed Mean ( 29 / 34 )[/C][C]17166068.6304348[/C][C]186539.134379299[/C][C]92.0239535127798[/C][/ROW]
[ROW][C]Trimmed Mean ( 30 / 34 )[/C][C]17166068.6304348[/C][C]181720.911842314[/C][C]94.4639142320087[/C][/ROW]
[ROW][C]Trimmed Mean ( 31 / 34 )[/C][C]17191520.7857143[/C][C]175436.188822613[/C][C]97.9930133063766[/C][/ROW]
[ROW][C]Trimmed Mean ( 32 / 34 )[/C][C]17210621.325[/C][C]169206.794188412[/C][C]101.713535839677[/C][/ROW]
[ROW][C]Trimmed Mean ( 33 / 34 )[/C][C]17230982.9736842[/C][C]162400.190391754[/C][C]106.101987516876[/C][/ROW]
[ROW][C]Trimmed Mean ( 34 / 34 )[/C][C]17250477.6666667[/C][C]157056.741758431[/C][C]109.835957842546[/C][/ROW]
[ROW][C]Median[/C][C]17375886.5[/C][C][/C][C][/C][/ROW]
[ROW][C]Midrange[/C][C]22291550[/C][C][/C][C][/C][/ROW]
[ROW][C]Midmean - Weighted Average at Xnp[/C][C]17081079.2830189[/C][C][/C][C][/C][/ROW]
[ROW][C]Midmean - Weighted Average at X(n+1)p[/C][C]17130312.9423077[/C][C][/C][C][/C][/ROW]
[ROW][C]Midmean - Empirical Distribution Function[/C][C]17081079.2830189[/C][C][/C][C][/C][/ROW]
[ROW][C]Midmean - Empirical Distribution Function - Averaging[/C][C]17130312.9423077[/C][C][/C][C][/C][/ROW]
[ROW][C]Midmean - Empirical Distribution Function - Interpolation[/C][C]17130312.9423077[/C][C][/C][C][/C][/ROW]
[ROW][C]Midmean - Closest Observation[/C][C]17081079.2830189[/C][C][/C][C][/C][/ROW]
[ROW][C]Midmean - True Basic - Statistics Graphics Toolkit[/C][C]17130312.9423077[/C][C][/C][C][/C][/ROW]
[ROW][C]Midmean - MS Excel (old versions)[/C][C]17121799.4259259[/C][C][/C][C][/C][/ROW]
[ROW][C]Number of observations[/C][C]104[/C][C][/C][C][/C][/ROW]
[/TABLE]
Source: https://freestatistics.org/blog/index.php?pk=111366&T=1

Globally Unique Identifier (entire table): ba.freestatistics.org/blog/index.php?pk=111366&T=1

As an alternative you can also use a QR Code:  

The GUIDs for individual cells are displayed in the table below:

Central Tendency - Ungrouped Data
MeasureValueS.E.Value/S.E.
Arithmetic Mean17167453.75368154.04448744446.6311697699833
Geometric Mean16771879.6454805
Harmonic Mean16378027.4789571
Quadratic Mean17569343.2007874
Winsorized Mean ( 1 / 34 )17060247.0192308332599.02744880751.2937369363074
Winsorized Mean ( 2 / 34 )17069165.8653846329596.78571912251.7880228356678
Winsorized Mean ( 3 / 34 )17064072.7884615327178.62719483952.1552184956742
Winsorized Mean ( 4 / 34 )17068533.5576923325451.28694643552.4457399380374
Winsorized Mean ( 5 / 34 )17070293.1730769323646.26170126552.7436747866202
Winsorized Mean ( 6 / 34 )17082177.2115385321571.18816813453.12098172989
Winsorized Mean ( 7 / 34 )17082871.0865385320594.01736503253.2850588633653
Winsorized Mean ( 8 / 34 )17111809.625315433.83760340654.2484907612056
Winsorized Mean ( 9 / 34 )17090235.5865385304923.95491218856.0475335283516
Winsorized Mean ( 10 / 34 )17084293.2788462302459.72751236956.4845224829065
Winsorized Mean ( 11 / 34 )17086398.0865385300443.26158109956.8706317346589
Winsorized Mean ( 12 / 34 )17085413.0480769289768.80613899758.9622232832107
Winsorized Mean ( 13 / 34 )17101758.9230769282114.3167650260.6199611532705
Winsorized Mean ( 14 / 34 )17128434.9807692274794.5489859362.3317858522959
Winsorized Mean ( 15 / 34 )17053509.8365385258676.45554320565.9260225316104
Winsorized Mean ( 16 / 34 )17059092.2980769256371.25208529666.540581907371
Winsorized Mean ( 17 / 34 )17049855.5769231247199.92793135468.9719277817011
Winsorized Mean ( 18 / 34 )17014827.0576923241708.66591197770.3939471656702
Winsorized Mean ( 19 / 34 )17063297.8846154227912.04388680474.8679077841543
Winsorized Mean ( 20 / 34 )17049201.7307692224695.34015464475.876970652953
Winsorized Mean ( 21 / 34 )17042408.6346154217267.54370409678.4397353790955
Winsorized Mean ( 22 / 34 )17034419.0384615215215.83865966179.1503968506681
Winsorized Mean ( 23 / 34 )17046868.8942308212531.94563063980.2085015673674
Winsorized Mean ( 24 / 34 )17058314.125208695.37210228481.7378648753147
Winsorized Mean ( 25 / 34 )17015380.4711538193052.51624643988.1386101667435
Winsorized Mean ( 26 / 34 )16997971.4711538190608.07722946189.177603164692
Winsorized Mean ( 27 / 34 )16979330.0480769185776.42779514891.3965794777779
Winsorized Mean ( 28 / 34 )17002738.0480769182804.80475352493.0103454939367
Winsorized Mean ( 29 / 34 )17014706.9615385179834.13204862494.6133348976156
Winsorized Mean ( 30 / 34 )17019506.3846154179204.63401174694.972468086399
Winsorized Mean ( 31 / 34 )16963783.5865385168889.230860071100.443252066163
Winsorized Mean ( 32 / 34 )16972546.6634615161938.100600853104.808853509377
Winsorized Mean ( 33 / 34 )17008293.5961538146377.368165416116.194831272915
Winsorized Mean ( 34 / 34 )17078218.5192308136389.638705397125.216392398545
Trimmed Mean ( 1 / 34 )17066981.2745098326647.01013186152.2490050272317
Trimmed Mean ( 2 / 34 )17073984.9319945.930182753.365219836521
Trimmed Mean ( 3 / 34 )17076541.9387755314171.95542422554.3541256434463
Trimmed Mean ( 4 / 34 )17081044.6875308648.7461058255.3413707426622
Trimmed Mean ( 5 / 34 )17084505.212766302954.84995415656.3929087629765
Trimmed Mean ( 6 / 34 )17087718.3695652296985.01148304757.5373089848362
Trimmed Mean ( 7 / 34 )17088785.5555556290692.3398516358.786501096925
Trimmed Mean ( 8 / 34 )17089784.1022727283716.84277938360.235352737101
Trimmed Mean ( 9 / 34 )17086454.6627907276797.64446160561.7290464881857
Trimmed Mean ( 10 / 34 )17085934.5357143270895.11173981363.0721404531095
Trimmed Mean ( 11 / 34 )17086142.695122264535.97263653564.5891087130061
Trimmed Mean ( 12 / 34 )17086112.5125257530.36050743966.3460124811438
Trimmed Mean ( 13 / 34 )17086190.2307692251247.38121979568.0054460580505
Trimmed Mean ( 14 / 34 )17084551.4210526245203.47359616369.6749975458747
Trimmed Mean ( 15 / 34 )17084551.4210526239321.03243978471.3875886581399
Trimmed Mean ( 16 / 34 )17082711.0972222234967.89634213572.7023196068802
Trimmed Mean ( 17 / 34 )17084904.2714286230161.06182532774.2302113829949
Trimmed Mean ( 18 / 34 )17088057.4411765225854.41917132475.6596107522437
Trimmed Mean ( 19 / 34 )17094468.1818182221518.32965653877.1695426212493
Trimmed Mean ( 20 / 34 )17097134.0625218388.4569509878.2877185964901
Trimmed Mean ( 21 / 34 )17101154.1935484215023.37057786679.5316069485367
Trimmed Mean ( 22 / 34 )17106003.0333333211992.18426902780.6916683854019
Trimmed Mean ( 23 / 34 )17111837.4655172208516.9379650382.0644962107923
Trimmed Mean ( 24 / 34 )17117083.375204601.53348679783.6605820264027
Trimmed Mean ( 25 / 34 )17121799.4259259200323.73040808785.4706498877915
Trimmed Mean ( 26 / 34 )17130312.9423077197481.23925681586.7440016417484
Trimmed Mean ( 27 / 34 )17140900.26194158.14134517788.2831909145992
Trimmed Mean ( 28 / 34 )17153865.7708333190624.66323145889.987651545409
Trimmed Mean ( 29 / 34 )17166068.6304348186539.13437929992.0239535127798
Trimmed Mean ( 30 / 34 )17166068.6304348181720.91184231494.4639142320087
Trimmed Mean ( 31 / 34 )17191520.7857143175436.18882261397.9930133063766
Trimmed Mean ( 32 / 34 )17210621.325169206.794188412101.713535839677
Trimmed Mean ( 33 / 34 )17230982.9736842162400.190391754106.101987516876
Trimmed Mean ( 34 / 34 )17250477.6666667157056.741758431109.835957842546
Median17375886.5
Midrange22291550
Midmean - Weighted Average at Xnp17081079.2830189
Midmean - Weighted Average at X(n+1)p17130312.9423077
Midmean - Empirical Distribution Function17081079.2830189
Midmean - Empirical Distribution Function - Averaging17130312.9423077
Midmean - Empirical Distribution Function - Interpolation17130312.9423077
Midmean - Closest Observation17081079.2830189
Midmean - True Basic - Statistics Graphics Toolkit17130312.9423077
Midmean - MS Excel (old versions)17121799.4259259
Number of observations104


Variability - Ungrouped Data
Absolute range24459300
Relative range (unbiased)6.51475035519945
Relative range (biased)6.54629896758497
Variance (unbiased)14095889649136.2
Variance (biased)13960352248663.7
Standard Deviation (unbiased)3754449.31369917
Standard Deviation (biased)3736355.47675321
Coefficient of Variation (unbiased)0.21869575816968
Coefficient of Variation (biased)0.217641796574126
Mean Squared Error (MSE versus 0)308681820507053
Mean Squared Error (MSE versus Mean)13960352248663.7
Mean Absolute Deviation from Mean (MAD Mean)2881323.625
Mean Absolute Deviation from Median (MAD Median)2875777.36538462
Median Absolute Deviation from Mean2510250
Median Absolute Deviation from Median2558390
Mean Squared Deviation from Mean13960352248663.7
Mean Squared Deviation from Median14003796459936.3
Interquartile Difference (Weighted Average at Xnp)4681431
Interquartile Difference (Weighted Average at X(n+1)p)4737643.5
Interquartile Difference (Empirical Distribution Function)4681431
Interquartile Difference (Empirical Distribution Function - Averaging)4716249
Interquartile Difference (Empirical Distribution Function - Interpolation)4694854.5
Interquartile Difference (Closest Observation)4681431
Interquartile Difference (True Basic - Statistics Graphics Toolkit)4694854.5
Interquartile Difference (MS Excel (old versions))4759038
Semi Interquartile Difference (Weighted Average at Xnp)2340715.5
Semi Interquartile Difference (Weighted Average at X(n+1)p)2368821.75
Semi Interquartile Difference (Empirical Distribution Function)2340715.5
Semi Interquartile Difference (Empirical Distribution Function - Averaging)2358124.5
Semi Interquartile Difference (Empirical Distribution Function - Interpolation)2347427.25
Semi Interquartile Difference (Closest Observation)2340715.5
Semi Interquartile Difference (True Basic - Statistics Graphics Toolkit)2347427.25
Semi Interquartile Difference (MS Excel (old versions))2379519
Coefficient of Quartile Variation (Weighted Average at Xnp)0.138818933111773
Coefficient of Quartile Variation (Weighted Average at X(n+1)p)0.140235479540641
Coefficient of Quartile Variation (Empirical Distribution Function)0.138818933111773
Coefficient of Quartile Variation (Empirical Distribution Function - Averaging)0.139674172404625
Coefficient of Quartile Variation (Empirical Distribution Function - Interpolation)0.139112286176382
Coefficient of Quartile Variation (Closest Observation)0.138818933111773
Coefficient of Quartile Variation (True Basic - Statistics Graphics Toolkit)0.139112286176382
Coefficient of Quartile Variation (MS Excel (old versions))0.140796208479207
Number of all Pairs of Observations5356
Squared Differences between all Pairs of Observations28191779298272.1
Mean Absolute Differences between all Pairs of Observations4118118.88125467
Gini Mean Difference4118118.88125467
Leik Measure of Dispersion0.492026927252605
Index of Diversity0.989929154311385
Index of Qualitative Variation0.999540116974602
Coefficient of Dispersion0.165823114981788
Observations104

\begin{tabular}{lllllllll}
\hline
Variability - Ungrouped Data \tabularnewline
Absolute range & 24459300 \tabularnewline
Relative range (unbiased) & 6.51475035519945 \tabularnewline
Relative range (biased) & 6.54629896758497 \tabularnewline
Variance (unbiased) & 14095889649136.2 \tabularnewline
Variance (biased) & 13960352248663.7 \tabularnewline
Standard Deviation (unbiased) & 3754449.31369917 \tabularnewline
Standard Deviation (biased) & 3736355.47675321 \tabularnewline
Coefficient of Variation (unbiased) & 0.21869575816968 \tabularnewline
Coefficient of Variation (biased) & 0.217641796574126 \tabularnewline
Mean Squared Error (MSE versus 0) & 308681820507053 \tabularnewline
Mean Squared Error (MSE versus Mean) & 13960352248663.7 \tabularnewline
Mean Absolute Deviation from Mean (MAD Mean) & 2881323.625 \tabularnewline
Mean Absolute Deviation from Median (MAD Median) & 2875777.36538462 \tabularnewline
Median Absolute Deviation from Mean & 2510250 \tabularnewline
Median Absolute Deviation from Median & 2558390 \tabularnewline
Mean Squared Deviation from Mean & 13960352248663.7 \tabularnewline
Mean Squared Deviation from Median & 14003796459936.3 \tabularnewline
Interquartile Difference (Weighted Average at Xnp) & 4681431 \tabularnewline
Interquartile Difference (Weighted Average at X(n+1)p) & 4737643.5 \tabularnewline
Interquartile Difference (Empirical Distribution Function) & 4681431 \tabularnewline
Interquartile Difference (Empirical Distribution Function - Averaging) & 4716249 \tabularnewline
Interquartile Difference (Empirical Distribution Function - Interpolation) & 4694854.5 \tabularnewline
Interquartile Difference (Closest Observation) & 4681431 \tabularnewline
Interquartile Difference (True Basic - Statistics Graphics Toolkit) & 4694854.5 \tabularnewline
Interquartile Difference (MS Excel (old versions)) & 4759038 \tabularnewline
Semi Interquartile Difference (Weighted Average at Xnp) & 2340715.5 \tabularnewline
Semi Interquartile Difference (Weighted Average at X(n+1)p) & 2368821.75 \tabularnewline
Semi Interquartile Difference (Empirical Distribution Function) & 2340715.5 \tabularnewline
Semi Interquartile Difference (Empirical Distribution Function - Averaging) & 2358124.5 \tabularnewline
Semi Interquartile Difference (Empirical Distribution Function - Interpolation) & 2347427.25 \tabularnewline
Semi Interquartile Difference (Closest Observation) & 2340715.5 \tabularnewline
Semi Interquartile Difference (True Basic - Statistics Graphics Toolkit) & 2347427.25 \tabularnewline
Semi Interquartile Difference (MS Excel (old versions)) & 2379519 \tabularnewline
Coefficient of Quartile Variation (Weighted Average at Xnp) & 0.138818933111773 \tabularnewline
Coefficient of Quartile Variation (Weighted Average at X(n+1)p) & 0.140235479540641 \tabularnewline
Coefficient of Quartile Variation (Empirical Distribution Function) & 0.138818933111773 \tabularnewline
Coefficient of Quartile Variation (Empirical Distribution Function - Averaging) & 0.139674172404625 \tabularnewline
Coefficient of Quartile Variation (Empirical Distribution Function - Interpolation) & 0.139112286176382 \tabularnewline
Coefficient of Quartile Variation (Closest Observation) & 0.138818933111773 \tabularnewline
Coefficient of Quartile Variation (True Basic - Statistics Graphics Toolkit) & 0.139112286176382 \tabularnewline
Coefficient of Quartile Variation (MS Excel (old versions)) & 0.140796208479207 \tabularnewline
Number of all Pairs of Observations & 5356 \tabularnewline
Squared Differences between all Pairs of Observations & 28191779298272.1 \tabularnewline
Mean Absolute Differences between all Pairs of Observations & 4118118.88125467 \tabularnewline
Gini Mean Difference & 4118118.88125467 \tabularnewline
Leik Measure of Dispersion & 0.492026927252605 \tabularnewline
Index of Diversity & 0.989929154311385 \tabularnewline
Index of Qualitative Variation & 0.999540116974602 \tabularnewline
Coefficient of Dispersion & 0.165823114981788 \tabularnewline
Observations & 104 \tabularnewline
\hline
\end{tabular}
%Source: https://freestatistics.org/blog/index.php?pk=111366&T=2

[TABLE]
[ROW][C]Variability - Ungrouped Data[/C][/ROW]
[ROW][C]Absolute range[/C][C]24459300[/C][/ROW]
[ROW][C]Relative range (unbiased)[/C][C]6.51475035519945[/C][/ROW]
[ROW][C]Relative range (biased)[/C][C]6.54629896758497[/C][/ROW]
[ROW][C]Variance (unbiased)[/C][C]14095889649136.2[/C][/ROW]
[ROW][C]Variance (biased)[/C][C]13960352248663.7[/C][/ROW]
[ROW][C]Standard Deviation (unbiased)[/C][C]3754449.31369917[/C][/ROW]
[ROW][C]Standard Deviation (biased)[/C][C]3736355.47675321[/C][/ROW]
[ROW][C]Coefficient of Variation (unbiased)[/C][C]0.21869575816968[/C][/ROW]
[ROW][C]Coefficient of Variation (biased)[/C][C]0.217641796574126[/C][/ROW]
[ROW][C]Mean Squared Error (MSE versus 0)[/C][C]308681820507053[/C][/ROW]
[ROW][C]Mean Squared Error (MSE versus Mean)[/C][C]13960352248663.7[/C][/ROW]
[ROW][C]Mean Absolute Deviation from Mean (MAD Mean)[/C][C]2881323.625[/C][/ROW]
[ROW][C]Mean Absolute Deviation from Median (MAD Median)[/C][C]2875777.36538462[/C][/ROW]
[ROW][C]Median Absolute Deviation from Mean[/C][C]2510250[/C][/ROW]
[ROW][C]Median Absolute Deviation from Median[/C][C]2558390[/C][/ROW]
[ROW][C]Mean Squared Deviation from Mean[/C][C]13960352248663.7[/C][/ROW]
[ROW][C]Mean Squared Deviation from Median[/C][C]14003796459936.3[/C][/ROW]
[ROW][C]Interquartile Difference (Weighted Average at Xnp)[/C][C]4681431[/C][/ROW]
[ROW][C]Interquartile Difference (Weighted Average at X(n+1)p)[/C][C]4737643.5[/C][/ROW]
[ROW][C]Interquartile Difference (Empirical Distribution Function)[/C][C]4681431[/C][/ROW]
[ROW][C]Interquartile Difference (Empirical Distribution Function - Averaging)[/C][C]4716249[/C][/ROW]
[ROW][C]Interquartile Difference (Empirical Distribution Function - Interpolation)[/C][C]4694854.5[/C][/ROW]
[ROW][C]Interquartile Difference (Closest Observation)[/C][C]4681431[/C][/ROW]
[ROW][C]Interquartile Difference (True Basic - Statistics Graphics Toolkit)[/C][C]4694854.5[/C][/ROW]
[ROW][C]Interquartile Difference (MS Excel (old versions))[/C][C]4759038[/C][/ROW]
[ROW][C]Semi Interquartile Difference (Weighted Average at Xnp)[/C][C]2340715.5[/C][/ROW]
[ROW][C]Semi Interquartile Difference (Weighted Average at X(n+1)p)[/C][C]2368821.75[/C][/ROW]
[ROW][C]Semi Interquartile Difference (Empirical Distribution Function)[/C][C]2340715.5[/C][/ROW]
[ROW][C]Semi Interquartile Difference (Empirical Distribution Function - Averaging)[/C][C]2358124.5[/C][/ROW]
[ROW][C]Semi Interquartile Difference (Empirical Distribution Function - Interpolation)[/C][C]2347427.25[/C][/ROW]
[ROW][C]Semi Interquartile Difference (Closest Observation)[/C][C]2340715.5[/C][/ROW]
[ROW][C]Semi Interquartile Difference (True Basic - Statistics Graphics Toolkit)[/C][C]2347427.25[/C][/ROW]
[ROW][C]Semi Interquartile Difference (MS Excel (old versions))[/C][C]2379519[/C][/ROW]
[ROW][C]Coefficient of Quartile Variation (Weighted Average at Xnp)[/C][C]0.138818933111773[/C][/ROW]
[ROW][C]Coefficient of Quartile Variation (Weighted Average at X(n+1)p)[/C][C]0.140235479540641[/C][/ROW]
[ROW][C]Coefficient of Quartile Variation (Empirical Distribution Function)[/C][C]0.138818933111773[/C][/ROW]
[ROW][C]Coefficient of Quartile Variation (Empirical Distribution Function - Averaging)[/C][C]0.139674172404625[/C][/ROW]
[ROW][C]Coefficient of Quartile Variation (Empirical Distribution Function - Interpolation)[/C][C]0.139112286176382[/C][/ROW]
[ROW][C]Coefficient of Quartile Variation (Closest Observation)[/C][C]0.138818933111773[/C][/ROW]
[ROW][C]Coefficient of Quartile Variation (True Basic - Statistics Graphics Toolkit)[/C][C]0.139112286176382[/C][/ROW]
[ROW][C]Coefficient of Quartile Variation (MS Excel (old versions))[/C][C]0.140796208479207[/C][/ROW]
[ROW][C]Number of all Pairs of Observations[/C][C]5356[/C][/ROW]
[ROW][C]Squared Differences between all Pairs of Observations[/C][C]28191779298272.1[/C][/ROW]
[ROW][C]Mean Absolute Differences between all Pairs of Observations[/C][C]4118118.88125467[/C][/ROW]
[ROW][C]Gini Mean Difference[/C][C]4118118.88125467[/C][/ROW]
[ROW][C]Leik Measure of Dispersion[/C][C]0.492026927252605[/C][/ROW]
[ROW][C]Index of Diversity[/C][C]0.989929154311385[/C][/ROW]
[ROW][C]Index of Qualitative Variation[/C][C]0.999540116974602[/C][/ROW]
[ROW][C]Coefficient of Dispersion[/C][C]0.165823114981788[/C][/ROW]
[ROW][C]Observations[/C][C]104[/C][/ROW]
[/TABLE]
Source: https://freestatistics.org/blog/index.php?pk=111366&T=2

Globally Unique Identifier (entire table): ba.freestatistics.org/blog/index.php?pk=111366&T=2

As an alternative you can also use a QR Code:  

The GUIDs for individual cells are displayed in the table below:

Variability - Ungrouped Data
Absolute range24459300
Relative range (unbiased)6.51475035519945
Relative range (biased)6.54629896758497
Variance (unbiased)14095889649136.2
Variance (biased)13960352248663.7
Standard Deviation (unbiased)3754449.31369917
Standard Deviation (biased)3736355.47675321
Coefficient of Variation (unbiased)0.21869575816968
Coefficient of Variation (biased)0.217641796574126
Mean Squared Error (MSE versus 0)308681820507053
Mean Squared Error (MSE versus Mean)13960352248663.7
Mean Absolute Deviation from Mean (MAD Mean)2881323.625
Mean Absolute Deviation from Median (MAD Median)2875777.36538462
Median Absolute Deviation from Mean2510250
Median Absolute Deviation from Median2558390
Mean Squared Deviation from Mean13960352248663.7
Mean Squared Deviation from Median14003796459936.3
Interquartile Difference (Weighted Average at Xnp)4681431
Interquartile Difference (Weighted Average at X(n+1)p)4737643.5
Interquartile Difference (Empirical Distribution Function)4681431
Interquartile Difference (Empirical Distribution Function - Averaging)4716249
Interquartile Difference (Empirical Distribution Function - Interpolation)4694854.5
Interquartile Difference (Closest Observation)4681431
Interquartile Difference (True Basic - Statistics Graphics Toolkit)4694854.5
Interquartile Difference (MS Excel (old versions))4759038
Semi Interquartile Difference (Weighted Average at Xnp)2340715.5
Semi Interquartile Difference (Weighted Average at X(n+1)p)2368821.75
Semi Interquartile Difference (Empirical Distribution Function)2340715.5
Semi Interquartile Difference (Empirical Distribution Function - Averaging)2358124.5
Semi Interquartile Difference (Empirical Distribution Function - Interpolation)2347427.25
Semi Interquartile Difference (Closest Observation)2340715.5
Semi Interquartile Difference (True Basic - Statistics Graphics Toolkit)2347427.25
Semi Interquartile Difference (MS Excel (old versions))2379519
Coefficient of Quartile Variation (Weighted Average at Xnp)0.138818933111773
Coefficient of Quartile Variation (Weighted Average at X(n+1)p)0.140235479540641
Coefficient of Quartile Variation (Empirical Distribution Function)0.138818933111773
Coefficient of Quartile Variation (Empirical Distribution Function - Averaging)0.139674172404625
Coefficient of Quartile Variation (Empirical Distribution Function - Interpolation)0.139112286176382
Coefficient of Quartile Variation (Closest Observation)0.138818933111773
Coefficient of Quartile Variation (True Basic - Statistics Graphics Toolkit)0.139112286176382
Coefficient of Quartile Variation (MS Excel (old versions))0.140796208479207
Number of all Pairs of Observations5356
Squared Differences between all Pairs of Observations28191779298272.1
Mean Absolute Differences between all Pairs of Observations4118118.88125467
Gini Mean Difference4118118.88125467
Leik Measure of Dispersion0.492026927252605
Index of Diversity0.989929154311385
Index of Qualitative Variation0.999540116974602
Coefficient of Dispersion0.165823114981788
Observations104


Percentiles - Ungrouped Data
pWeighted Average at XnpWeighted Average at X(n+1)pEmpirical Distribution FunctionEmpirical Distribution Function - AveragingEmpirical Distribution Function - InterpolationClosest ObservationTrue Basic - Statistics Graphics ToolkitMS Excel (old versions)
0.011006650410067655101770001017700010196310.4100619001017124510061900
0.0210228494.410241368108206801082068010829682.4101770001075631210177000
0.0310838684.810843186109707201097072010987440.2108206801094821410820680
0.0411000444.811007876111565001115650011171836109707201111934410970720
0.051118206011188450112843001128430011315513.5111565001125235011156500
0.0611334241.611346727114923901149239011501131.34112843001142996311284300
0.0711505987.6411509387.05115409531154095311623471.871149239011523955.9511492390
0.0811666696.0411698131.81193390011933900119946921154095311776721.211540953
0.091202508812047885121872001218720012201024119339001207321511933900
0.11220768012212800122384001223840012259850121872001221280012212800
0.111226986012277725123099001230990012408801122384001227057512309900
0.121245375612489720126096001260960012707541.96123099001242978012609600
0.1312751071.7212786439.65128816611288166112993957.211288166112704821.3512881661
0.1413042906.8413083218.3131696001316960013225885.881316960012968042.713169600
0.1513250008.413270110.5133036141330361413336097.71330361413203103.513303614
0.1613349813.0413361362.8133758001337580013461498.721337580013318051.213375800
0.1713497206.5213527558.15135543391355433913564930.171355433913402580.8513554339
0.1813569291.2413573029.3135751061357510613800671.561357510613556415.713575106
0.1913892568.6413971934.31399282013992820140096351399282013595991.713992820
0.21401642014022320140223201402232014099814.8140223201402232014022320
0.2114130812.7214152504.55141514781415147814164412.531415147814170982.4514151478
0.2214169545.2814179608.5141720091417200914222165.71417200914240404.514172009
0.2314241924.414261698.4142480041424800414310998.241424800414325605.614248004
0.2414335648.1614375625.8143393001433930014470072.881433930014484603.214339300
0.251452092914522921.751452092914524914.514526907.251452092914526907.2514520929
0.261453069414542355145737501457375014563883145289001456029514528900
0.271458076214604427.5146614001466140014644746.51457375014630722.514573750
0.2814669280.414687668147270701472707014716562.8146614001470080214661400
0.2914729820.5614734805.95147442611474426114742026.171472707014736525.0514727070
0.314756592.814775090.5148059201480592014799754.11474426114775090.514775090.5
0.3114832699.214867289149175001491750014909689.4148059201485613114917500
0.3214992611.9615078454.2151857571518575715175026.721491750015024802.815185757
0.3315261354.7615339314.95154220001542200015419637.571518575715268442.0515422000
0.3415427336.6415432376.8154368241543682415439319.521542200015426447.215436824
0.3515486734.415530406155616001556160015567788154368241546801815561600
0.3615616054.415660608156853601568536015693659.2155616001558635215685360
0.3715735155.215773539157891001578910015798978156853601570092115789100
0.381583579615869920158789001587890015878942158789001579808015878900
0.391587906815879185158792001587920016002178158792001587891515879200
0.41631324016602600166026001660260016629322166026001660260016602600
0.4116688110.416746460.35167362101673621016783361.611673621016930966.6516736210
0.4216875614.7616942895.3169412171694121716945580.581694121716956321.716941217
0.4316953300.7616964709.5169580001695800016970971.71695800016996020.516958000
0.4416991994.817003853.4170027301700273017004527.441700273017007223.617002730
0.4517007223.617039060.25170083471700834717051345.551700834717100486.7517008347
0.4617111543.5217131770171312001713120017131922171312001713253017131200
0.471713287217136386.5171331001713310017136949.91713310017139203.517133100
0.4817141738.817200174171424901714249017205942.4171424901722901617142490
0.4917280931.617309160.85172867001728670017310159.111728670017314152.1517286700
0.51733661317375886.51733661317375886.517375886.51733661317375886.517375886.5
0.5117422280.5217513067.15175931731759317317509506.891741516017495265.8517593173
0.5217594119.1617600269.2176050001760500017599796.121759317317597903.817605000
0.5317608463.0817623758.35176338591763385917622026.811760500017615100.6517633859
0.5417660558.8417750670.8178007331780073317737320.881763385917683921.217800733
0.5517810346.417836783.25178488001784880017831976.551780073317812749.7517848800
0.5617852877.617862392178657901786579017860353.2178488001785219817865790
0.5717883715.617920207179298101792981017911244.2178657901787539317929810
0.5817936328.417948143179501801795018017944883.8179298101793184717950180
0.5917950822.617951875.75179519651795196517951554.451795018017950269.2517951965
0.61799357918056000180560001805600018035193179519651805600018056000
0.611806546018081360180775001807750018073845180560001815084018077500
0.621811455618158118181547001815470018143892180775001818546218154700
0.6318172473.618230509.5181888801818888018185120.21818888018424780.518188880
0.6418344296.818468048184664101846641018444207.6184664101847296218466410
0.651847132418486050184746001847460018474190.5184746001850895018474600
0.661850391218529893.51852040018520400185194841852040018542551.518520400
0.6718541918.618559869.25185520451855204518552268.551855204518566575.7518552045
0.6818568140.618636640185744001857440018580624185744001866776018574400
0.691869265618767395187300001873000018735817187300001877570518730000
0.71879648018937400188131001881310018837960188131001893740018937400
0.711902192419062004.15190617001906170019061771.891906170019061948.8519062253
0.7219062186.6419075901.2190622531906225319065892.521906225319071351.819085000
0.7319083180.2419085458.9190850001908500019085134.141908500019085247.119085706
0.7419085677.7619167363.8190857061908570619111369.881908570619120702.219202360
0.751920236019260565.251920236019241163.519221761.751920236019221761.7519279967
0.7619294376.3219568153.4196402001964020019380832.241927996719352013.619640200
0.771964353619675645196819001968190019653127196402001964645519681900
0.781968426419699630197016001970160019688598196819001968387019701600
0.791971092819756985197599001975990019723171197016001970451519759900
0.81979246019922700199227001992270019825020197599001992270019922700
0.811994737220033120200255002002550019966904199227002017028020025500
0.822006817220200215.42017790020177900200956042002550020378738.620177900
0.8320249309.2820436310.9204010542040105420287245.462017790020600843.120401054
0.8420485670.5620643280206361002063610020523277.92204010542066482020636100
0.852065046020835373.752067200020672000206558452063610021162121.2520672000
0.8620959537.821352427.2213254952132549521051027.12067200021388336.821325495
0.8721368586.5221464721.9214152692141526921380257.142132549521507110.121415269
0.8821488741.8821679857.8215565632155656321505697.162155656321741505.221556563
0.8921729175.7221888020218648002186480021763081.79218648002189318021864800
0.92189576021972900219164002191640021900920219164002197290021972900
0.912198872022305830220294002202940021998890220294002225557022532000
0.922237116822542047.62253200022532000224113762253200022538698.422548746
0.9322544057.1222573611.1225487462254874622545229.342254874622562134.922587000
0.9422577819.0422588470225870002258700022580114.28225870002258763022589100
0.952258868022657500225891002258910022588785225891002261190022680300
0.962266570822736140226803002268030022669356226803002269426022750100
0.972274172423027710227501002275010022743818227501002279909023076700
0.982305057223238610230767002307670023057104230767002309469023256600
0.992324940433957970232566002325660023251203232566002381983034521200

\begin{tabular}{lllllllll}
\hline
Percentiles - Ungrouped Data \tabularnewline
p & Weighted Average at Xnp & Weighted Average at X(n+1)p & Empirical Distribution Function & Empirical Distribution Function - Averaging & Empirical Distribution Function - Interpolation & Closest Observation & True Basic - Statistics Graphics Toolkit & MS Excel (old versions) \tabularnewline
0.01 & 10066504 & 10067655 & 10177000 & 10177000 & 10196310.4 & 10061900 & 10171245 & 10061900 \tabularnewline
0.02 & 10228494.4 & 10241368 & 10820680 & 10820680 & 10829682.4 & 10177000 & 10756312 & 10177000 \tabularnewline
0.03 & 10838684.8 & 10843186 & 10970720 & 10970720 & 10987440.2 & 10820680 & 10948214 & 10820680 \tabularnewline
0.04 & 11000444.8 & 11007876 & 11156500 & 11156500 & 11171836 & 10970720 & 11119344 & 10970720 \tabularnewline
0.05 & 11182060 & 11188450 & 11284300 & 11284300 & 11315513.5 & 11156500 & 11252350 & 11156500 \tabularnewline
0.06 & 11334241.6 & 11346727 & 11492390 & 11492390 & 11501131.34 & 11284300 & 11429963 & 11284300 \tabularnewline
0.07 & 11505987.64 & 11509387.05 & 11540953 & 11540953 & 11623471.87 & 11492390 & 11523955.95 & 11492390 \tabularnewline
0.08 & 11666696.04 & 11698131.8 & 11933900 & 11933900 & 11994692 & 11540953 & 11776721.2 & 11540953 \tabularnewline
0.09 & 12025088 & 12047885 & 12187200 & 12187200 & 12201024 & 11933900 & 12073215 & 11933900 \tabularnewline
0.1 & 12207680 & 12212800 & 12238400 & 12238400 & 12259850 & 12187200 & 12212800 & 12212800 \tabularnewline
0.11 & 12269860 & 12277725 & 12309900 & 12309900 & 12408801 & 12238400 & 12270575 & 12309900 \tabularnewline
0.12 & 12453756 & 12489720 & 12609600 & 12609600 & 12707541.96 & 12309900 & 12429780 & 12609600 \tabularnewline
0.13 & 12751071.72 & 12786439.65 & 12881661 & 12881661 & 12993957.21 & 12881661 & 12704821.35 & 12881661 \tabularnewline
0.14 & 13042906.84 & 13083218.3 & 13169600 & 13169600 & 13225885.88 & 13169600 & 12968042.7 & 13169600 \tabularnewline
0.15 & 13250008.4 & 13270110.5 & 13303614 & 13303614 & 13336097.7 & 13303614 & 13203103.5 & 13303614 \tabularnewline
0.16 & 13349813.04 & 13361362.8 & 13375800 & 13375800 & 13461498.72 & 13375800 & 13318051.2 & 13375800 \tabularnewline
0.17 & 13497206.52 & 13527558.15 & 13554339 & 13554339 & 13564930.17 & 13554339 & 13402580.85 & 13554339 \tabularnewline
0.18 & 13569291.24 & 13573029.3 & 13575106 & 13575106 & 13800671.56 & 13575106 & 13556415.7 & 13575106 \tabularnewline
0.19 & 13892568.64 & 13971934.3 & 13992820 & 13992820 & 14009635 & 13992820 & 13595991.7 & 13992820 \tabularnewline
0.2 & 14016420 & 14022320 & 14022320 & 14022320 & 14099814.8 & 14022320 & 14022320 & 14022320 \tabularnewline
0.21 & 14130812.72 & 14152504.55 & 14151478 & 14151478 & 14164412.53 & 14151478 & 14170982.45 & 14151478 \tabularnewline
0.22 & 14169545.28 & 14179608.5 & 14172009 & 14172009 & 14222165.7 & 14172009 & 14240404.5 & 14172009 \tabularnewline
0.23 & 14241924.4 & 14261698.4 & 14248004 & 14248004 & 14310998.24 & 14248004 & 14325605.6 & 14248004 \tabularnewline
0.24 & 14335648.16 & 14375625.8 & 14339300 & 14339300 & 14470072.88 & 14339300 & 14484603.2 & 14339300 \tabularnewline
0.25 & 14520929 & 14522921.75 & 14520929 & 14524914.5 & 14526907.25 & 14520929 & 14526907.25 & 14520929 \tabularnewline
0.26 & 14530694 & 14542355 & 14573750 & 14573750 & 14563883 & 14528900 & 14560295 & 14528900 \tabularnewline
0.27 & 14580762 & 14604427.5 & 14661400 & 14661400 & 14644746.5 & 14573750 & 14630722.5 & 14573750 \tabularnewline
0.28 & 14669280.4 & 14687668 & 14727070 & 14727070 & 14716562.8 & 14661400 & 14700802 & 14661400 \tabularnewline
0.29 & 14729820.56 & 14734805.95 & 14744261 & 14744261 & 14742026.17 & 14727070 & 14736525.05 & 14727070 \tabularnewline
0.3 & 14756592.8 & 14775090.5 & 14805920 & 14805920 & 14799754.1 & 14744261 & 14775090.5 & 14775090.5 \tabularnewline
0.31 & 14832699.2 & 14867289 & 14917500 & 14917500 & 14909689.4 & 14805920 & 14856131 & 14917500 \tabularnewline
0.32 & 14992611.96 & 15078454.2 & 15185757 & 15185757 & 15175026.72 & 14917500 & 15024802.8 & 15185757 \tabularnewline
0.33 & 15261354.76 & 15339314.95 & 15422000 & 15422000 & 15419637.57 & 15185757 & 15268442.05 & 15422000 \tabularnewline
0.34 & 15427336.64 & 15432376.8 & 15436824 & 15436824 & 15439319.52 & 15422000 & 15426447.2 & 15436824 \tabularnewline
0.35 & 15486734.4 & 15530406 & 15561600 & 15561600 & 15567788 & 15436824 & 15468018 & 15561600 \tabularnewline
0.36 & 15616054.4 & 15660608 & 15685360 & 15685360 & 15693659.2 & 15561600 & 15586352 & 15685360 \tabularnewline
0.37 & 15735155.2 & 15773539 & 15789100 & 15789100 & 15798978 & 15685360 & 15700921 & 15789100 \tabularnewline
0.38 & 15835796 & 15869920 & 15878900 & 15878900 & 15878942 & 15878900 & 15798080 & 15878900 \tabularnewline
0.39 & 15879068 & 15879185 & 15879200 & 15879200 & 16002178 & 15879200 & 15878915 & 15879200 \tabularnewline
0.4 & 16313240 & 16602600 & 16602600 & 16602600 & 16629322 & 16602600 & 16602600 & 16602600 \tabularnewline
0.41 & 16688110.4 & 16746460.35 & 16736210 & 16736210 & 16783361.61 & 16736210 & 16930966.65 & 16736210 \tabularnewline
0.42 & 16875614.76 & 16942895.3 & 16941217 & 16941217 & 16945580.58 & 16941217 & 16956321.7 & 16941217 \tabularnewline
0.43 & 16953300.76 & 16964709.5 & 16958000 & 16958000 & 16970971.7 & 16958000 & 16996020.5 & 16958000 \tabularnewline
0.44 & 16991994.8 & 17003853.4 & 17002730 & 17002730 & 17004527.44 & 17002730 & 17007223.6 & 17002730 \tabularnewline
0.45 & 17007223.6 & 17039060.25 & 17008347 & 17008347 & 17051345.55 & 17008347 & 17100486.75 & 17008347 \tabularnewline
0.46 & 17111543.52 & 17131770 & 17131200 & 17131200 & 17131922 & 17131200 & 17132530 & 17131200 \tabularnewline
0.47 & 17132872 & 17136386.5 & 17133100 & 17133100 & 17136949.9 & 17133100 & 17139203.5 & 17133100 \tabularnewline
0.48 & 17141738.8 & 17200174 & 17142490 & 17142490 & 17205942.4 & 17142490 & 17229016 & 17142490 \tabularnewline
0.49 & 17280931.6 & 17309160.85 & 17286700 & 17286700 & 17310159.11 & 17286700 & 17314152.15 & 17286700 \tabularnewline
0.5 & 17336613 & 17375886.5 & 17336613 & 17375886.5 & 17375886.5 & 17336613 & 17375886.5 & 17375886.5 \tabularnewline
0.51 & 17422280.52 & 17513067.15 & 17593173 & 17593173 & 17509506.89 & 17415160 & 17495265.85 & 17593173 \tabularnewline
0.52 & 17594119.16 & 17600269.2 & 17605000 & 17605000 & 17599796.12 & 17593173 & 17597903.8 & 17605000 \tabularnewline
0.53 & 17608463.08 & 17623758.35 & 17633859 & 17633859 & 17622026.81 & 17605000 & 17615100.65 & 17633859 \tabularnewline
0.54 & 17660558.84 & 17750670.8 & 17800733 & 17800733 & 17737320.88 & 17633859 & 17683921.2 & 17800733 \tabularnewline
0.55 & 17810346.4 & 17836783.25 & 17848800 & 17848800 & 17831976.55 & 17800733 & 17812749.75 & 17848800 \tabularnewline
0.56 & 17852877.6 & 17862392 & 17865790 & 17865790 & 17860353.2 & 17848800 & 17852198 & 17865790 \tabularnewline
0.57 & 17883715.6 & 17920207 & 17929810 & 17929810 & 17911244.2 & 17865790 & 17875393 & 17929810 \tabularnewline
0.58 & 17936328.4 & 17948143 & 17950180 & 17950180 & 17944883.8 & 17929810 & 17931847 & 17950180 \tabularnewline
0.59 & 17950822.6 & 17951875.75 & 17951965 & 17951965 & 17951554.45 & 17950180 & 17950269.25 & 17951965 \tabularnewline
0.6 & 17993579 & 18056000 & 18056000 & 18056000 & 18035193 & 17951965 & 18056000 & 18056000 \tabularnewline
0.61 & 18065460 & 18081360 & 18077500 & 18077500 & 18073845 & 18056000 & 18150840 & 18077500 \tabularnewline
0.62 & 18114556 & 18158118 & 18154700 & 18154700 & 18143892 & 18077500 & 18185462 & 18154700 \tabularnewline
0.63 & 18172473.6 & 18230509.5 & 18188880 & 18188880 & 18185120.2 & 18188880 & 18424780.5 & 18188880 \tabularnewline
0.64 & 18344296.8 & 18468048 & 18466410 & 18466410 & 18444207.6 & 18466410 & 18472962 & 18466410 \tabularnewline
0.65 & 18471324 & 18486050 & 18474600 & 18474600 & 18474190.5 & 18474600 & 18508950 & 18474600 \tabularnewline
0.66 & 18503912 & 18529893.5 & 18520400 & 18520400 & 18519484 & 18520400 & 18542551.5 & 18520400 \tabularnewline
0.67 & 18541918.6 & 18559869.25 & 18552045 & 18552045 & 18552268.55 & 18552045 & 18566575.75 & 18552045 \tabularnewline
0.68 & 18568140.6 & 18636640 & 18574400 & 18574400 & 18580624 & 18574400 & 18667760 & 18574400 \tabularnewline
0.69 & 18692656 & 18767395 & 18730000 & 18730000 & 18735817 & 18730000 & 18775705 & 18730000 \tabularnewline
0.7 & 18796480 & 18937400 & 18813100 & 18813100 & 18837960 & 18813100 & 18937400 & 18937400 \tabularnewline
0.71 & 19021924 & 19062004.15 & 19061700 & 19061700 & 19061771.89 & 19061700 & 19061948.85 & 19062253 \tabularnewline
0.72 & 19062186.64 & 19075901.2 & 19062253 & 19062253 & 19065892.52 & 19062253 & 19071351.8 & 19085000 \tabularnewline
0.73 & 19083180.24 & 19085458.9 & 19085000 & 19085000 & 19085134.14 & 19085000 & 19085247.1 & 19085706 \tabularnewline
0.74 & 19085677.76 & 19167363.8 & 19085706 & 19085706 & 19111369.88 & 19085706 & 19120702.2 & 19202360 \tabularnewline
0.75 & 19202360 & 19260565.25 & 19202360 & 19241163.5 & 19221761.75 & 19202360 & 19221761.75 & 19279967 \tabularnewline
0.76 & 19294376.32 & 19568153.4 & 19640200 & 19640200 & 19380832.24 & 19279967 & 19352013.6 & 19640200 \tabularnewline
0.77 & 19643536 & 19675645 & 19681900 & 19681900 & 19653127 & 19640200 & 19646455 & 19681900 \tabularnewline
0.78 & 19684264 & 19699630 & 19701600 & 19701600 & 19688598 & 19681900 & 19683870 & 19701600 \tabularnewline
0.79 & 19710928 & 19756985 & 19759900 & 19759900 & 19723171 & 19701600 & 19704515 & 19759900 \tabularnewline
0.8 & 19792460 & 19922700 & 19922700 & 19922700 & 19825020 & 19759900 & 19922700 & 19922700 \tabularnewline
0.81 & 19947372 & 20033120 & 20025500 & 20025500 & 19966904 & 19922700 & 20170280 & 20025500 \tabularnewline
0.82 & 20068172 & 20200215.4 & 20177900 & 20177900 & 20095604 & 20025500 & 20378738.6 & 20177900 \tabularnewline
0.83 & 20249309.28 & 20436310.9 & 20401054 & 20401054 & 20287245.46 & 20177900 & 20600843.1 & 20401054 \tabularnewline
0.84 & 20485670.56 & 20643280 & 20636100 & 20636100 & 20523277.92 & 20401054 & 20664820 & 20636100 \tabularnewline
0.85 & 20650460 & 20835373.75 & 20672000 & 20672000 & 20655845 & 20636100 & 21162121.25 & 20672000 \tabularnewline
0.86 & 20959537.8 & 21352427.2 & 21325495 & 21325495 & 21051027.1 & 20672000 & 21388336.8 & 21325495 \tabularnewline
0.87 & 21368586.52 & 21464721.9 & 21415269 & 21415269 & 21380257.14 & 21325495 & 21507110.1 & 21415269 \tabularnewline
0.88 & 21488741.88 & 21679857.8 & 21556563 & 21556563 & 21505697.16 & 21556563 & 21741505.2 & 21556563 \tabularnewline
0.89 & 21729175.72 & 21888020 & 21864800 & 21864800 & 21763081.79 & 21864800 & 21893180 & 21864800 \tabularnewline
0.9 & 21895760 & 21972900 & 21916400 & 21916400 & 21900920 & 21916400 & 21972900 & 21972900 \tabularnewline
0.91 & 21988720 & 22305830 & 22029400 & 22029400 & 21998890 & 22029400 & 22255570 & 22532000 \tabularnewline
0.92 & 22371168 & 22542047.6 & 22532000 & 22532000 & 22411376 & 22532000 & 22538698.4 & 22548746 \tabularnewline
0.93 & 22544057.12 & 22573611.1 & 22548746 & 22548746 & 22545229.34 & 22548746 & 22562134.9 & 22587000 \tabularnewline
0.94 & 22577819.04 & 22588470 & 22587000 & 22587000 & 22580114.28 & 22587000 & 22587630 & 22589100 \tabularnewline
0.95 & 22588680 & 22657500 & 22589100 & 22589100 & 22588785 & 22589100 & 22611900 & 22680300 \tabularnewline
0.96 & 22665708 & 22736140 & 22680300 & 22680300 & 22669356 & 22680300 & 22694260 & 22750100 \tabularnewline
0.97 & 22741724 & 23027710 & 22750100 & 22750100 & 22743818 & 22750100 & 22799090 & 23076700 \tabularnewline
0.98 & 23050572 & 23238610 & 23076700 & 23076700 & 23057104 & 23076700 & 23094690 & 23256600 \tabularnewline
0.99 & 23249404 & 33957970 & 23256600 & 23256600 & 23251203 & 23256600 & 23819830 & 34521200 \tabularnewline
\hline
\end{tabular}
%Source: https://freestatistics.org/blog/index.php?pk=111366&T=3

[TABLE]
[ROW][C]Percentiles - Ungrouped Data[/C][/ROW]
[ROW][C]p[/C][C]Weighted Average at Xnp[/C][C]Weighted Average at X(n+1)p[/C][C]Empirical Distribution Function[/C][C]Empirical Distribution Function - Averaging[/C][C]Empirical Distribution Function - Interpolation[/C][C]Closest Observation[/C][C]True Basic - Statistics Graphics Toolkit[/C][C]MS Excel (old versions)[/C][/ROW]
[ROW][C]0.01[/C][C]10066504[/C][C]10067655[/C][C]10177000[/C][C]10177000[/C][C]10196310.4[/C][C]10061900[/C][C]10171245[/C][C]10061900[/C][/ROW]
[ROW][C]0.02[/C][C]10228494.4[/C][C]10241368[/C][C]10820680[/C][C]10820680[/C][C]10829682.4[/C][C]10177000[/C][C]10756312[/C][C]10177000[/C][/ROW]
[ROW][C]0.03[/C][C]10838684.8[/C][C]10843186[/C][C]10970720[/C][C]10970720[/C][C]10987440.2[/C][C]10820680[/C][C]10948214[/C][C]10820680[/C][/ROW]
[ROW][C]0.04[/C][C]11000444.8[/C][C]11007876[/C][C]11156500[/C][C]11156500[/C][C]11171836[/C][C]10970720[/C][C]11119344[/C][C]10970720[/C][/ROW]
[ROW][C]0.05[/C][C]11182060[/C][C]11188450[/C][C]11284300[/C][C]11284300[/C][C]11315513.5[/C][C]11156500[/C][C]11252350[/C][C]11156500[/C][/ROW]
[ROW][C]0.06[/C][C]11334241.6[/C][C]11346727[/C][C]11492390[/C][C]11492390[/C][C]11501131.34[/C][C]11284300[/C][C]11429963[/C][C]11284300[/C][/ROW]
[ROW][C]0.07[/C][C]11505987.64[/C][C]11509387.05[/C][C]11540953[/C][C]11540953[/C][C]11623471.87[/C][C]11492390[/C][C]11523955.95[/C][C]11492390[/C][/ROW]
[ROW][C]0.08[/C][C]11666696.04[/C][C]11698131.8[/C][C]11933900[/C][C]11933900[/C][C]11994692[/C][C]11540953[/C][C]11776721.2[/C][C]11540953[/C][/ROW]
[ROW][C]0.09[/C][C]12025088[/C][C]12047885[/C][C]12187200[/C][C]12187200[/C][C]12201024[/C][C]11933900[/C][C]12073215[/C][C]11933900[/C][/ROW]
[ROW][C]0.1[/C][C]12207680[/C][C]12212800[/C][C]12238400[/C][C]12238400[/C][C]12259850[/C][C]12187200[/C][C]12212800[/C][C]12212800[/C][/ROW]
[ROW][C]0.11[/C][C]12269860[/C][C]12277725[/C][C]12309900[/C][C]12309900[/C][C]12408801[/C][C]12238400[/C][C]12270575[/C][C]12309900[/C][/ROW]
[ROW][C]0.12[/C][C]12453756[/C][C]12489720[/C][C]12609600[/C][C]12609600[/C][C]12707541.96[/C][C]12309900[/C][C]12429780[/C][C]12609600[/C][/ROW]
[ROW][C]0.13[/C][C]12751071.72[/C][C]12786439.65[/C][C]12881661[/C][C]12881661[/C][C]12993957.21[/C][C]12881661[/C][C]12704821.35[/C][C]12881661[/C][/ROW]
[ROW][C]0.14[/C][C]13042906.84[/C][C]13083218.3[/C][C]13169600[/C][C]13169600[/C][C]13225885.88[/C][C]13169600[/C][C]12968042.7[/C][C]13169600[/C][/ROW]
[ROW][C]0.15[/C][C]13250008.4[/C][C]13270110.5[/C][C]13303614[/C][C]13303614[/C][C]13336097.7[/C][C]13303614[/C][C]13203103.5[/C][C]13303614[/C][/ROW]
[ROW][C]0.16[/C][C]13349813.04[/C][C]13361362.8[/C][C]13375800[/C][C]13375800[/C][C]13461498.72[/C][C]13375800[/C][C]13318051.2[/C][C]13375800[/C][/ROW]
[ROW][C]0.17[/C][C]13497206.52[/C][C]13527558.15[/C][C]13554339[/C][C]13554339[/C][C]13564930.17[/C][C]13554339[/C][C]13402580.85[/C][C]13554339[/C][/ROW]
[ROW][C]0.18[/C][C]13569291.24[/C][C]13573029.3[/C][C]13575106[/C][C]13575106[/C][C]13800671.56[/C][C]13575106[/C][C]13556415.7[/C][C]13575106[/C][/ROW]
[ROW][C]0.19[/C][C]13892568.64[/C][C]13971934.3[/C][C]13992820[/C][C]13992820[/C][C]14009635[/C][C]13992820[/C][C]13595991.7[/C][C]13992820[/C][/ROW]
[ROW][C]0.2[/C][C]14016420[/C][C]14022320[/C][C]14022320[/C][C]14022320[/C][C]14099814.8[/C][C]14022320[/C][C]14022320[/C][C]14022320[/C][/ROW]
[ROW][C]0.21[/C][C]14130812.72[/C][C]14152504.55[/C][C]14151478[/C][C]14151478[/C][C]14164412.53[/C][C]14151478[/C][C]14170982.45[/C][C]14151478[/C][/ROW]
[ROW][C]0.22[/C][C]14169545.28[/C][C]14179608.5[/C][C]14172009[/C][C]14172009[/C][C]14222165.7[/C][C]14172009[/C][C]14240404.5[/C][C]14172009[/C][/ROW]
[ROW][C]0.23[/C][C]14241924.4[/C][C]14261698.4[/C][C]14248004[/C][C]14248004[/C][C]14310998.24[/C][C]14248004[/C][C]14325605.6[/C][C]14248004[/C][/ROW]
[ROW][C]0.24[/C][C]14335648.16[/C][C]14375625.8[/C][C]14339300[/C][C]14339300[/C][C]14470072.88[/C][C]14339300[/C][C]14484603.2[/C][C]14339300[/C][/ROW]
[ROW][C]0.25[/C][C]14520929[/C][C]14522921.75[/C][C]14520929[/C][C]14524914.5[/C][C]14526907.25[/C][C]14520929[/C][C]14526907.25[/C][C]14520929[/C][/ROW]
[ROW][C]0.26[/C][C]14530694[/C][C]14542355[/C][C]14573750[/C][C]14573750[/C][C]14563883[/C][C]14528900[/C][C]14560295[/C][C]14528900[/C][/ROW]
[ROW][C]0.27[/C][C]14580762[/C][C]14604427.5[/C][C]14661400[/C][C]14661400[/C][C]14644746.5[/C][C]14573750[/C][C]14630722.5[/C][C]14573750[/C][/ROW]
[ROW][C]0.28[/C][C]14669280.4[/C][C]14687668[/C][C]14727070[/C][C]14727070[/C][C]14716562.8[/C][C]14661400[/C][C]14700802[/C][C]14661400[/C][/ROW]
[ROW][C]0.29[/C][C]14729820.56[/C][C]14734805.95[/C][C]14744261[/C][C]14744261[/C][C]14742026.17[/C][C]14727070[/C][C]14736525.05[/C][C]14727070[/C][/ROW]
[ROW][C]0.3[/C][C]14756592.8[/C][C]14775090.5[/C][C]14805920[/C][C]14805920[/C][C]14799754.1[/C][C]14744261[/C][C]14775090.5[/C][C]14775090.5[/C][/ROW]
[ROW][C]0.31[/C][C]14832699.2[/C][C]14867289[/C][C]14917500[/C][C]14917500[/C][C]14909689.4[/C][C]14805920[/C][C]14856131[/C][C]14917500[/C][/ROW]
[ROW][C]0.32[/C][C]14992611.96[/C][C]15078454.2[/C][C]15185757[/C][C]15185757[/C][C]15175026.72[/C][C]14917500[/C][C]15024802.8[/C][C]15185757[/C][/ROW]
[ROW][C]0.33[/C][C]15261354.76[/C][C]15339314.95[/C][C]15422000[/C][C]15422000[/C][C]15419637.57[/C][C]15185757[/C][C]15268442.05[/C][C]15422000[/C][/ROW]
[ROW][C]0.34[/C][C]15427336.64[/C][C]15432376.8[/C][C]15436824[/C][C]15436824[/C][C]15439319.52[/C][C]15422000[/C][C]15426447.2[/C][C]15436824[/C][/ROW]
[ROW][C]0.35[/C][C]15486734.4[/C][C]15530406[/C][C]15561600[/C][C]15561600[/C][C]15567788[/C][C]15436824[/C][C]15468018[/C][C]15561600[/C][/ROW]
[ROW][C]0.36[/C][C]15616054.4[/C][C]15660608[/C][C]15685360[/C][C]15685360[/C][C]15693659.2[/C][C]15561600[/C][C]15586352[/C][C]15685360[/C][/ROW]
[ROW][C]0.37[/C][C]15735155.2[/C][C]15773539[/C][C]15789100[/C][C]15789100[/C][C]15798978[/C][C]15685360[/C][C]15700921[/C][C]15789100[/C][/ROW]
[ROW][C]0.38[/C][C]15835796[/C][C]15869920[/C][C]15878900[/C][C]15878900[/C][C]15878942[/C][C]15878900[/C][C]15798080[/C][C]15878900[/C][/ROW]
[ROW][C]0.39[/C][C]15879068[/C][C]15879185[/C][C]15879200[/C][C]15879200[/C][C]16002178[/C][C]15879200[/C][C]15878915[/C][C]15879200[/C][/ROW]
[ROW][C]0.4[/C][C]16313240[/C][C]16602600[/C][C]16602600[/C][C]16602600[/C][C]16629322[/C][C]16602600[/C][C]16602600[/C][C]16602600[/C][/ROW]
[ROW][C]0.41[/C][C]16688110.4[/C][C]16746460.35[/C][C]16736210[/C][C]16736210[/C][C]16783361.61[/C][C]16736210[/C][C]16930966.65[/C][C]16736210[/C][/ROW]
[ROW][C]0.42[/C][C]16875614.76[/C][C]16942895.3[/C][C]16941217[/C][C]16941217[/C][C]16945580.58[/C][C]16941217[/C][C]16956321.7[/C][C]16941217[/C][/ROW]
[ROW][C]0.43[/C][C]16953300.76[/C][C]16964709.5[/C][C]16958000[/C][C]16958000[/C][C]16970971.7[/C][C]16958000[/C][C]16996020.5[/C][C]16958000[/C][/ROW]
[ROW][C]0.44[/C][C]16991994.8[/C][C]17003853.4[/C][C]17002730[/C][C]17002730[/C][C]17004527.44[/C][C]17002730[/C][C]17007223.6[/C][C]17002730[/C][/ROW]
[ROW][C]0.45[/C][C]17007223.6[/C][C]17039060.25[/C][C]17008347[/C][C]17008347[/C][C]17051345.55[/C][C]17008347[/C][C]17100486.75[/C][C]17008347[/C][/ROW]
[ROW][C]0.46[/C][C]17111543.52[/C][C]17131770[/C][C]17131200[/C][C]17131200[/C][C]17131922[/C][C]17131200[/C][C]17132530[/C][C]17131200[/C][/ROW]
[ROW][C]0.47[/C][C]17132872[/C][C]17136386.5[/C][C]17133100[/C][C]17133100[/C][C]17136949.9[/C][C]17133100[/C][C]17139203.5[/C][C]17133100[/C][/ROW]
[ROW][C]0.48[/C][C]17141738.8[/C][C]17200174[/C][C]17142490[/C][C]17142490[/C][C]17205942.4[/C][C]17142490[/C][C]17229016[/C][C]17142490[/C][/ROW]
[ROW][C]0.49[/C][C]17280931.6[/C][C]17309160.85[/C][C]17286700[/C][C]17286700[/C][C]17310159.11[/C][C]17286700[/C][C]17314152.15[/C][C]17286700[/C][/ROW]
[ROW][C]0.5[/C][C]17336613[/C][C]17375886.5[/C][C]17336613[/C][C]17375886.5[/C][C]17375886.5[/C][C]17336613[/C][C]17375886.5[/C][C]17375886.5[/C][/ROW]
[ROW][C]0.51[/C][C]17422280.52[/C][C]17513067.15[/C][C]17593173[/C][C]17593173[/C][C]17509506.89[/C][C]17415160[/C][C]17495265.85[/C][C]17593173[/C][/ROW]
[ROW][C]0.52[/C][C]17594119.16[/C][C]17600269.2[/C][C]17605000[/C][C]17605000[/C][C]17599796.12[/C][C]17593173[/C][C]17597903.8[/C][C]17605000[/C][/ROW]
[ROW][C]0.53[/C][C]17608463.08[/C][C]17623758.35[/C][C]17633859[/C][C]17633859[/C][C]17622026.81[/C][C]17605000[/C][C]17615100.65[/C][C]17633859[/C][/ROW]
[ROW][C]0.54[/C][C]17660558.84[/C][C]17750670.8[/C][C]17800733[/C][C]17800733[/C][C]17737320.88[/C][C]17633859[/C][C]17683921.2[/C][C]17800733[/C][/ROW]
[ROW][C]0.55[/C][C]17810346.4[/C][C]17836783.25[/C][C]17848800[/C][C]17848800[/C][C]17831976.55[/C][C]17800733[/C][C]17812749.75[/C][C]17848800[/C][/ROW]
[ROW][C]0.56[/C][C]17852877.6[/C][C]17862392[/C][C]17865790[/C][C]17865790[/C][C]17860353.2[/C][C]17848800[/C][C]17852198[/C][C]17865790[/C][/ROW]
[ROW][C]0.57[/C][C]17883715.6[/C][C]17920207[/C][C]17929810[/C][C]17929810[/C][C]17911244.2[/C][C]17865790[/C][C]17875393[/C][C]17929810[/C][/ROW]
[ROW][C]0.58[/C][C]17936328.4[/C][C]17948143[/C][C]17950180[/C][C]17950180[/C][C]17944883.8[/C][C]17929810[/C][C]17931847[/C][C]17950180[/C][/ROW]
[ROW][C]0.59[/C][C]17950822.6[/C][C]17951875.75[/C][C]17951965[/C][C]17951965[/C][C]17951554.45[/C][C]17950180[/C][C]17950269.25[/C][C]17951965[/C][/ROW]
[ROW][C]0.6[/C][C]17993579[/C][C]18056000[/C][C]18056000[/C][C]18056000[/C][C]18035193[/C][C]17951965[/C][C]18056000[/C][C]18056000[/C][/ROW]
[ROW][C]0.61[/C][C]18065460[/C][C]18081360[/C][C]18077500[/C][C]18077500[/C][C]18073845[/C][C]18056000[/C][C]18150840[/C][C]18077500[/C][/ROW]
[ROW][C]0.62[/C][C]18114556[/C][C]18158118[/C][C]18154700[/C][C]18154700[/C][C]18143892[/C][C]18077500[/C][C]18185462[/C][C]18154700[/C][/ROW]
[ROW][C]0.63[/C][C]18172473.6[/C][C]18230509.5[/C][C]18188880[/C][C]18188880[/C][C]18185120.2[/C][C]18188880[/C][C]18424780.5[/C][C]18188880[/C][/ROW]
[ROW][C]0.64[/C][C]18344296.8[/C][C]18468048[/C][C]18466410[/C][C]18466410[/C][C]18444207.6[/C][C]18466410[/C][C]18472962[/C][C]18466410[/C][/ROW]
[ROW][C]0.65[/C][C]18471324[/C][C]18486050[/C][C]18474600[/C][C]18474600[/C][C]18474190.5[/C][C]18474600[/C][C]18508950[/C][C]18474600[/C][/ROW]
[ROW][C]0.66[/C][C]18503912[/C][C]18529893.5[/C][C]18520400[/C][C]18520400[/C][C]18519484[/C][C]18520400[/C][C]18542551.5[/C][C]18520400[/C][/ROW]
[ROW][C]0.67[/C][C]18541918.6[/C][C]18559869.25[/C][C]18552045[/C][C]18552045[/C][C]18552268.55[/C][C]18552045[/C][C]18566575.75[/C][C]18552045[/C][/ROW]
[ROW][C]0.68[/C][C]18568140.6[/C][C]18636640[/C][C]18574400[/C][C]18574400[/C][C]18580624[/C][C]18574400[/C][C]18667760[/C][C]18574400[/C][/ROW]
[ROW][C]0.69[/C][C]18692656[/C][C]18767395[/C][C]18730000[/C][C]18730000[/C][C]18735817[/C][C]18730000[/C][C]18775705[/C][C]18730000[/C][/ROW]
[ROW][C]0.7[/C][C]18796480[/C][C]18937400[/C][C]18813100[/C][C]18813100[/C][C]18837960[/C][C]18813100[/C][C]18937400[/C][C]18937400[/C][/ROW]
[ROW][C]0.71[/C][C]19021924[/C][C]19062004.15[/C][C]19061700[/C][C]19061700[/C][C]19061771.89[/C][C]19061700[/C][C]19061948.85[/C][C]19062253[/C][/ROW]
[ROW][C]0.72[/C][C]19062186.64[/C][C]19075901.2[/C][C]19062253[/C][C]19062253[/C][C]19065892.52[/C][C]19062253[/C][C]19071351.8[/C][C]19085000[/C][/ROW]
[ROW][C]0.73[/C][C]19083180.24[/C][C]19085458.9[/C][C]19085000[/C][C]19085000[/C][C]19085134.14[/C][C]19085000[/C][C]19085247.1[/C][C]19085706[/C][/ROW]
[ROW][C]0.74[/C][C]19085677.76[/C][C]19167363.8[/C][C]19085706[/C][C]19085706[/C][C]19111369.88[/C][C]19085706[/C][C]19120702.2[/C][C]19202360[/C][/ROW]
[ROW][C]0.75[/C][C]19202360[/C][C]19260565.25[/C][C]19202360[/C][C]19241163.5[/C][C]19221761.75[/C][C]19202360[/C][C]19221761.75[/C][C]19279967[/C][/ROW]
[ROW][C]0.76[/C][C]19294376.32[/C][C]19568153.4[/C][C]19640200[/C][C]19640200[/C][C]19380832.24[/C][C]19279967[/C][C]19352013.6[/C][C]19640200[/C][/ROW]
[ROW][C]0.77[/C][C]19643536[/C][C]19675645[/C][C]19681900[/C][C]19681900[/C][C]19653127[/C][C]19640200[/C][C]19646455[/C][C]19681900[/C][/ROW]
[ROW][C]0.78[/C][C]19684264[/C][C]19699630[/C][C]19701600[/C][C]19701600[/C][C]19688598[/C][C]19681900[/C][C]19683870[/C][C]19701600[/C][/ROW]
[ROW][C]0.79[/C][C]19710928[/C][C]19756985[/C][C]19759900[/C][C]19759900[/C][C]19723171[/C][C]19701600[/C][C]19704515[/C][C]19759900[/C][/ROW]
[ROW][C]0.8[/C][C]19792460[/C][C]19922700[/C][C]19922700[/C][C]19922700[/C][C]19825020[/C][C]19759900[/C][C]19922700[/C][C]19922700[/C][/ROW]
[ROW][C]0.81[/C][C]19947372[/C][C]20033120[/C][C]20025500[/C][C]20025500[/C][C]19966904[/C][C]19922700[/C][C]20170280[/C][C]20025500[/C][/ROW]
[ROW][C]0.82[/C][C]20068172[/C][C]20200215.4[/C][C]20177900[/C][C]20177900[/C][C]20095604[/C][C]20025500[/C][C]20378738.6[/C][C]20177900[/C][/ROW]
[ROW][C]0.83[/C][C]20249309.28[/C][C]20436310.9[/C][C]20401054[/C][C]20401054[/C][C]20287245.46[/C][C]20177900[/C][C]20600843.1[/C][C]20401054[/C][/ROW]
[ROW][C]0.84[/C][C]20485670.56[/C][C]20643280[/C][C]20636100[/C][C]20636100[/C][C]20523277.92[/C][C]20401054[/C][C]20664820[/C][C]20636100[/C][/ROW]
[ROW][C]0.85[/C][C]20650460[/C][C]20835373.75[/C][C]20672000[/C][C]20672000[/C][C]20655845[/C][C]20636100[/C][C]21162121.25[/C][C]20672000[/C][/ROW]
[ROW][C]0.86[/C][C]20959537.8[/C][C]21352427.2[/C][C]21325495[/C][C]21325495[/C][C]21051027.1[/C][C]20672000[/C][C]21388336.8[/C][C]21325495[/C][/ROW]
[ROW][C]0.87[/C][C]21368586.52[/C][C]21464721.9[/C][C]21415269[/C][C]21415269[/C][C]21380257.14[/C][C]21325495[/C][C]21507110.1[/C][C]21415269[/C][/ROW]
[ROW][C]0.88[/C][C]21488741.88[/C][C]21679857.8[/C][C]21556563[/C][C]21556563[/C][C]21505697.16[/C][C]21556563[/C][C]21741505.2[/C][C]21556563[/C][/ROW]
[ROW][C]0.89[/C][C]21729175.72[/C][C]21888020[/C][C]21864800[/C][C]21864800[/C][C]21763081.79[/C][C]21864800[/C][C]21893180[/C][C]21864800[/C][/ROW]
[ROW][C]0.9[/C][C]21895760[/C][C]21972900[/C][C]21916400[/C][C]21916400[/C][C]21900920[/C][C]21916400[/C][C]21972900[/C][C]21972900[/C][/ROW]
[ROW][C]0.91[/C][C]21988720[/C][C]22305830[/C][C]22029400[/C][C]22029400[/C][C]21998890[/C][C]22029400[/C][C]22255570[/C][C]22532000[/C][/ROW]
[ROW][C]0.92[/C][C]22371168[/C][C]22542047.6[/C][C]22532000[/C][C]22532000[/C][C]22411376[/C][C]22532000[/C][C]22538698.4[/C][C]22548746[/C][/ROW]
[ROW][C]0.93[/C][C]22544057.12[/C][C]22573611.1[/C][C]22548746[/C][C]22548746[/C][C]22545229.34[/C][C]22548746[/C][C]22562134.9[/C][C]22587000[/C][/ROW]
[ROW][C]0.94[/C][C]22577819.04[/C][C]22588470[/C][C]22587000[/C][C]22587000[/C][C]22580114.28[/C][C]22587000[/C][C]22587630[/C][C]22589100[/C][/ROW]
[ROW][C]0.95[/C][C]22588680[/C][C]22657500[/C][C]22589100[/C][C]22589100[/C][C]22588785[/C][C]22589100[/C][C]22611900[/C][C]22680300[/C][/ROW]
[ROW][C]0.96[/C][C]22665708[/C][C]22736140[/C][C]22680300[/C][C]22680300[/C][C]22669356[/C][C]22680300[/C][C]22694260[/C][C]22750100[/C][/ROW]
[ROW][C]0.97[/C][C]22741724[/C][C]23027710[/C][C]22750100[/C][C]22750100[/C][C]22743818[/C][C]22750100[/C][C]22799090[/C][C]23076700[/C][/ROW]
[ROW][C]0.98[/C][C]23050572[/C][C]23238610[/C][C]23076700[/C][C]23076700[/C][C]23057104[/C][C]23076700[/C][C]23094690[/C][C]23256600[/C][/ROW]
[ROW][C]0.99[/C][C]23249404[/C][C]33957970[/C][C]23256600[/C][C]23256600[/C][C]23251203[/C][C]23256600[/C][C]23819830[/C][C]34521200[/C][/ROW]
[/TABLE]
Source: https://freestatistics.org/blog/index.php?pk=111366&T=3

Globally Unique Identifier (entire table): ba.freestatistics.org/blog/index.php?pk=111366&T=3

As an alternative you can also use a QR Code:  

The GUIDs for individual cells are displayed in the table below:

Percentiles - Ungrouped Data
pWeighted Average at XnpWeighted Average at X(n+1)pEmpirical Distribution FunctionEmpirical Distribution Function - AveragingEmpirical Distribution Function - InterpolationClosest ObservationTrue Basic - Statistics Graphics ToolkitMS Excel (old versions)
0.011006650410067655101770001017700010196310.4100619001017124510061900
0.0210228494.410241368108206801082068010829682.4101770001075631210177000
0.0310838684.810843186109707201097072010987440.2108206801094821410820680
0.0411000444.811007876111565001115650011171836109707201111934410970720
0.051118206011188450112843001128430011315513.5111565001125235011156500
0.0611334241.611346727114923901149239011501131.34112843001142996311284300
0.0711505987.6411509387.05115409531154095311623471.871149239011523955.9511492390
0.0811666696.0411698131.81193390011933900119946921154095311776721.211540953
0.091202508812047885121872001218720012201024119339001207321511933900
0.11220768012212800122384001223840012259850121872001221280012212800
0.111226986012277725123099001230990012408801122384001227057512309900
0.121245375612489720126096001260960012707541.96123099001242978012609600
0.1312751071.7212786439.65128816611288166112993957.211288166112704821.3512881661
0.1413042906.8413083218.3131696001316960013225885.881316960012968042.713169600
0.1513250008.413270110.5133036141330361413336097.71330361413203103.513303614
0.1613349813.0413361362.8133758001337580013461498.721337580013318051.213375800
0.1713497206.5213527558.15135543391355433913564930.171355433913402580.8513554339
0.1813569291.2413573029.3135751061357510613800671.561357510613556415.713575106
0.1913892568.6413971934.31399282013992820140096351399282013595991.713992820
0.21401642014022320140223201402232014099814.8140223201402232014022320
0.2114130812.7214152504.55141514781415147814164412.531415147814170982.4514151478
0.2214169545.2814179608.5141720091417200914222165.71417200914240404.514172009
0.2314241924.414261698.4142480041424800414310998.241424800414325605.614248004
0.2414335648.1614375625.8143393001433930014470072.881433930014484603.214339300
0.251452092914522921.751452092914524914.514526907.251452092914526907.2514520929
0.261453069414542355145737501457375014563883145289001456029514528900
0.271458076214604427.5146614001466140014644746.51457375014630722.514573750
0.2814669280.414687668147270701472707014716562.8146614001470080214661400
0.2914729820.5614734805.95147442611474426114742026.171472707014736525.0514727070
0.314756592.814775090.5148059201480592014799754.11474426114775090.514775090.5
0.3114832699.214867289149175001491750014909689.4148059201485613114917500
0.3214992611.9615078454.2151857571518575715175026.721491750015024802.815185757
0.3315261354.7615339314.95154220001542200015419637.571518575715268442.0515422000
0.3415427336.6415432376.8154368241543682415439319.521542200015426447.215436824
0.3515486734.415530406155616001556160015567788154368241546801815561600
0.3615616054.415660608156853601568536015693659.2155616001558635215685360
0.3715735155.215773539157891001578910015798978156853601570092115789100
0.381583579615869920158789001587890015878942158789001579808015878900
0.391587906815879185158792001587920016002178158792001587891515879200
0.41631324016602600166026001660260016629322166026001660260016602600
0.4116688110.416746460.35167362101673621016783361.611673621016930966.6516736210
0.4216875614.7616942895.3169412171694121716945580.581694121716956321.716941217
0.4316953300.7616964709.5169580001695800016970971.71695800016996020.516958000
0.4416991994.817003853.4170027301700273017004527.441700273017007223.617002730
0.4517007223.617039060.25170083471700834717051345.551700834717100486.7517008347
0.4617111543.5217131770171312001713120017131922171312001713253017131200
0.471713287217136386.5171331001713310017136949.91713310017139203.517133100
0.4817141738.817200174171424901714249017205942.4171424901722901617142490
0.4917280931.617309160.85172867001728670017310159.111728670017314152.1517286700
0.51733661317375886.51733661317375886.517375886.51733661317375886.517375886.5
0.5117422280.5217513067.15175931731759317317509506.891741516017495265.8517593173
0.5217594119.1617600269.2176050001760500017599796.121759317317597903.817605000
0.5317608463.0817623758.35176338591763385917622026.811760500017615100.6517633859
0.5417660558.8417750670.8178007331780073317737320.881763385917683921.217800733
0.5517810346.417836783.25178488001784880017831976.551780073317812749.7517848800
0.5617852877.617862392178657901786579017860353.2178488001785219817865790
0.5717883715.617920207179298101792981017911244.2178657901787539317929810
0.5817936328.417948143179501801795018017944883.8179298101793184717950180
0.5917950822.617951875.75179519651795196517951554.451795018017950269.2517951965
0.61799357918056000180560001805600018035193179519651805600018056000
0.611806546018081360180775001807750018073845180560001815084018077500
0.621811455618158118181547001815470018143892180775001818546218154700
0.6318172473.618230509.5181888801818888018185120.21818888018424780.518188880
0.6418344296.818468048184664101846641018444207.6184664101847296218466410
0.651847132418486050184746001847460018474190.5184746001850895018474600
0.661850391218529893.51852040018520400185194841852040018542551.518520400
0.6718541918.618559869.25185520451855204518552268.551855204518566575.7518552045
0.6818568140.618636640185744001857440018580624185744001866776018574400
0.691869265618767395187300001873000018735817187300001877570518730000
0.71879648018937400188131001881310018837960188131001893740018937400
0.711902192419062004.15190617001906170019061771.891906170019061948.8519062253
0.7219062186.6419075901.2190622531906225319065892.521906225319071351.819085000
0.7319083180.2419085458.9190850001908500019085134.141908500019085247.119085706
0.7419085677.7619167363.8190857061908570619111369.881908570619120702.219202360
0.751920236019260565.251920236019241163.519221761.751920236019221761.7519279967
0.7619294376.3219568153.4196402001964020019380832.241927996719352013.619640200
0.771964353619675645196819001968190019653127196402001964645519681900
0.781968426419699630197016001970160019688598196819001968387019701600
0.791971092819756985197599001975990019723171197016001970451519759900
0.81979246019922700199227001992270019825020197599001992270019922700
0.811994737220033120200255002002550019966904199227002017028020025500
0.822006817220200215.42017790020177900200956042002550020378738.620177900
0.8320249309.2820436310.9204010542040105420287245.462017790020600843.120401054
0.8420485670.5620643280206361002063610020523277.92204010542066482020636100
0.852065046020835373.752067200020672000206558452063610021162121.2520672000
0.8620959537.821352427.2213254952132549521051027.12067200021388336.821325495
0.8721368586.5221464721.9214152692141526921380257.142132549521507110.121415269
0.8821488741.8821679857.8215565632155656321505697.162155656321741505.221556563
0.8921729175.7221888020218648002186480021763081.79218648002189318021864800
0.92189576021972900219164002191640021900920219164002197290021972900
0.912198872022305830220294002202940021998890220294002225557022532000
0.922237116822542047.62253200022532000224113762253200022538698.422548746
0.9322544057.1222573611.1225487462254874622545229.342254874622562134.922587000
0.9422577819.0422588470225870002258700022580114.28225870002258763022589100
0.952258868022657500225891002258910022588785225891002261190022680300
0.962266570822736140226803002268030022669356226803002269426022750100
0.972274172423027710227501002275010022743818227501002279909023076700
0.982305057223238610230767002307670023057104230767002309469023256600
0.992324940433957970232566002325660023251203232566002381983034521200


Frequency Table (Histogram)
BinsMidpointAbs. FrequencyRel. FrequencyCumul. Rel. Freq.Density
[1e+07,1.5e+07[12500000330.3173080.3173080
[1.5e+07,2e+07[17500000510.4903850.8076920
[2e+07,2.5e+07[22500000190.1826920.9903850
[2.5e+07,3e+07[27500000000.9903850
[3e+07,3.5e+07]3250000010.00961510

\begin{tabular}{lllllllll}
\hline
Frequency Table (Histogram) \tabularnewline
Bins & Midpoint & Abs. Frequency & Rel. Frequency & Cumul. Rel. Freq. & Density \tabularnewline
[1e+07,1.5e+07[ & 12500000 & 33 & 0.317308 & 0.317308 & 0 \tabularnewline
[1.5e+07,2e+07[ & 17500000 & 51 & 0.490385 & 0.807692 & 0 \tabularnewline
[2e+07,2.5e+07[ & 22500000 & 19 & 0.182692 & 0.990385 & 0 \tabularnewline
[2.5e+07,3e+07[ & 27500000 & 0 & 0 & 0.990385 & 0 \tabularnewline
[3e+07,3.5e+07] & 32500000 & 1 & 0.009615 & 1 & 0 \tabularnewline
\hline
\end{tabular}
%Source: https://freestatistics.org/blog/index.php?pk=111366&T=4

[TABLE]
[ROW][C]Frequency Table (Histogram)[/C][/ROW]
[ROW][C]Bins[/C][C]Midpoint[/C][C]Abs. Frequency[/C][C]Rel. Frequency[/C][C]Cumul. Rel. Freq.[/C][C]Density[/C][/ROW]
[ROW][C][1e+07,1.5e+07[[/C][C]12500000[/C][C]33[/C][C]0.317308[/C][C]0.317308[/C][C]0[/C][/ROW]
[ROW][C][1.5e+07,2e+07[[/C][C]17500000[/C][C]51[/C][C]0.490385[/C][C]0.807692[/C][C]0[/C][/ROW]
[ROW][C][2e+07,2.5e+07[[/C][C]22500000[/C][C]19[/C][C]0.182692[/C][C]0.990385[/C][C]0[/C][/ROW]
[ROW][C][2.5e+07,3e+07[[/C][C]27500000[/C][C]0[/C][C]0[/C][C]0.990385[/C][C]0[/C][/ROW]
[ROW][C][3e+07,3.5e+07][/C][C]32500000[/C][C]1[/C][C]0.009615[/C][C]1[/C][C]0[/C][/ROW]
[/TABLE]
Source: https://freestatistics.org/blog/index.php?pk=111366&T=4

Globally Unique Identifier (entire table): ba.freestatistics.org/blog/index.php?pk=111366&T=4

As an alternative you can also use a QR Code:  

The GUIDs for individual cells are displayed in the table below:

Frequency Table (Histogram)
BinsMidpointAbs. FrequencyRel. FrequencyCumul. Rel. Freq.Density
[1e+07,1.5e+07[12500000330.3173080.3173080
[1.5e+07,2e+07[17500000510.4903850.8076920
[2e+07,2.5e+07[22500000190.1826920.9903850
[2.5e+07,3e+07[27500000000.9903850
[3e+07,3.5e+07]3250000010.00961510


Properties of Density Trace
Bandwidth1245527.09813467
#Observations104

\begin{tabular}{lllllllll}
\hline
Properties of Density Trace \tabularnewline
Bandwidth & 1245527.09813467 \tabularnewline
#Observations & 104 \tabularnewline
\hline
\end{tabular}
%Source: https://freestatistics.org/blog/index.php?pk=111366&T=5

[TABLE]
[ROW][C]Properties of Density Trace[/C][/ROW]
[ROW][C]Bandwidth[/C][C]1245527.09813467[/C][/ROW]
[ROW][C]#Observations[/C][C]104[/C][/ROW]
[/TABLE]
Source: https://freestatistics.org/blog/index.php?pk=111366&T=5

Globally Unique Identifier (entire table): ba.freestatistics.org/blog/index.php?pk=111366&T=5

As an alternative you can also use a QR Code:  

The GUIDs for individual cells are displayed in the table below:

Properties of Density Trace
Bandwidth1245527.09813467
#Observations104


Parameters (Session):
par1 = 48 ; par2 = 1 ; par3 = 0 ; par4 = 0 ; par5 = 1 ; par6 = White Noise ; par7 = 0.95 ;
Parameters (R input):
R code (references can be found in the software module):
load(file='createtable')
x <-sort(x[!is.na(x)])
num <- 50
res <- array(NA,dim=c(num,3))
geomean <- function(x) {
return(exp(mean(log(x))))
}
harmean <- function(x) {
return(1/mean(1/x))
}
quamean <- function(x) {
return(sqrt(mean(x*x)))
}
winmean <- function(x) {
x <-sort(x[!is.na(x)])
n<-length(x)
denom <- 3
nodenom <- n/denom
if (nodenom>40) denom <- n/40
sqrtn = sqrt(n)
roundnodenom = floor(nodenom)
win <- array(NA,dim=c(roundnodenom,2))
for (j in 1:roundnodenom) {
win[j,1] <- (j*x[j+1]+sum(x[(j+1):(n-j)])+j*x[n-j])/n
win[j,2] <- sd(c(rep(x[j+1],j),x[(j+1):(n-j)],rep(x[n-j],j)))/sqrtn
}
return(win)
}
trimean <- function(x) {
x <-sort(x[!is.na(x)])
n<-length(x)
denom <- 3
nodenom <- n/denom
if (nodenom>40) denom <- n/40
sqrtn = sqrt(n)
roundnodenom = floor(nodenom)
tri <- array(NA,dim=c(roundnodenom,2))
for (j in 1:roundnodenom) {
tri[j,1] <- mean(x,trim=j/n)
tri[j,2] <- sd(x[(j+1):(n-j)]) / sqrt(n-j*2)
}
return(tri)
}
midrange <- function(x) {
return((max(x)+min(x))/2)
}
q1 <- function(data,n,p,i,f) {
np <- n*p;
i <<- floor(np)
f <<- np - i
qvalue <- (1-f)*data[i] + f*data[i+1]
}
q2 <- function(data,n,p,i,f) {
np <- (n+1)*p
i <<- floor(np)
f <<- np - i
qvalue <- (1-f)*data[i] + f*data[i+1]
}
q3 <- function(data,n,p,i,f) {
np <- n*p
i <<- floor(np)
f <<- np - i
if (f==0) {
qvalue <- data[i]
} else {
qvalue <- data[i+1]
}
}
q4 <- function(data,n,p,i,f) {
np <- n*p
i <<- floor(np)
f <<- np - i
if (f==0) {
qvalue <- (data[i]+data[i+1])/2
} else {
qvalue <- data[i+1]
}
}
q5 <- function(data,n,p,i,f) {
np <- (n-1)*p
i <<- floor(np)
f <<- np - i
if (f==0) {
qvalue <- data[i+1]
} else {
qvalue <- data[i+1] + f*(data[i+2]-data[i+1])
}
}
q6 <- function(data,n,p,i,f) {
np <- n*p+0.5
i <<- floor(np)
f <<- np - i
qvalue <- data[i]
}
q7 <- function(data,n,p,i,f) {
np <- (n+1)*p
i <<- floor(np)
f <<- np - i
if (f==0) {
qvalue <- data[i]
} else {
qvalue <- f*data[i] + (1-f)*data[i+1]
}
}
q8 <- function(data,n,p,i,f) {
np <- (n+1)*p
i <<- floor(np)
f <<- np - i
if (f==0) {
qvalue <- data[i]
} else {
if (f == 0.5) {
qvalue <- (data[i]+data[i+1])/2
} else {
if (f < 0.5) {
qvalue <- data[i]
} else {
qvalue <- data[i+1]
}
}
}
}
iqd <- function(x,def) {
x <-sort(x[!is.na(x)])
n<-length(x)
if (def==1) {
qvalue1 <- q1(x,n,0.25,i,f)
qvalue3 <- q1(x,n,0.75,i,f)
}
if (def==2) {
qvalue1 <- q2(x,n,0.25,i,f)
qvalue3 <- q2(x,n,0.75,i,f)
}
if (def==3) {
qvalue1 <- q3(x,n,0.25,i,f)
qvalue3 <- q3(x,n,0.75,i,f)
}
if (def==4) {
qvalue1 <- q4(x,n,0.25,i,f)
qvalue3 <- q4(x,n,0.75,i,f)
}
if (def==5) {
qvalue1 <- q5(x,n,0.25,i,f)
qvalue3 <- q5(x,n,0.75,i,f)
}
if (def==6) {
qvalue1 <- q6(x,n,0.25,i,f)
qvalue3 <- q6(x,n,0.75,i,f)
}
if (def==7) {
qvalue1 <- q7(x,n,0.25,i,f)
qvalue3 <- q7(x,n,0.75,i,f)
}
if (def==8) {
qvalue1 <- q8(x,n,0.25,i,f)
qvalue3 <- q8(x,n,0.75,i,f)
}
iqdiff <- qvalue3 - qvalue1
return(c(iqdiff,iqdiff/2,iqdiff/(qvalue3 + qvalue1)))
}
midmean <- function(x,def) {
x <-sort(x[!is.na(x)])
n<-length(x)
if (def==1) {
qvalue1 <- q1(x,n,0.25,i,f)
qvalue3 <- q1(x,n,0.75,i,f)
}
if (def==2) {
qvalue1 <- q2(x,n,0.25,i,f)
qvalue3 <- q2(x,n,0.75,i,f)
}
if (def==3) {
qvalue1 <- q3(x,n,0.25,i,f)
qvalue3 <- q3(x,n,0.75,i,f)
}
if (def==4) {
qvalue1 <- q4(x,n,0.25,i,f)
qvalue3 <- q4(x,n,0.75,i,f)
}
if (def==5) {
qvalue1 <- q5(x,n,0.25,i,f)
qvalue3 <- q5(x,n,0.75,i,f)
}
if (def==6) {
qvalue1 <- q6(x,n,0.25,i,f)
qvalue3 <- q6(x,n,0.75,i,f)
}
if (def==7) {
qvalue1 <- q7(x,n,0.25,i,f)
qvalue3 <- q7(x,n,0.75,i,f)
}
if (def==8) {
qvalue1 <- q8(x,n,0.25,i,f)
qvalue3 <- q8(x,n,0.75,i,f)
}
midm <- 0
myn <- 0
roundno4 <- round(n/4)
round3no4 <- round(3*n/4)
for (i in 1:n) {
if ((x[i]>=qvalue1) & (x[i]<=qvalue3)){
midm = midm + x[i]
myn = myn + 1
}
}
midm = midm / myn
return(midm)
}
range <- max(x) - min(x)
lx <- length(x)
biasf <- (lx-1)/lx
varx <- var(x)
bvarx <- varx*biasf
sdx <- sqrt(varx)
mx <- mean(x)
bsdx <- sqrt(bvarx)
x2 <- x*x
mse0 <- sum(x2)/lx
xmm <- x-mx
xmm2 <- xmm*xmm
msem <- sum(xmm2)/lx
axmm <- abs(x - mx)
medx <- median(x)
axmmed <- abs(x - medx)
xmmed <- x - medx
xmmed2 <- xmmed*xmmed
msemed <- sum(xmmed2)/lx
qarr <- array(NA,dim=c(8,3))
for (j in 1:8) {
qarr[j,] <- iqd(x,j)
}
sdpo <- 0
adpo <- 0
for (i in 1:(lx-1)) {
for (j in (i+1):lx) {
ldi <- x[i]-x[j]
aldi <- abs(ldi)
sdpo = sdpo + ldi * ldi
adpo = adpo + aldi
}
}
denom <- (lx*(lx-1)/2)
sdpo = sdpo / denom
adpo = adpo / denom
gmd <- 0
for (i in 1:lx) {
for (j in 1:lx) {
ldi <- abs(x[i]-x[j])
gmd = gmd + ldi
}
}
gmd <- gmd / (lx*(lx-1))
sumx <- sum(x)
pk <- x / sumx
ck <- cumsum(pk)
dk <- array(NA,dim=lx)
for (i in 1:lx) {
if (ck[i] <= 0.5) dk[i] <- ck[i] else dk[i] <- 1 - ck[i]
}
bigd <- sum(dk) * 2 / (lx-1)
iod <- 1 - sum(pk*pk)
res[1,] <- c('Absolute range','absolute.htm', range)
res[2,] <- c('Relative range (unbiased)','relative.htm', range/sd(x))
res[3,] <- c('Relative range (biased)','relative.htm', range/sqrt(varx*biasf))
res[4,] <- c('Variance (unbiased)','unbiased.htm', varx)
res[5,] <- c('Variance (biased)','biased.htm', bvarx)
res[6,] <- c('Standard Deviation (unbiased)','unbiased1.htm', sdx)
res[7,] <- c('Standard Deviation (biased)','biased1.htm', bsdx)
res[8,] <- c('Coefficient of Variation (unbiased)','variation.htm', sdx/mx)
res[9,] <- c('Coefficient of Variation (biased)','variation.htm', bsdx/mx)
res[10,] <- c('Mean Squared Error (MSE versus 0)','mse.htm', mse0)
res[11,] <- c('Mean Squared Error (MSE versus Mean)','mse.htm', msem)
res[12,] <- c('Mean Absolute Deviation from Mean (MAD Mean)', 'mean2.htm', sum(axmm)/lx)
res[13,] <- c('Mean Absolute Deviation from Median (MAD Median)', 'median1.htm', sum(axmmed)/lx)
res[14,] <- c('Median Absolute Deviation from Mean', 'mean3.htm', median(axmm))
res[15,] <- c('Median Absolute Deviation from Median', 'median2.htm', median(axmmed))
res[16,] <- c('Mean Squared Deviation from Mean', 'mean1.htm', msem)
res[17,] <- c('Mean Squared Deviation from Median', 'median.htm', msemed)
mylink1 <- hyperlink('difference.htm','Interquartile Difference','')
mylink2 <- paste(mylink1,hyperlink('method_1.htm','(Weighted Average at Xnp)',''),sep=' ')
res[18,] <- c('', mylink2, qarr[1,1])
mylink2 <- paste(mylink1,hyperlink('method_2.htm','(Weighted Average at X(n+1)p)',''),sep=' ')
res[19,] <- c('', mylink2, qarr[2,1])
mylink2 <- paste(mylink1,hyperlink('method_3.htm','(Empirical Distribution Function)',''),sep=' ')
res[20,] <- c('', mylink2, qarr[3,1])
mylink2 <- paste(mylink1,hyperlink('method_4.htm','(Empirical Distribution Function - Averaging)',''),sep=' ')
res[21,] <- c('', mylink2, qarr[4,1])
mylink2 <- paste(mylink1,hyperlink('method_5.htm','(Empirical Distribution Function - Interpolation)',''),sep=' ')
res[22,] <- c('', mylink2, qarr[5,1])
mylink2 <- paste(mylink1,hyperlink('method_6.htm','(Closest Observation)',''),sep=' ')
res[23,] <- c('', mylink2, qarr[6,1])
mylink2 <- paste(mylink1,hyperlink('method_7.htm','(True Basic - Statistics Graphics Toolkit)',''),sep=' ')
res[24,] <- c('', mylink2, qarr[7,1])
mylink2 <- paste(mylink1,hyperlink('method_8.htm','(MS Excel (old versions))',''),sep=' ')
res[25,] <- c('', mylink2, qarr[8,1])
mylink1 <- hyperlink('deviation.htm','Semi Interquartile Difference','')
mylink2 <- paste(mylink1,hyperlink('method_1.htm','(Weighted Average at Xnp)',''),sep=' ')
res[26,] <- c('', mylink2, qarr[1,2])
mylink2 <- paste(mylink1,hyperlink('method_2.htm','(Weighted Average at X(n+1)p)',''),sep=' ')
res[27,] <- c('', mylink2, qarr[2,2])
mylink2 <- paste(mylink1,hyperlink('method_3.htm','(Empirical Distribution Function)',''),sep=' ')
res[28,] <- c('', mylink2, qarr[3,2])
mylink2 <- paste(mylink1,hyperlink('method_4.htm','(Empirical Distribution Function - Averaging)',''),sep=' ')
res[29,] <- c('', mylink2, qarr[4,2])
mylink2 <- paste(mylink1,hyperlink('method_5.htm','(Empirical Distribution Function - Interpolation)',''),sep=' ')
res[30,] <- c('', mylink2, qarr[5,2])
mylink2 <- paste(mylink1,hyperlink('method_6.htm','(Closest Observation)',''),sep=' ')
res[31,] <- c('', mylink2, qarr[6,2])
mylink2 <- paste(mylink1,hyperlink('method_7.htm','(True Basic - Statistics Graphics Toolkit)',''),sep=' ')
res[32,] <- c('', mylink2, qarr[7,2])
mylink2 <- paste(mylink1,hyperlink('method_8.htm','(MS Excel (old versions))',''),sep=' ')
res[33,] <- c('', mylink2, qarr[8,2])
mylink1 <- hyperlink('variation1.htm','Coefficient of Quartile Variation','')
mylink2 <- paste(mylink1,hyperlink('method_1.htm','(Weighted Average at Xnp)',''),sep=' ')
res[34,] <- c('', mylink2, qarr[1,3])
mylink2 <- paste(mylink1,hyperlink('method_2.htm','(Weighted Average at X(n+1)p)',''),sep=' ')
res[35,] <- c('', mylink2, qarr[2,3])
mylink2 <- paste(mylink1,hyperlink('method_3.htm','(Empirical Distribution Function)',''),sep=' ')
res[36,] <- c('', mylink2, qarr[3,3])
mylink2 <- paste(mylink1,hyperlink('method_4.htm','(Empirical Distribution Function - Averaging)',''),sep=' ')
res[37,] <- c('', mylink2, qarr[4,3])
mylink2 <- paste(mylink1,hyperlink('method_5.htm','(Empirical Distribution Function - Interpolation)',''),sep=' ')
res[38,] <- c('', mylink2, qarr[5,3])
mylink2 <- paste(mylink1,hyperlink('method_6.htm','(Closest Observation)',''),sep=' ')
res[39,] <- c('', mylink2, qarr[6,3])
mylink2 <- paste(mylink1,hyperlink('method_7.htm','(True Basic - Statistics Graphics Toolkit)',''),sep=' ')
res[40,] <- c('', mylink2, qarr[7,3])
mylink2 <- paste(mylink1,hyperlink('method_8.htm','(MS Excel (old versions))',''),sep=' ')
res[41,] <- c('', mylink2, qarr[8,3])
res[42,] <- c('Number of all Pairs of Observations', 'pair_numbers.htm', lx*(lx-1)/2)
res[43,] <- c('Squared Differences between all Pairs of Observations', 'squared_differences.htm', sdpo)
res[44,] <- c('Mean Absolute Differences between all Pairs of Observations', 'mean_abs_differences.htm', adpo)
res[45,] <- c('Gini Mean Difference', 'gini_mean_difference.htm', gmd)
res[46,] <- c('Leik Measure of Dispersion', 'leiks_d.htm', bigd)
res[47,] <- c('Index of Diversity', 'diversity.htm', iod)
res[48,] <- c('Index of Qualitative Variation', 'qualitative_variation.htm', iod*lx/(lx-1))
res[49,] <- c('Coefficient of Dispersion', 'dispersion.htm', sum(axmm)/lx/medx)
res[50,] <- c('Observations', '', lx)
res
(arm <- mean(x))
sqrtn <- sqrt(length(x))
(armse <- sd(x) / sqrtn)
(armose <- arm / armse)
(geo <- geomean(x))
(har <- harmean(x))
(qua <- quamean(x))
(win <- winmean(x))
(tri <- trimean(x))
(midr <- midrange(x))
midm <- array(NA,dim=8)
for (j in 1:8) midm[j] <- midmean(x,j)
midm
bitmap(file='test1.png')
lb <- win[,1] - 2*win[,2]
ub <- win[,1] + 2*win[,2]
if ((ylimmin == '') | (ylimmax == '')) plot(win[,1],type='b',main='Robustness of Central Tendency', xlab='j', pch=19, ylab='Winsorized Mean(j/n)', ylim=c(min(lb),max(ub))) else plot(win[,1],type='l',main='Robustness of Central Tendency', xlab='j', pch=19, ylab='Winsorized Mean(j/n)', ylim=c(ylimmin,ylimmax))
lines(ub,lty=3)
lines(lb,lty=3)
grid()
dev.off()
bitmap(file='test2.png')
lb <- tri[,1] - 2*tri[,2]
ub <- tri[,1] + 2*tri[,2]
if ((ylimmin == '') | (ylimmax == '')) plot(tri[,1],type='b',main='Robustness of Central Tendency', xlab='j', pch=19, ylab='Trimmed Mean(j/n)', ylim=c(min(lb),max(ub))) else plot(tri[,1],type='l',main='Robustness of Central Tendency', xlab='j', pch=19, ylab='Trimmed Mean(j/n)', ylim=c(ylimmin,ylimmax))
lines(ub,lty=3)
lines(lb,lty=3)
grid()
dev.off()
a<-table.start()
a<-table.row.start(a)
a<-table.element(a,'Central Tendency - Ungrouped Data',4,TRUE)
a<-table.row.end(a)
a<-table.row.start(a)
a<-table.element(a,'Measure',header=TRUE)
a<-table.element(a,'Value',header=TRUE)
a<-table.element(a,'S.E.',header=TRUE)
a<-table.element(a,'Value/S.E.',header=TRUE)
a<-table.row.end(a)
a<-table.row.start(a)
a<-table.element(a,hyperlink('arithmetic_mean.htm', 'Arithmetic Mean', 'click to view the definition of the Arithmetic Mean'),header=TRUE)
a<-table.element(a,arm)
a<-table.element(a,hyperlink('arithmetic_mean_standard_error.htm', armse, 'click to view the definition of the Standard Error of the Arithmetic Mean'))
a<-table.element(a,armose)
a<-table.row.end(a)
a<-table.row.start(a)
a<-table.element(a,hyperlink('geometric_mean.htm', 'Geometric Mean', 'click to view the definition of the Geometric Mean'),header=TRUE)
a<-table.element(a,geo)
a<-table.element(a,'')
a<-table.row.end(a)
a<-table.row.start(a)
a<-table.element(a,hyperlink('harmonic_mean.htm', 'Harmonic Mean', 'click to view the definition of the Harmonic Mean'),header=TRUE)
a<-table.element(a,har)
a<-table.element(a,'')
a<-table.row.end(a)
a<-table.row.start(a)
a<-table.element(a,hyperlink('quadratic_mean.htm', 'Quadratic Mean', 'click to view the definition of the Quadratic Mean'),header=TRUE)
a<-table.element(a,qua)
a<-table.element(a,'')
a<-table.row.end(a)
for (j in 1:length(win[,1])) {
a<-table.row.start(a)
mylabel <- paste('Winsorized Mean (',j)
mylabel <- paste(mylabel,'/')
mylabel <- paste(mylabel,length(win[,1]))
mylabel <- paste(mylabel,')')
a<-table.element(a,hyperlink('winsorized_mean.htm', mylabel, 'click to view the definition of the Winsorized Mean'),header=TRUE)
a<-table.element(a,win[j,1])
a<-table.element(a,win[j,2])
a<-table.element(a,win[j,1]/win[j,2])
a<-table.row.end(a)
}
for (j in 1:length(tri[,1])) {
a<-table.row.start(a)
mylabel <- paste('Trimmed Mean (',j)
mylabel <- paste(mylabel,'/')
mylabel <- paste(mylabel,length(tri[,1]))
mylabel <- paste(mylabel,')')
a<-table.element(a,hyperlink('arithmetic_mean.htm', mylabel, 'click to view the definition of the Trimmed Mean'),header=TRUE)
a<-table.element(a,tri[j,1])
a<-table.element(a,tri[j,2])
a<-table.element(a,tri[j,1]/tri[j,2])
a<-table.row.end(a)
}
a<-table.row.start(a)
a<-table.element(a,hyperlink('median_1.htm', 'Median', 'click to view the definition of the Median'),header=TRUE)
a<-table.element(a,median(x))
a<-table.element(a,'')
a<-table.row.end(a)
a<-table.row.start(a)
a<-table.element(a,hyperlink('midrange.htm', 'Midrange', 'click to view the definition of the Midrange'),header=TRUE)
a<-table.element(a,midr)
a<-table.element(a,'')
a<-table.row.end(a)
a<-table.row.start(a)
mymid <- hyperlink('midmean.htm', 'Midmean', 'click to view the definition of the Midmean')
mylabel <- paste(mymid,hyperlink('method_1.htm','Weighted Average at Xnp',''),sep=' - ')
a<-table.element(a,mylabel,header=TRUE)
a<-table.element(a,midm[1])
a<-table.element(a,'')
a<-table.row.end(a)
a<-table.row.start(a)
mymid <- hyperlink('midmean.htm', 'Midmean', 'click to view the definition of the Midmean')
mylabel <- paste(mymid,hyperlink('method_2.htm','Weighted Average at X(n+1)p',''),sep=' - ')
a<-table.element(a,mylabel,header=TRUE)
a<-table.element(a,midm[2])
a<-table.element(a,'')
a<-table.row.end(a)
a<-table.row.start(a)
mymid <- hyperlink('midmean.htm', 'Midmean', 'click to view the definition of the Midmean')
mylabel <- paste(mymid,hyperlink('method_3.htm','Empirical Distribution Function',''),sep=' - ')
a<-table.element(a,mylabel,header=TRUE)
a<-table.element(a,midm[3])
a<-table.element(a,'')
a<-table.row.end(a)
a<-table.row.start(a)
mymid <- hyperlink('midmean.htm', 'Midmean', 'click to view the definition of the Midmean')
mylabel <- paste(mymid,hyperlink('method_4.htm','Empirical Distribution Function - Averaging',''),sep=' - ')
a<-table.element(a,mylabel,header=TRUE)
a<-table.element(a,midm[4])
a<-table.element(a,'')
a<-table.row.end(a)
a<-table.row.start(a)
mymid <- hyperlink('midmean.htm', 'Midmean', 'click to view the definition of the Midmean')
mylabel <- paste(mymid,hyperlink('method_5.htm','Empirical Distribution Function - Interpolation',''),sep=' - ')
a<-table.element(a,mylabel,header=TRUE)
a<-table.element(a,midm[5])
a<-table.element(a,'')
a<-table.row.end(a)
a<-table.row.start(a)
mymid <- hyperlink('midmean.htm', 'Midmean', 'click to view the definition of the Midmean')
mylabel <- paste(mymid,hyperlink('method_6.htm','Closest Observation',''),sep=' - ')
a<-table.element(a,mylabel,header=TRUE)
a<-table.element(a,midm[6])
a<-table.element(a,'')
a<-table.row.end(a)
a<-table.row.start(a)
mymid <- hyperlink('midmean.htm', 'Midmean', 'click to view the definition of the Midmean')
mylabel <- paste(mymid,hyperlink('method_7.htm','True Basic - Statistics Graphics Toolkit',''),sep=' - ')
a<-table.element(a,mylabel,header=TRUE)
a<-table.element(a,midm[7])
a<-table.element(a,'')
a<-table.row.end(a)
a<-table.row.start(a)
mymid <- hyperlink('midmean.htm', 'Midmean', 'click to view the definition of the Midmean')
mylabel <- paste(mymid,hyperlink('method_8.htm','MS Excel (old versions)',''),sep=' - ')
a<-table.element(a,mylabel,header=TRUE)
a<-table.element(a,midm[8])
a<-table.element(a,'')
a<-table.row.end(a)
a<-table.row.start(a)
a<-table.element(a,'Number of observations',header=TRUE)
a<-table.element(a,length(x))
a<-table.element(a,'')
a<-table.row.end(a)
a<-table.end(a)
table.save(a,file='mytable.tab')
a<-table.start()
a<-table.row.start(a)
a<-table.element(a,'Variability - Ungrouped Data',2,TRUE)
a<-table.row.end(a)
for (i in 1:num) {
a<-table.row.start(a)
if (res[i,1] != '') {
a<-table.element(a,hyperlink(res[i,2],res[i,1],''),header=TRUE)
} else {
a<-table.element(a,res[i,2],header=TRUE)
}
a<-table.element(a,res[i,3])
a<-table.row.end(a)
}
a<-table.end(a)
table.save(a,file='mytable1.tab')
lx <- length(x)
qval <- array(NA,dim=c(99,8))
mystep <- 25
mystart <- 25
if (lx>10){
mystep=10
mystart=10
}
if (lx>20){
mystep=5
mystart=5
}
if (lx>50){
mystep=2
mystart=2
}
if (lx>=100){
mystep=1
mystart=1
}
for (perc in seq(mystart,99,mystep)) {
qval[perc,1] <- q1(x,lx,perc/100,i,f)
qval[perc,2] <- q2(x,lx,perc/100,i,f)
qval[perc,3] <- q3(x,lx,perc/100,i,f)
qval[perc,4] <- q4(x,lx,perc/100,i,f)
qval[perc,5] <- q5(x,lx,perc/100,i,f)
qval[perc,6] <- q6(x,lx,perc/100,i,f)
qval[perc,7] <- q7(x,lx,perc/100,i,f)
qval[perc,8] <- q8(x,lx,perc/100,i,f)
}
bitmap(file='test3.png')
myqqnorm <- qqnorm(x,col=2)
qqline(x)
grid()
dev.off()
a<-table.start()
a<-table.row.start(a)
a<-table.element(a,'Percentiles - Ungrouped Data',9,TRUE)
a<-table.row.end(a)
a<-table.row.start(a)
a<-table.element(a,'p',1,TRUE)
a<-table.element(a,hyperlink('method_1.htm', 'Weighted Average at Xnp',''),1,TRUE)
a<-table.element(a,hyperlink('method_2.htm','Weighted Average at X(n+1)p',''),1,TRUE)
a<-table.element(a,hyperlink('method_3.htm','Empirical Distribution Function',''),1,TRUE)
a<-table.element(a,hyperlink('method_4.htm','Empirical Distribution Function - Averaging',''),1,TRUE)
a<-table.element(a,hyperlink('method_5.htm','Empirical Distribution Function - Interpolation',''),1,TRUE)
a<-table.element(a,hyperlink('method_6.htm','Closest Observation',''),1,TRUE)
a<-table.element(a,hyperlink('method_7.htm','True Basic - Statistics Graphics Toolkit',''),1,TRUE)
a<-table.element(a,hyperlink('method_8.htm','MS Excel (old versions)',''),1,TRUE)
a<-table.row.end(a)
for (perc in seq(mystart,99,mystep)) {
a<-table.row.start(a)
a<-table.element(a,round(perc/100,2),1,TRUE)
for (j in 1:8) {
a<-table.element(a,round(qval[perc,j],6))
}
a<-table.row.end(a)
}
a<-table.end(a)
table.save(a,file='mytable2.tab')
bitmap(file='histogram1.png')
myhist<-hist(x)
dev.off()
myhist
n <- length(x)
a<-table.start()
a<-table.row.start(a)
a<-table.element(a,hyperlink('histogram.htm','Frequency Table (Histogram)',''),6,TRUE)
a<-table.row.end(a)
a<-table.row.start(a)
a<-table.element(a,'Bins',header=TRUE)
a<-table.element(a,'Midpoint',header=TRUE)
a<-table.element(a,'Abs. Frequency',header=TRUE)
a<-table.element(a,'Rel. Frequency',header=TRUE)
a<-table.element(a,'Cumul. Rel. Freq.',header=TRUE)
a<-table.element(a,'Density',header=TRUE)
a<-table.row.end(a)
crf <- 0
mybracket <- '['
mynumrows <- (length(myhist$breaks)-1)
for (i in 1:mynumrows) {
a<-table.row.start(a)
if (i == 1)
dum <- paste('[',myhist$breaks[i],sep='')
else
dum <- paste(mybracket,myhist$breaks[i],sep='')
dum <- paste(dum,myhist$breaks[i+1],sep=',')
if (i==mynumrows)
dum <- paste(dum,']',sep='')
else
dum <- paste(dum,mybracket,sep='')
a<-table.element(a,dum,header=TRUE)
a<-table.element(a,myhist$mids[i])
a<-table.element(a,myhist$counts[i])
rf <- myhist$counts[i]/n
crf <- crf + rf
a<-table.element(a,round(rf,6))
a<-table.element(a,round(crf,6))
a<-table.element(a,round(myhist$density[i],6))
a<-table.row.end(a)
}
a<-table.end(a)
table.save(a,file='mytable5.tab')
bitmap(file='density1.png')
mydensity1<-density(x,kernel='gaussian',na.rm=TRUE)
plot(mydensity1,main='Gaussian Kernel')
grid()
dev.off()
mydensity1
a<-table.start()
a<-table.row.start(a)
a<-table.element(a,'Properties of Density Trace',2,TRUE)
a<-table.row.end(a)
a<-table.row.start(a)
a<-table.element(a,'Bandwidth',header=TRUE)
a<-table.element(a,mydensity1$bw)
a<-table.row.end(a)
a<-table.row.start(a)
a<-table.element(a,'#Observations',header=TRUE)
a<-table.element(a,mydensity1$n)
a<-table.row.end(a)
a<-table.end(a)
table.save(a,file='mytable4.tab')