Free Statistics

of Irreproducible Research!

Author's title

Author*Unverified author*
R Software Modulerwasp_autocorrelation.wasp
Title produced by software(Partial) Autocorrelation Function
Date of computationThu, 16 Dec 2010 17:59:52 +0000
Cite this page as followsStatistical Computations at FreeStatistics.org, Office for Research Development and Education, URL https://freestatistics.org/blog/index.php?v=date/2010/Dec/16/t12925222728jxq3v1or8lpn9p.htm/, Retrieved Fri, 03 May 2024 07:16:08 +0000
Statistical Computations at FreeStatistics.org, Office for Research Development and Education, URL https://freestatistics.org/blog/index.php?pk=111117, Retrieved Fri, 03 May 2024 07:16:08 +0000
QR Codes:

Original text written by user:
IsPrivate?No (this computation is public)
User-defined keywords
Estimated Impact118
Family? (F = Feedback message, R = changed R code, M = changed R Module, P = changed Parameters, D = changed Data)
-       [(Partial) Autocorrelation Function] [] [2010-12-16 17:59:52] [d41d8cd98f00b204e9800998ecf8427e] [Current]
Feedback Forum

Post a new message
Dataseries X:
655362
873127
1107897
1555964
1671159
1493308
2957796
2638691
1305669
1280496
921900
867888
652586
913831
1108544
1555827
1699283
1509458
3268975
2425016
1312703
1365498
934453
775019
651142
843192
1146766
1652601
1465906
1652734
2922334
2702805
1458956
1410363
1019279
936574
708917
885295
1099663
1576220
1487870
1488635
2882530
2677026
1404398
1344370
936865
872705
628151
953712
1160384
1400618
1661511
1495347
2918786
2775677
1407026
1370199
964526
850851
683118
847224
1073256
1514326
1503734
1507712
2865698
2788128
1391596
1366378
946295
859626


Summary of computational transaction
Raw Inputview raw input (R code)
Raw Outputview raw output of R engine
Computing time2 seconds
R Server'George Udny Yule' @ 72.249.76.132

\begin{tabular}{lllllllll}
\hline
Summary of computational transaction \tabularnewline
Raw Input & view raw input (R code)  \tabularnewline
Raw Output & view raw output of R engine  \tabularnewline
Computing time & 2 seconds \tabularnewline
R Server & 'George Udny Yule' @ 72.249.76.132 \tabularnewline
\hline
\end{tabular}
%Source: https://freestatistics.org/blog/index.php?pk=111117&T=0

[TABLE]
[ROW][C]Summary of computational transaction[/C][/ROW]
[ROW][C]Raw Input[/C][C]view raw input (R code) [/C][/ROW]
[ROW][C]Raw Output[/C][C]view raw output of R engine [/C][/ROW]
[ROW][C]Computing time[/C][C]2 seconds[/C][/ROW]
[ROW][C]R Server[/C][C]'George Udny Yule' @ 72.249.76.132[/C][/ROW]
[/TABLE]
Source: https://freestatistics.org/blog/index.php?pk=111117&T=0

Globally Unique Identifier (entire table): ba.freestatistics.org/blog/index.php?pk=111117&T=0

As an alternative you can also use a QR Code:  

The GUIDs for individual cells are displayed in the table below:

Summary of computational transaction
Raw Inputview raw input (R code)
Raw Outputview raw output of R engine
Computing time2 seconds
R Server'George Udny Yule' @ 72.249.76.132


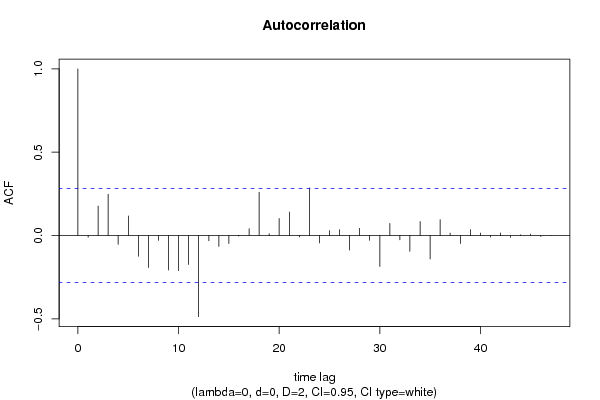
Autocorrelation Function
Time lag kACF(k)T-STATP-value
1-0.011205-0.07760.469222
20.1765341.22310.113638
30.2481281.71910.046022
4-0.05295-0.36690.357671
50.1173480.8130.210114
6-0.124443-0.86220.196442
7-0.192801-1.33580.093963
8-0.02975-0.20610.418788
9-0.207338-1.43650.078676
10-0.211551-1.46570.07463
11-0.174225-1.20710.116661
12-0.487314-3.37620.000732
13-0.031793-0.22030.413299
14-0.06605-0.45760.324649
15-0.048555-0.33640.369019
16-0.003329-0.02310.490846
170.0410290.28430.388719
180.2599561.8010.038991
190.0109060.07560.470043
200.1020440.7070.241498
210.14080.97550.167104
22-0.00836-0.05790.477027
230.2854021.97730.026882
24-0.044415-0.30770.379816
250.0298170.20660.418606
260.0349940.24240.404734
27-0.08759-0.60680.273409
280.0435150.30150.382176
29-0.029072-0.20140.420611
30-0.185874-1.28780.102
310.0727040.50370.308385
32-0.025888-0.17940.429207
33-0.095169-0.65940.256411
340.0833940.57780.28306
35-0.14093-0.97640.166883
360.0951850.65950.256376
370.014560.10090.460034
38-0.048312-0.33470.369648
390.0353340.24480.403826
400.0149790.10380.458889
41-0.009657-0.06690.473466
420.0153730.10650.457812
43-0.011564-0.08010.468239
440.0038270.02650.489478
450.0085520.05920.4765
46-0.006583-0.04560.481907
470.0003360.00230.499077
48NANANA

\begin{tabular}{lllllllll}
\hline
Autocorrelation Function \tabularnewline
Time lag k & ACF(k) & T-STAT & P-value \tabularnewline
1 & -0.011205 & -0.0776 & 0.469222 \tabularnewline
2 & 0.176534 & 1.2231 & 0.113638 \tabularnewline
3 & 0.248128 & 1.7191 & 0.046022 \tabularnewline
4 & -0.05295 & -0.3669 & 0.357671 \tabularnewline
5 & 0.117348 & 0.813 & 0.210114 \tabularnewline
6 & -0.124443 & -0.8622 & 0.196442 \tabularnewline
7 & -0.192801 & -1.3358 & 0.093963 \tabularnewline
8 & -0.02975 & -0.2061 & 0.418788 \tabularnewline
9 & -0.207338 & -1.4365 & 0.078676 \tabularnewline
10 & -0.211551 & -1.4657 & 0.07463 \tabularnewline
11 & -0.174225 & -1.2071 & 0.116661 \tabularnewline
12 & -0.487314 & -3.3762 & 0.000732 \tabularnewline
13 & -0.031793 & -0.2203 & 0.413299 \tabularnewline
14 & -0.06605 & -0.4576 & 0.324649 \tabularnewline
15 & -0.048555 & -0.3364 & 0.369019 \tabularnewline
16 & -0.003329 & -0.0231 & 0.490846 \tabularnewline
17 & 0.041029 & 0.2843 & 0.388719 \tabularnewline
18 & 0.259956 & 1.801 & 0.038991 \tabularnewline
19 & 0.010906 & 0.0756 & 0.470043 \tabularnewline
20 & 0.102044 & 0.707 & 0.241498 \tabularnewline
21 & 0.1408 & 0.9755 & 0.167104 \tabularnewline
22 & -0.00836 & -0.0579 & 0.477027 \tabularnewline
23 & 0.285402 & 1.9773 & 0.026882 \tabularnewline
24 & -0.044415 & -0.3077 & 0.379816 \tabularnewline
25 & 0.029817 & 0.2066 & 0.418606 \tabularnewline
26 & 0.034994 & 0.2424 & 0.404734 \tabularnewline
27 & -0.08759 & -0.6068 & 0.273409 \tabularnewline
28 & 0.043515 & 0.3015 & 0.382176 \tabularnewline
29 & -0.029072 & -0.2014 & 0.420611 \tabularnewline
30 & -0.185874 & -1.2878 & 0.102 \tabularnewline
31 & 0.072704 & 0.5037 & 0.308385 \tabularnewline
32 & -0.025888 & -0.1794 & 0.429207 \tabularnewline
33 & -0.095169 & -0.6594 & 0.256411 \tabularnewline
34 & 0.083394 & 0.5778 & 0.28306 \tabularnewline
35 & -0.14093 & -0.9764 & 0.166883 \tabularnewline
36 & 0.095185 & 0.6595 & 0.256376 \tabularnewline
37 & 0.01456 & 0.1009 & 0.460034 \tabularnewline
38 & -0.048312 & -0.3347 & 0.369648 \tabularnewline
39 & 0.035334 & 0.2448 & 0.403826 \tabularnewline
40 & 0.014979 & 0.1038 & 0.458889 \tabularnewline
41 & -0.009657 & -0.0669 & 0.473466 \tabularnewline
42 & 0.015373 & 0.1065 & 0.457812 \tabularnewline
43 & -0.011564 & -0.0801 & 0.468239 \tabularnewline
44 & 0.003827 & 0.0265 & 0.489478 \tabularnewline
45 & 0.008552 & 0.0592 & 0.4765 \tabularnewline
46 & -0.006583 & -0.0456 & 0.481907 \tabularnewline
47 & 0.000336 & 0.0023 & 0.499077 \tabularnewline
48 & NA & NA & NA \tabularnewline
\hline
\end{tabular}
%Source: https://freestatistics.org/blog/index.php?pk=111117&T=1

[TABLE]
[ROW][C]Autocorrelation Function[/C][/ROW]
[ROW][C]Time lag k[/C][C]ACF(k)[/C][C]T-STAT[/C][C]P-value[/C][/ROW]
[ROW][C]1[/C][C]-0.011205[/C][C]-0.0776[/C][C]0.469222[/C][/ROW]
[ROW][C]2[/C][C]0.176534[/C][C]1.2231[/C][C]0.113638[/C][/ROW]
[ROW][C]3[/C][C]0.248128[/C][C]1.7191[/C][C]0.046022[/C][/ROW]
[ROW][C]4[/C][C]-0.05295[/C][C]-0.3669[/C][C]0.357671[/C][/ROW]
[ROW][C]5[/C][C]0.117348[/C][C]0.813[/C][C]0.210114[/C][/ROW]
[ROW][C]6[/C][C]-0.124443[/C][C]-0.8622[/C][C]0.196442[/C][/ROW]
[ROW][C]7[/C][C]-0.192801[/C][C]-1.3358[/C][C]0.093963[/C][/ROW]
[ROW][C]8[/C][C]-0.02975[/C][C]-0.2061[/C][C]0.418788[/C][/ROW]
[ROW][C]9[/C][C]-0.207338[/C][C]-1.4365[/C][C]0.078676[/C][/ROW]
[ROW][C]10[/C][C]-0.211551[/C][C]-1.4657[/C][C]0.07463[/C][/ROW]
[ROW][C]11[/C][C]-0.174225[/C][C]-1.2071[/C][C]0.116661[/C][/ROW]
[ROW][C]12[/C][C]-0.487314[/C][C]-3.3762[/C][C]0.000732[/C][/ROW]
[ROW][C]13[/C][C]-0.031793[/C][C]-0.2203[/C][C]0.413299[/C][/ROW]
[ROW][C]14[/C][C]-0.06605[/C][C]-0.4576[/C][C]0.324649[/C][/ROW]
[ROW][C]15[/C][C]-0.048555[/C][C]-0.3364[/C][C]0.369019[/C][/ROW]
[ROW][C]16[/C][C]-0.003329[/C][C]-0.0231[/C][C]0.490846[/C][/ROW]
[ROW][C]17[/C][C]0.041029[/C][C]0.2843[/C][C]0.388719[/C][/ROW]
[ROW][C]18[/C][C]0.259956[/C][C]1.801[/C][C]0.038991[/C][/ROW]
[ROW][C]19[/C][C]0.010906[/C][C]0.0756[/C][C]0.470043[/C][/ROW]
[ROW][C]20[/C][C]0.102044[/C][C]0.707[/C][C]0.241498[/C][/ROW]
[ROW][C]21[/C][C]0.1408[/C][C]0.9755[/C][C]0.167104[/C][/ROW]
[ROW][C]22[/C][C]-0.00836[/C][C]-0.0579[/C][C]0.477027[/C][/ROW]
[ROW][C]23[/C][C]0.285402[/C][C]1.9773[/C][C]0.026882[/C][/ROW]
[ROW][C]24[/C][C]-0.044415[/C][C]-0.3077[/C][C]0.379816[/C][/ROW]
[ROW][C]25[/C][C]0.029817[/C][C]0.2066[/C][C]0.418606[/C][/ROW]
[ROW][C]26[/C][C]0.034994[/C][C]0.2424[/C][C]0.404734[/C][/ROW]
[ROW][C]27[/C][C]-0.08759[/C][C]-0.6068[/C][C]0.273409[/C][/ROW]
[ROW][C]28[/C][C]0.043515[/C][C]0.3015[/C][C]0.382176[/C][/ROW]
[ROW][C]29[/C][C]-0.029072[/C][C]-0.2014[/C][C]0.420611[/C][/ROW]
[ROW][C]30[/C][C]-0.185874[/C][C]-1.2878[/C][C]0.102[/C][/ROW]
[ROW][C]31[/C][C]0.072704[/C][C]0.5037[/C][C]0.308385[/C][/ROW]
[ROW][C]32[/C][C]-0.025888[/C][C]-0.1794[/C][C]0.429207[/C][/ROW]
[ROW][C]33[/C][C]-0.095169[/C][C]-0.6594[/C][C]0.256411[/C][/ROW]
[ROW][C]34[/C][C]0.083394[/C][C]0.5778[/C][C]0.28306[/C][/ROW]
[ROW][C]35[/C][C]-0.14093[/C][C]-0.9764[/C][C]0.166883[/C][/ROW]
[ROW][C]36[/C][C]0.095185[/C][C]0.6595[/C][C]0.256376[/C][/ROW]
[ROW][C]37[/C][C]0.01456[/C][C]0.1009[/C][C]0.460034[/C][/ROW]
[ROW][C]38[/C][C]-0.048312[/C][C]-0.3347[/C][C]0.369648[/C][/ROW]
[ROW][C]39[/C][C]0.035334[/C][C]0.2448[/C][C]0.403826[/C][/ROW]
[ROW][C]40[/C][C]0.014979[/C][C]0.1038[/C][C]0.458889[/C][/ROW]
[ROW][C]41[/C][C]-0.009657[/C][C]-0.0669[/C][C]0.473466[/C][/ROW]
[ROW][C]42[/C][C]0.015373[/C][C]0.1065[/C][C]0.457812[/C][/ROW]
[ROW][C]43[/C][C]-0.011564[/C][C]-0.0801[/C][C]0.468239[/C][/ROW]
[ROW][C]44[/C][C]0.003827[/C][C]0.0265[/C][C]0.489478[/C][/ROW]
[ROW][C]45[/C][C]0.008552[/C][C]0.0592[/C][C]0.4765[/C][/ROW]
[ROW][C]46[/C][C]-0.006583[/C][C]-0.0456[/C][C]0.481907[/C][/ROW]
[ROW][C]47[/C][C]0.000336[/C][C]0.0023[/C][C]0.499077[/C][/ROW]
[ROW][C]48[/C][C]NA[/C][C]NA[/C][C]NA[/C][/ROW]
[/TABLE]
Source: https://freestatistics.org/blog/index.php?pk=111117&T=1

Globally Unique Identifier (entire table): ba.freestatistics.org/blog/index.php?pk=111117&T=1

As an alternative you can also use a QR Code:  

The GUIDs for individual cells are displayed in the table below:

Autocorrelation Function
Time lag kACF(k)T-STATP-value
1-0.011205-0.07760.469222
20.1765341.22310.113638
30.2481281.71910.046022
4-0.05295-0.36690.357671
50.1173480.8130.210114
6-0.124443-0.86220.196442
7-0.192801-1.33580.093963
8-0.02975-0.20610.418788
9-0.207338-1.43650.078676
10-0.211551-1.46570.07463
11-0.174225-1.20710.116661
12-0.487314-3.37620.000732
13-0.031793-0.22030.413299
14-0.06605-0.45760.324649
15-0.048555-0.33640.369019
16-0.003329-0.02310.490846
170.0410290.28430.388719
180.2599561.8010.038991
190.0109060.07560.470043
200.1020440.7070.241498
210.14080.97550.167104
22-0.00836-0.05790.477027
230.2854021.97730.026882
24-0.044415-0.30770.379816
250.0298170.20660.418606
260.0349940.24240.404734
27-0.08759-0.60680.273409
280.0435150.30150.382176
29-0.029072-0.20140.420611
30-0.185874-1.28780.102
310.0727040.50370.308385
32-0.025888-0.17940.429207
33-0.095169-0.65940.256411
340.0833940.57780.28306
35-0.14093-0.97640.166883
360.0951850.65950.256376
370.014560.10090.460034
38-0.048312-0.33470.369648
390.0353340.24480.403826
400.0149790.10380.458889
41-0.009657-0.06690.473466
420.0153730.10650.457812
43-0.011564-0.08010.468239
440.0038270.02650.489478
450.0085520.05920.4765
46-0.006583-0.04560.481907
470.0003360.00230.499077
48NANANA


Partial Autocorrelation Function
Time lag kPACF(k)T-STATP-value
1-0.011205-0.07760.469222
20.1764311.22230.113772
30.2598541.80030.039048
4-0.075213-0.52110.30235
50.0242390.16790.433672
6-0.17771-1.23120.112122
7-0.225523-1.56250.062373
8-0.045526-0.31540.376907
9-0.069272-0.47990.316728
10-0.148366-1.02790.154573
11-0.145255-1.00640.159645
12-0.474895-3.29020.00094
13-0.116389-0.80640.212004
140.0926580.6420.261979
150.2314881.60380.05766
16-0.079663-0.55190.291781
17-0.115617-0.8010.213535
180.0470580.3260.372911
19-0.169492-1.17430.12304
20-0.058713-0.40680.34299
21-0.016671-0.11550.454264
22-0.256665-1.77820.04085
230.0335650.23250.408551
24-0.287442-1.99150.026069
25-0.023915-0.16570.434549
26-0.041654-0.28860.387071
270.0544410.37720.353851
28-0.015162-0.1050.458388
290.0863150.5980.276324
30-0.020063-0.1390.445016
31-0.11073-0.76720.223372
32-0.07592-0.5260.300658
33-0.08714-0.60370.274435
34-0.056529-0.39160.348527
350.010640.07370.47077
36-0.131981-0.91440.182541
37-0.030525-0.21150.416704
38-0.113786-0.78830.217189
390.0017730.01230.495126
400.1234260.85510.198367
410.0385670.26720.395231
42-0.032132-0.22260.412389
43-0.102387-0.70940.240768
44-0.012613-0.08740.465364
45-0.000217-0.00150.499404
46-0.075382-0.52230.301945
470.0040640.02820.488827
48NANANA

\begin{tabular}{lllllllll}
\hline
Partial Autocorrelation Function \tabularnewline
Time lag k & PACF(k) & T-STAT & P-value \tabularnewline
1 & -0.011205 & -0.0776 & 0.469222 \tabularnewline
2 & 0.176431 & 1.2223 & 0.113772 \tabularnewline
3 & 0.259854 & 1.8003 & 0.039048 \tabularnewline
4 & -0.075213 & -0.5211 & 0.30235 \tabularnewline
5 & 0.024239 & 0.1679 & 0.433672 \tabularnewline
6 & -0.17771 & -1.2312 & 0.112122 \tabularnewline
7 & -0.225523 & -1.5625 & 0.062373 \tabularnewline
8 & -0.045526 & -0.3154 & 0.376907 \tabularnewline
9 & -0.069272 & -0.4799 & 0.316728 \tabularnewline
10 & -0.148366 & -1.0279 & 0.154573 \tabularnewline
11 & -0.145255 & -1.0064 & 0.159645 \tabularnewline
12 & -0.474895 & -3.2902 & 0.00094 \tabularnewline
13 & -0.116389 & -0.8064 & 0.212004 \tabularnewline
14 & 0.092658 & 0.642 & 0.261979 \tabularnewline
15 & 0.231488 & 1.6038 & 0.05766 \tabularnewline
16 & -0.079663 & -0.5519 & 0.291781 \tabularnewline
17 & -0.115617 & -0.801 & 0.213535 \tabularnewline
18 & 0.047058 & 0.326 & 0.372911 \tabularnewline
19 & -0.169492 & -1.1743 & 0.12304 \tabularnewline
20 & -0.058713 & -0.4068 & 0.34299 \tabularnewline
21 & -0.016671 & -0.1155 & 0.454264 \tabularnewline
22 & -0.256665 & -1.7782 & 0.04085 \tabularnewline
23 & 0.033565 & 0.2325 & 0.408551 \tabularnewline
24 & -0.287442 & -1.9915 & 0.026069 \tabularnewline
25 & -0.023915 & -0.1657 & 0.434549 \tabularnewline
26 & -0.041654 & -0.2886 & 0.387071 \tabularnewline
27 & 0.054441 & 0.3772 & 0.353851 \tabularnewline
28 & -0.015162 & -0.105 & 0.458388 \tabularnewline
29 & 0.086315 & 0.598 & 0.276324 \tabularnewline
30 & -0.020063 & -0.139 & 0.445016 \tabularnewline
31 & -0.11073 & -0.7672 & 0.223372 \tabularnewline
32 & -0.07592 & -0.526 & 0.300658 \tabularnewline
33 & -0.08714 & -0.6037 & 0.274435 \tabularnewline
34 & -0.056529 & -0.3916 & 0.348527 \tabularnewline
35 & 0.01064 & 0.0737 & 0.47077 \tabularnewline
36 & -0.131981 & -0.9144 & 0.182541 \tabularnewline
37 & -0.030525 & -0.2115 & 0.416704 \tabularnewline
38 & -0.113786 & -0.7883 & 0.217189 \tabularnewline
39 & 0.001773 & 0.0123 & 0.495126 \tabularnewline
40 & 0.123426 & 0.8551 & 0.198367 \tabularnewline
41 & 0.038567 & 0.2672 & 0.395231 \tabularnewline
42 & -0.032132 & -0.2226 & 0.412389 \tabularnewline
43 & -0.102387 & -0.7094 & 0.240768 \tabularnewline
44 & -0.012613 & -0.0874 & 0.465364 \tabularnewline
45 & -0.000217 & -0.0015 & 0.499404 \tabularnewline
46 & -0.075382 & -0.5223 & 0.301945 \tabularnewline
47 & 0.004064 & 0.0282 & 0.488827 \tabularnewline
48 & NA & NA & NA \tabularnewline
\hline
\end{tabular}
%Source: https://freestatistics.org/blog/index.php?pk=111117&T=2

[TABLE]
[ROW][C]Partial Autocorrelation Function[/C][/ROW]
[ROW][C]Time lag k[/C][C]PACF(k)[/C][C]T-STAT[/C][C]P-value[/C][/ROW]
[ROW][C]1[/C][C]-0.011205[/C][C]-0.0776[/C][C]0.469222[/C][/ROW]
[ROW][C]2[/C][C]0.176431[/C][C]1.2223[/C][C]0.113772[/C][/ROW]
[ROW][C]3[/C][C]0.259854[/C][C]1.8003[/C][C]0.039048[/C][/ROW]
[ROW][C]4[/C][C]-0.075213[/C][C]-0.5211[/C][C]0.30235[/C][/ROW]
[ROW][C]5[/C][C]0.024239[/C][C]0.1679[/C][C]0.433672[/C][/ROW]
[ROW][C]6[/C][C]-0.17771[/C][C]-1.2312[/C][C]0.112122[/C][/ROW]
[ROW][C]7[/C][C]-0.225523[/C][C]-1.5625[/C][C]0.062373[/C][/ROW]
[ROW][C]8[/C][C]-0.045526[/C][C]-0.3154[/C][C]0.376907[/C][/ROW]
[ROW][C]9[/C][C]-0.069272[/C][C]-0.4799[/C][C]0.316728[/C][/ROW]
[ROW][C]10[/C][C]-0.148366[/C][C]-1.0279[/C][C]0.154573[/C][/ROW]
[ROW][C]11[/C][C]-0.145255[/C][C]-1.0064[/C][C]0.159645[/C][/ROW]
[ROW][C]12[/C][C]-0.474895[/C][C]-3.2902[/C][C]0.00094[/C][/ROW]
[ROW][C]13[/C][C]-0.116389[/C][C]-0.8064[/C][C]0.212004[/C][/ROW]
[ROW][C]14[/C][C]0.092658[/C][C]0.642[/C][C]0.261979[/C][/ROW]
[ROW][C]15[/C][C]0.231488[/C][C]1.6038[/C][C]0.05766[/C][/ROW]
[ROW][C]16[/C][C]-0.079663[/C][C]-0.5519[/C][C]0.291781[/C][/ROW]
[ROW][C]17[/C][C]-0.115617[/C][C]-0.801[/C][C]0.213535[/C][/ROW]
[ROW][C]18[/C][C]0.047058[/C][C]0.326[/C][C]0.372911[/C][/ROW]
[ROW][C]19[/C][C]-0.169492[/C][C]-1.1743[/C][C]0.12304[/C][/ROW]
[ROW][C]20[/C][C]-0.058713[/C][C]-0.4068[/C][C]0.34299[/C][/ROW]
[ROW][C]21[/C][C]-0.016671[/C][C]-0.1155[/C][C]0.454264[/C][/ROW]
[ROW][C]22[/C][C]-0.256665[/C][C]-1.7782[/C][C]0.04085[/C][/ROW]
[ROW][C]23[/C][C]0.033565[/C][C]0.2325[/C][C]0.408551[/C][/ROW]
[ROW][C]24[/C][C]-0.287442[/C][C]-1.9915[/C][C]0.026069[/C][/ROW]
[ROW][C]25[/C][C]-0.023915[/C][C]-0.1657[/C][C]0.434549[/C][/ROW]
[ROW][C]26[/C][C]-0.041654[/C][C]-0.2886[/C][C]0.387071[/C][/ROW]
[ROW][C]27[/C][C]0.054441[/C][C]0.3772[/C][C]0.353851[/C][/ROW]
[ROW][C]28[/C][C]-0.015162[/C][C]-0.105[/C][C]0.458388[/C][/ROW]
[ROW][C]29[/C][C]0.086315[/C][C]0.598[/C][C]0.276324[/C][/ROW]
[ROW][C]30[/C][C]-0.020063[/C][C]-0.139[/C][C]0.445016[/C][/ROW]
[ROW][C]31[/C][C]-0.11073[/C][C]-0.7672[/C][C]0.223372[/C][/ROW]
[ROW][C]32[/C][C]-0.07592[/C][C]-0.526[/C][C]0.300658[/C][/ROW]
[ROW][C]33[/C][C]-0.08714[/C][C]-0.6037[/C][C]0.274435[/C][/ROW]
[ROW][C]34[/C][C]-0.056529[/C][C]-0.3916[/C][C]0.348527[/C][/ROW]
[ROW][C]35[/C][C]0.01064[/C][C]0.0737[/C][C]0.47077[/C][/ROW]
[ROW][C]36[/C][C]-0.131981[/C][C]-0.9144[/C][C]0.182541[/C][/ROW]
[ROW][C]37[/C][C]-0.030525[/C][C]-0.2115[/C][C]0.416704[/C][/ROW]
[ROW][C]38[/C][C]-0.113786[/C][C]-0.7883[/C][C]0.217189[/C][/ROW]
[ROW][C]39[/C][C]0.001773[/C][C]0.0123[/C][C]0.495126[/C][/ROW]
[ROW][C]40[/C][C]0.123426[/C][C]0.8551[/C][C]0.198367[/C][/ROW]
[ROW][C]41[/C][C]0.038567[/C][C]0.2672[/C][C]0.395231[/C][/ROW]
[ROW][C]42[/C][C]-0.032132[/C][C]-0.2226[/C][C]0.412389[/C][/ROW]
[ROW][C]43[/C][C]-0.102387[/C][C]-0.7094[/C][C]0.240768[/C][/ROW]
[ROW][C]44[/C][C]-0.012613[/C][C]-0.0874[/C][C]0.465364[/C][/ROW]
[ROW][C]45[/C][C]-0.000217[/C][C]-0.0015[/C][C]0.499404[/C][/ROW]
[ROW][C]46[/C][C]-0.075382[/C][C]-0.5223[/C][C]0.301945[/C][/ROW]
[ROW][C]47[/C][C]0.004064[/C][C]0.0282[/C][C]0.488827[/C][/ROW]
[ROW][C]48[/C][C]NA[/C][C]NA[/C][C]NA[/C][/ROW]
[/TABLE]
Source: https://freestatistics.org/blog/index.php?pk=111117&T=2

Globally Unique Identifier (entire table): ba.freestatistics.org/blog/index.php?pk=111117&T=2

As an alternative you can also use a QR Code:  

The GUIDs for individual cells are displayed in the table below:

Partial Autocorrelation Function
Time lag kPACF(k)T-STATP-value
1-0.011205-0.07760.469222
20.1764311.22230.113772
30.2598541.80030.039048
4-0.075213-0.52110.30235
50.0242390.16790.433672
6-0.17771-1.23120.112122
7-0.225523-1.56250.062373
8-0.045526-0.31540.376907
9-0.069272-0.47990.316728
10-0.148366-1.02790.154573
11-0.145255-1.00640.159645
12-0.474895-3.29020.00094
13-0.116389-0.80640.212004
140.0926580.6420.261979
150.2314881.60380.05766
16-0.079663-0.55190.291781
17-0.115617-0.8010.213535
180.0470580.3260.372911
19-0.169492-1.17430.12304
20-0.058713-0.40680.34299
21-0.016671-0.11550.454264
22-0.256665-1.77820.04085
230.0335650.23250.408551
24-0.287442-1.99150.026069
25-0.023915-0.16570.434549
26-0.041654-0.28860.387071
270.0544410.37720.353851
28-0.015162-0.1050.458388
290.0863150.5980.276324
30-0.020063-0.1390.445016
31-0.11073-0.76720.223372
32-0.07592-0.5260.300658
33-0.08714-0.60370.274435
34-0.056529-0.39160.348527
350.010640.07370.47077
36-0.131981-0.91440.182541
37-0.030525-0.21150.416704
38-0.113786-0.78830.217189
390.0017730.01230.495126
400.1234260.85510.198367
410.0385670.26720.395231
42-0.032132-0.22260.412389
43-0.102387-0.70940.240768
44-0.012613-0.08740.465364
45-0.000217-0.00150.499404
46-0.075382-0.52230.301945
470.0040640.02820.488827
48NANANA


Parameters (Session):
par1 = 48 ; par2 = 0.0 ; par3 = 2 ; par4 = 1 ; par5 = 12 ; par6 = White Noise ; par7 = 0.95 ;
Parameters (R input):
par1 = 48 ; par2 = 0.0 ; par3 = 0 ; par4 = 2 ; par5 = 12 ; par6 = White Noise ; par7 = 0.95 ; par8 = ;
R code (references can be found in the software module):
if (par1 == 'Default') {
par1 = 10*log10(length(x))
} else {
par1 <- as.numeric(par1)
}
par2 <- as.numeric(par2)
par3 <- as.numeric(par3)
par4 <- as.numeric(par4)
par5 <- as.numeric(par5)
if (par6 == 'White Noise') par6 <- 'white' else par6 <- 'ma'
par7 <- as.numeric(par7)
if (par8 != '') par8 <- as.numeric(par8)
ox <- x
if (par8 == '') {
if (par2 == 0) {
x <- log(x)
} else {
x <- (x ^ par2 - 1) / par2
}
} else {
x <- log(x,base=par8)
}
if (par3 > 0) x <- diff(x,lag=1,difference=par3)
if (par4 > 0) x <- diff(x,lag=par5,difference=par4)
bitmap(file='picts.png')
op <- par(mfrow=c(2,1))
plot(ox,type='l',main='Original Time Series',xlab='time',ylab='value')
if (par8=='') {
mytitle <- paste('Working Time Series (lambda=',par2,', d=',par3,', D=',par4,')',sep='')
mysub <- paste('(lambda=',par2,', d=',par3,', D=',par4,', CI=', par7, ', CI type=',par6,')',sep='')
} else {
mytitle <- paste('Working Time Series (base=',par8,', d=',par3,', D=',par4,')',sep='')
mysub <- paste('(base=',par8,', d=',par3,', D=',par4,', CI=', par7, ', CI type=',par6,')',sep='')
}
plot(x,type='l', main=mytitle,xlab='time',ylab='value')
par(op)
dev.off()
bitmap(file='pic1.png')
racf <- acf(x, par1, main='Autocorrelation', xlab='time lag', ylab='ACF', ci.type=par6, ci=par7, sub=mysub)
dev.off()
bitmap(file='pic2.png')
rpacf <- pacf(x,par1,main='Partial Autocorrelation',xlab='lags',ylab='PACF',sub=mysub)
dev.off()
(myacf <- c(racf$acf))
(mypacf <- c(rpacf$acf))
lengthx <- length(x)
sqrtn <- sqrt(lengthx)
load(file='createtable')
a<-table.start()
a<-table.row.start(a)
a<-table.element(a,'Autocorrelation Function',4,TRUE)
a<-table.row.end(a)
a<-table.row.start(a)
a<-table.element(a,'Time lag k',header=TRUE)
a<-table.element(a,hyperlink('basics.htm','ACF(k)','click here for more information about the Autocorrelation Function'),header=TRUE)
a<-table.element(a,'T-STAT',header=TRUE)
a<-table.element(a,'P-value',header=TRUE)
a<-table.row.end(a)
for (i in 2:(par1+1)) {
a<-table.row.start(a)
a<-table.element(a,i-1,header=TRUE)
a<-table.element(a,round(myacf[i],6))
mytstat <- myacf[i]*sqrtn
a<-table.element(a,round(mytstat,4))
a<-table.element(a,round(1-pt(abs(mytstat),lengthx),6))
a<-table.row.end(a)
}
a<-table.end(a)
table.save(a,file='mytable.tab')
a<-table.start()
a<-table.row.start(a)
a<-table.element(a,'Partial Autocorrelation Function',4,TRUE)
a<-table.row.end(a)
a<-table.row.start(a)
a<-table.element(a,'Time lag k',header=TRUE)
a<-table.element(a,hyperlink('basics.htm','PACF(k)','click here for more information about the Partial Autocorrelation Function'),header=TRUE)
a<-table.element(a,'T-STAT',header=TRUE)
a<-table.element(a,'P-value',header=TRUE)
a<-table.row.end(a)
for (i in 1:par1) {
a<-table.row.start(a)
a<-table.element(a,i,header=TRUE)
a<-table.element(a,round(mypacf[i],6))
mytstat <- mypacf[i]*sqrtn
a<-table.element(a,round(mytstat,4))
a<-table.element(a,round(1-pt(abs(mytstat),lengthx),6))
a<-table.row.end(a)
}
a<-table.end(a)
table.save(a,file='mytable1.tab')