Free Statistics
of Irreproducible Research!
Description of Statistical Computation | |||||||||||||||||||||||||||||||||||||||||
|---|---|---|---|---|---|---|---|---|---|---|---|---|---|---|---|---|---|---|---|---|---|---|---|---|---|---|---|---|---|---|---|---|---|---|---|---|---|---|---|---|---|
| Author's title | |||||||||||||||||||||||||||||||||||||||||
| Author | *The author of this computation has been verified* | ||||||||||||||||||||||||||||||||||||||||
| R Software Module | rwasp_univariatedataseries.wasp | ||||||||||||||||||||||||||||||||||||||||
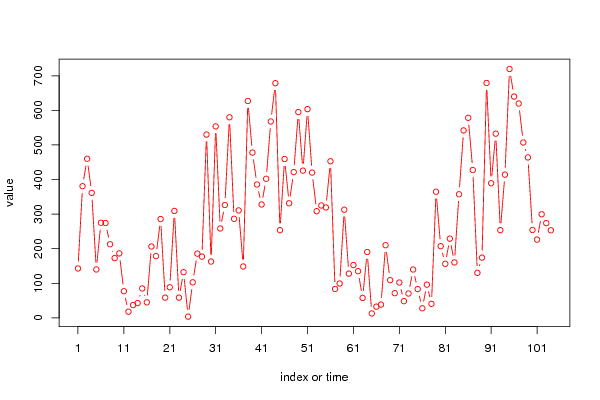
| Title produced by software | Univariate Data Series | ||||||||||||||||||||||||||||||||||||||||
| Date of computation | Thu, 16 Dec 2010 15:24:23 +0000 | ||||||||||||||||||||||||||||||||||||||||
| Cite this page as follows | Statistical Computations at FreeStatistics.org, Office for Research Development and Education, URL https://freestatistics.org/blog/index.php?v=date/2010/Dec/16/t1292512951n1db6lv4m29ffly.htm/, Retrieved Fri, 03 May 2024 06:44:38 +0000 | ||||||||||||||||||||||||||||||||||||||||
| Statistical Computations at FreeStatistics.org, Office for Research Development and Education, URL https://freestatistics.org/blog/index.php?pk=111018, Retrieved Fri, 03 May 2024 06:44:38 +0000 | |||||||||||||||||||||||||||||||||||||||||
| QR Codes: | |||||||||||||||||||||||||||||||||||||||||
|
| |||||||||||||||||||||||||||||||||||||||||
| Original text written by user: | |||||||||||||||||||||||||||||||||||||||||
| IsPrivate? | No (this computation is public) | ||||||||||||||||||||||||||||||||||||||||
| User-defined keywords | |||||||||||||||||||||||||||||||||||||||||
| Estimated Impact | 153 | ||||||||||||||||||||||||||||||||||||||||
Tree of Dependent Computations | |||||||||||||||||||||||||||||||||||||||||
| Family? (F = Feedback message, R = changed R code, M = changed R Module, P = changed Parameters, D = changed Data) | |||||||||||||||||||||||||||||||||||||||||
| - [Univariate Data Series] [Tijdreeks: Zonnes...] [2010-12-16 15:24:23] [0605ea080d54454c99180f574351b8e4] [Current] | |||||||||||||||||||||||||||||||||||||||||
| Feedback Forum | |||||||||||||||||||||||||||||||||||||||||
Post a new message | |||||||||||||||||||||||||||||||||||||||||
Dataset | |||||||||||||||||||||||||||||||||||||||||
| Dataseries X: | |||||||||||||||||||||||||||||||||||||||||
142,86 380,71 460,00 361,43 140,00 275,00 274,29 212,86 172,86 186,43 77,14 17,86 37,14 42,86 85,00 45,00 206,43 178,57 285,71 58,57 88,57 309,29 58,57 132,14 3,57 102,86 185,71 177,14 530,00 162,86 553,57 258,57 326,43 580,00 286,43 310,71 148,57 627,14 477,86 385,71 327,86 402,14 567,86 678,57 253,57 459,29 331,43 421,43 595,00 425,71 603,57 420,00 308,57 325,00 319,29 452,86 83,57 99,43 312,71 128,00 152,67 135,00 57,71 190,43 12,86 32,43 38,29 210,14 109,14 71,43 102,29 48,43 70,43 139,86 83,14 27,71 96,14 40,57 364,71 207,43 156,29 229,00 160,43 357,43 542,00 578,43 427,43 130,29 174,29 679,14 389,43 532,57 253,71 414,14 719,71 639,86 619,71 507,14 463,86 254,14 226,29 299,57 274,00 253,29 | |||||||||||||||||||||||||||||||||||||||||
Tables (Output of Computation) | |||||||||||||||||||||||||||||||||||||||||
| |||||||||||||||||||||||||||||||||||||||||
Figures (Output of Computation) | |||||||||||||||||||||||||||||||||||||||||
Input Parameters & R Code | |||||||||||||||||||||||||||||||||||||||||
| Parameters (Session): | |||||||||||||||||||||||||||||||||||||||||
| par1 = Zonneschijnduur ; par2 = Meteo België ; par4 = No season ; | |||||||||||||||||||||||||||||||||||||||||
| Parameters (R input): | |||||||||||||||||||||||||||||||||||||||||
| par1 = Zonneschijnduur ; par2 = Meteo België ; par3 = ; par4 = No season ; | |||||||||||||||||||||||||||||||||||||||||
| R code (references can be found in the software module): | |||||||||||||||||||||||||||||||||||||||||
if (par4 != 'No season') { | |||||||||||||||||||||||||||||||||||||||||